Research Article - Journal of Food Technology and Preservation (2023) Volume 7, Issue 6
The effects of different sorghum varieties on the microbial fermentation dynamics of Huangjiu (Chinese-rice-wine)
KaWang Li, Umut Yucel, Valentina Trinetta*Food Science Institute, Kansas State University, Manhattan, USA
- *Corresponding Author:
- Valentina Trinetta
Food Science Institute
Kansas State University
Manhattan, USA
E-mail: ombamalu@uwc.ac.za
Received: 14-Sep-2023, Manuscript No. AAFTP-23-113827; Editor assigned: 18-Sep-2023, PreQC No. AAFTP-23-113827 (PQ); Reviewed: 02-Oct-2023, QC No. AAFTP-23-113827; Revised: 16-Oct-2023, Manuscript No. AAFTP-23-113827 (R); Published: 01-Nov-2023, DOI:10.35841/2591-796X-7.6.201
Citation: Trinetta V. The effects of different sorghum varieties on the microbial fermentation dynamics of Huangjiu (Chinese-rice-wine). J Food Technol Pres. 2023;7(6):201
Abstract
Huangjiu (Chinese-rice-wine) is a fermented alcoholic beverage traditionally brewed with cereal grains (mainly wheat and rice) and wheat Qu (starter cultures), thus making it undesirable to consumers with gluten dietary restrictions. With the increased interest towards developing alternative food products for niche markets (gluten intolerant consumers), sorghum represents an ideal candidate due to the lack of gluten and important source of dietary antioxidants. Therefore, the objective of this research was to study the effect on fermentation dynamics when a gluten-free commercially available starter was used to produce Huangjiu from sorghum. Three different sorghum whole grain varieties (white, waxy, sumac) were used as substrates. Microbial and physiochemical analysis were conducted in triplicates. Taxonomy annotation and Principal Coordinates Analysis (PCoA) were used to describe the microbial profiles of the sorghum Hangjiu. By the end of the study, the three sorghum Hangjiu reached the pH range between 3.7 to 4.1, Aerobic bacteria, yeasts and molds increased progressively during the first part of the fermentation and followed a steady decline by day-10. Saccharomyces was the dominant genera detected in the starter culture and in the final fermented product. The highest fermentation yield was observed in sorghum (Table 1). This study demonstrated the possibility of using alternative ingredients in Huangjiu production by utilizing a different substrate (e.g., sorghum) for consumer’s niche market.
Keywords
Sorghum-Based food, Huangjiu, Fermentation dynamics.
Introduction
Globalization has caused the uptake of Asian culture in the west for the past decades with Asian food culture entering the popular lifestyle. Recent reports showed Asian dining as the largest segment in single location full-service restaurants in America, with $45.6 billion revenue in 2021 [1]. At the same time, also the interest in eastern-styled fermented beverages has risen and in particular for beverages derived from rice, such as Huangjiu, a fermented alcoholic beverage traditionally brewed with cereal grains (mainly wheat and rice) and wheat Qu (starter cultures) [2]. Huangjiu, or Chinese rice wine, has a long and celebrated history in the culinary culture, since it is one of the most ancient alcoholic drinks, alongside wine, and beer. Huangjiu is known for its unique and full-bodied flavor profile with relatively low alcohol content. This non-distilled alcoholic drink contains plenty of variations native to different regions [3-5].
Huangjiu production mainly consists of three steps: selection and pre-treatment of raw materials (rice, corn, wheat, or millet), fermentation, and post-process treatment [6]. The selected grains are soaked in water for 2-3 days before steaming. The starter, composed of dry rice flour, wheat and Rhizopus spp. is added to the steamed, cooled grains to jump start the saccharification, breaking down the grains into sugars, peptides, and amino acids that are converted during fermentation [7]. After a primary fermentation at 30°c for 5-7 days, the mash enters a secondary fermentation for up to 2 months at 15°c before being filter-pressed, clarified and pasteurized for safe consumption [8].
Since Huangjiu production traditionally involved wheat, this fermented beverage is unsuitable for people with wheat allergy, gluten sensitivity, or celiac disease. A recent survey showed that celiac disease affects about 1% of people in most populations, with an increasing trend of diagnosis rates [9]. The market demand for gluten-free products in foodservice and retail is projected to reach $11.4 billion by 2026 in the United States of America (USA) [10]. Altering the ingredients in Huangjiu production by utilizing a different substrate (e.g., sorghum) might offer a suitable alternative for this niche market.
Sorghum is one of the top five cereal crops in the world, and the USA is the world’s leading producer, with about 11.4 million metric tons of sorghum produced in 2020 [11]. This grain is primarily used for animal feed production, ethanol and biofuel, but it is attracting attention in the food industry because of its nutritional value and versatility in applications [12]. Compared to other cereals, sorghum has high antioxidant activities and lower digestion rate [13]. These properties offer food scientists and product development professionals’ creative ways for gluten-free market applications. Nevertheless, not much is known about the microbial dynamics when alternative substrates, e.g., sorghum produced in USA, is used for Huangjiu production. Therefore, the objective of this research was to study the effects on microbial population when three different types of sorghum (namely white, waxy and sumac) grown in the USA were used for Huangjiu fermentation. The types of sorghum in this study were selected based on antioxidants levels, fiber contents and applications versatility for the food industry.
Materials and Methods
Whole sorghum grains and starter culture
Grain sorghum can take many shapes and sizes (tight-headed, round panicle to an open, droopy panicle, short or tall) and it comes in red, orange, bronze, tan, white, and black varieties. Three commercially available sorghum varieties (NU life market, LLC., Scott City, KS, USA) were used in this study: white whole sorghum grain (NLSC-WSWG-0010, lot# 210722-NLM10), a sustainable ancient grain, non-tannin that is grown using fewer natural resources, typically made into flour for food production; waxy burgundy whole sorghum grain (NLSC-WBBWG-0014L, Lot# 210811-NLM-20), a thinner bran layer, with lower gelatinization temperature and amylopectin starch; and sumac whole sorghum grain (NLSCSUSWG- 0018, Lot# 210811-NLM-SB), with a high-tannin, high-polyphenolics contents and excellent anti-inflammatory properties [14,15]. For analysis purposes sorghum flour was prepared on a cyclone mill with a 0.5mm and/or 0.25mm screen based on analytical request and the starter culture “Angel Yeast” (Angel Yeast co., Hubei, PRC) was purchased from an online supplier in bulk of 500g.
Huangjiu preparation
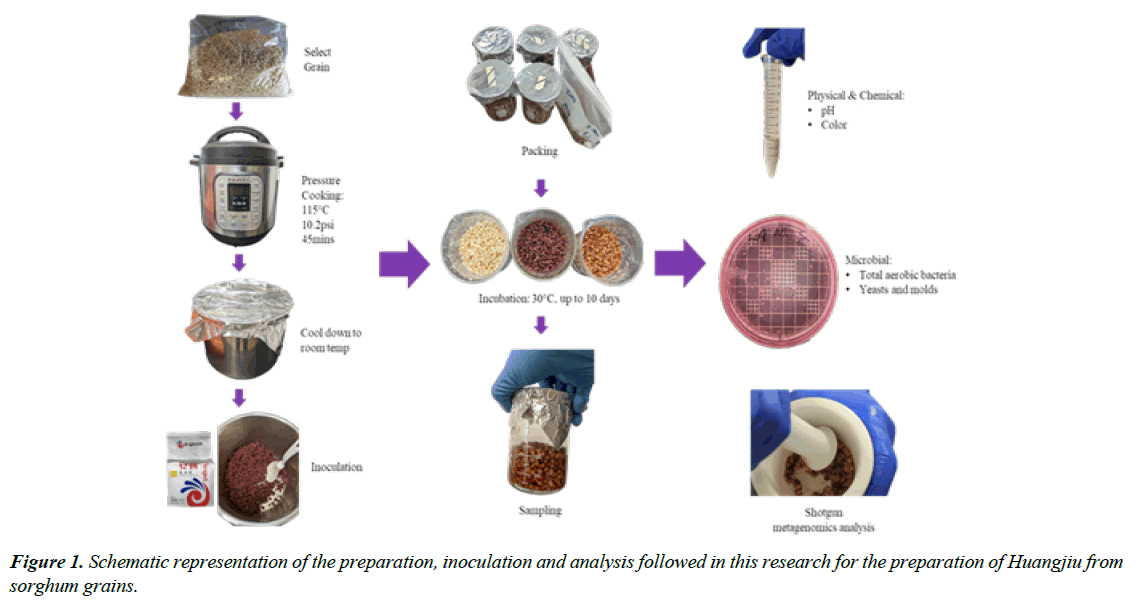
The preparation of Huangjiu was developed in our laboratory based on literature review [14,16-20]. A schematic representation of the preparation, inoculation and analysis followed in this research for the preparation of Huangjiu is shown in Figure 1 below. Briefly, white, waxy, and sumac raw whole sorghum grains were rinsed three times, cooked with a 1:2 weight ratio of dry grain to water using a pressure cooker (Instant Pot Duo, Instant Brands™ Inc., Ontario, CA) for 45 minutes (115 - 118°C and 10.2 - 11.6psi). The cooked sorghum (substrate) was covered with aluminum foil and cooled until it reached room temperature (20 ± 2°C). The commercial starter was then added (0.8% w/w) and mixed thoroughly. The inoculated mixture was divided into portions of 100g inside sterile beakers, packed tightly, covered with aluminum foil, and incubated at 30°C for 10 days. This procedure was repeated for each sorghum type. At the end of the fermentation process two products were obtained: a liquid fraction (Huangjiu) and a solid fraction (spent grain).
Physical and Chemical Analysis
At the beginning and the end of the fermentation period (0 and 10 days), the pH of the liquid fractions obtained from the different fermented grains were recorded using a calibrated pH meter (Traceable® Digital pH/ORP pH meter, VWR, Texas, USA). Yield of the liquid fraction was calculated as a percentage of decanted liquid into a 50 ml graduated cylinder and the volume was reported. Additionally, the color of the liquids was observed using a visual scale color coded by 3 food scientists who reached consensus on grading the colors from lightest to darkest [21].
Microbiological analysis
The pattern of microbial succession throughout the fermentation process was studied. At appropriate sampling points (0, 1, 3, 5, 7, and 10 day), 25g of grain/liquid mixture was collected and homogenized in 1:10 volume of 0.1% Buffered Peptone Water (Becton, Dickinson and Company, NJ, USA). The samples were then serially diluted and enumerated to log10 CFU/g for yeasts and molds and total aerobic bacteria by spread plating onto Rose Bengal Agar (Becton, Dickinson and Company, NJ, USA), and incubated at 25°C for 48 hours, and Aerobic Count (AC) 3M Petrifilms (3M, MN, USA) and incubated at 37°C for 24 hours, respectively.
DNA extraction, shotgun sequencing and bioinformatics analysis
Total genomic DNA was extracted at day 0 from the three sorghum grains before starter addition (negative controls), and from the grain/liquid mixture at day 1 and 10. The starter alone was used as positive control. DNA was obtained using the PowerSoil Pro Kit (QIAGEN, Hilden, Germany) according to the manufacturer’s instructions. DNA was quantified using Qubit 4 (Q32857, Invitrogen, MA, USA). DNA extracts were stored at -20°C until further use. DNA libraries were prepared using the Nextera DNA Flex Library Preparation Kit (Illumina, USA). The prepared library of each sample was quantified, and quality controls were performed. Libraries were pooled at equimolar amounts, and sequencing was performed with 2×150 bp chemistry on a NovaSeq 6000 platform (Illumina).
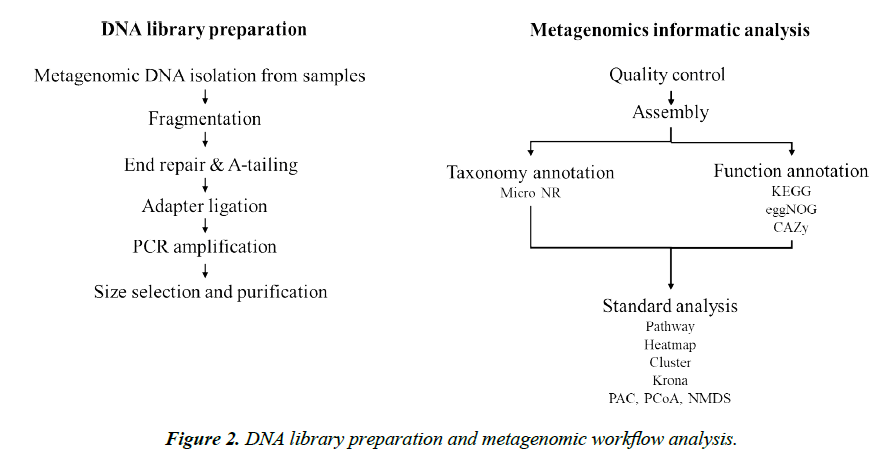
A workflow for DNA library prep and metagenomics analysis performed on the samples collected in this study is given in Figure 2. Briefly, original sequence reads were pre-processed by trimming low quality bases (Q-value ≤ 38), reads containing over 10bp N nucleotides, or reads containing over 15bp of overlapping adapter. Bowtie2 was used to minimize host DNA. The metagenomic reads were compared to the database of taxonomically informative gene families (microNR database) for homolog annotation. Taxonomic ranks were based on gene abundance and analyzed using Krona analysis (https://github. com/marbl/Krona/wiki). Gene prediction was carried out by MetaGeneMark based on the Scaftigs assembling. Predicted genes were pooled together for dereplication to construct gene catalogue. The abundance information of the gene catalogue for each sample was obtained by comparing clean data of each sample from the gene catalogue. The function of the coding sequences was inferred by comparing their similarity to sequences in the databases (KEGG, eggNOG, CAZy, etc), a principal coordinate analysis (PCoA) and heat maps were used for describing the relative abundance in the metagenome.
Data Analysis
Throughout the fermentation process, assays (Microbial count, pH, color) were run in triplicates for each grain variety and sampling time. Sample unit was defined as 25g of each grain variations at the sampling interval (Total N= 21). Collected data were analyzed and plotted in Microsoft Excel and means comparison of microbial population and physiochemical traits during fermentation were determined by T-Test with a significance level of α = 0.05.
Results and Discussion
Changes in physical characteristics during fermentation
High-pressure cooking was used to ensure the microbial safety and quality of the cooked whole sorghum grain kernels. The whole sorghum grain softens while retaining their color during cooking. White and sumac cooked grain had a fluffy appearance, whereas cooked whole waxy grain appeared to be sticky, possibly due to starch activation during stirring after the grains were cooked
After cooking, some visual physical differences based on the sorghum variety used as fermentation substrates were observed featuring different characteristics in the final product as well. Water entered sorghum kernels during high-pressure cooking and resulted in physical changes in the kernels, hydrated the chemical components, and almost doubled the volume of cooked sorghum kernels. Starch granules were hydrated, swelled, and gelatinized. During fermentation, the liquid fraction yield increased with time. White sorghum grain had the highest liquid yield after 10 days of fermentation (Table 1). Waxy sorghum grain had the earliest sign of free water release out of the three, as early as day 1, sumac sorghum showed the lowest volume of free water release throughout the duration of the study, likely due to the high polyphenolic contents as compared to the waxy variety. The liquid fraction yield varied based on the grain variety used. Sorghum Huangjiu production from sumac had the lowest yield amongst the three varieties. The color of the three sorghum Huangjiu did not differ from their whole grain color at the end of 10-day fermentation, white, waxy, and sumac sorghum Huangjius appeared white/ yellowish, red, and dark brownish red, respectively. All three sorghum grains started with pH values above 6.30 (Table 1), as the organic acids in the fermented substrates accumulated during fermentation, the pH decreased over time.
| Sorghum sample | Visual color | pH | Yield (%) | |
|---|---|---|---|---|
| Day 0 | Day 10 | |||
| White whole sorghum | Light yellow | 6.61 ± 0.0a | 4.1 ± 0.2a | 55 ± 1.33a |
| Waxy whole sorghum | Yellow | 6.65 ± 0.0a | 3.9 ± 0.1a | 51 ± 3.34b |
| Sumac whole sorghum | Dark red | 6.36 ± 0.0a | 3.7 ± 0.2a | 50 ± 0.26b |
within the same column indicate that there is a significant difference between the sorghum types (p < 0.05).
Table 1. Visual color, pH and yield of the liquid fractions obtained from the different grain varieties after 10 days of fermentation.
Changes in microbial populations during fermentation
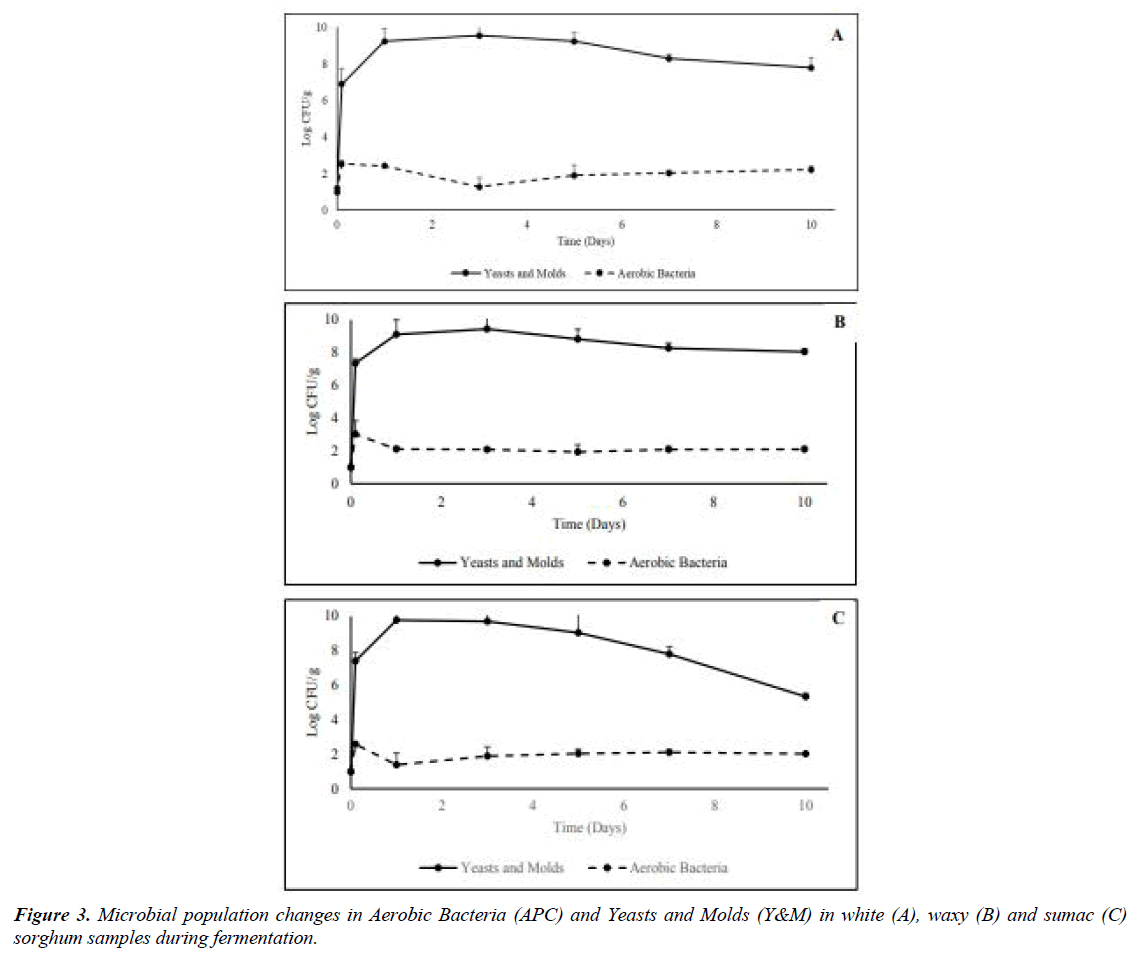
With the addition of the starter, the level of aerobic bacteria, yeasts and molds were significantly increased up to ~ 3 log CFU/g and ~ 7 log, respectively on day 0 (p<0.05). The changes of microbial population during fermentation are shown in Figure 3 below. After the boost from the inoculation starter, aerobic bacteria counts were between 1.28 to 2.11 log CFU/g until the endpoint for the three sorghum grains. Aerobic bacteria population remained steady overtime, no noticeable changes were observed when different sorghum varieties were used as substrates. This could be due to the stable environment provided by cooked sorghum grains, and the concise inoculation of the fermentation starter, providing dominance of certain microbes. Different observations were made for the yeasts and molds population. After the significant uptrend in population (p<0.05) between inoculation day and day 1 for all three grains, from the fermentation starter. No significant changes (p>0.05) in yeasts and molds population for white (Figure 3A) and waxy (Figure 3B) over time, while a significant decline (p<0.05) was reported when sumac sorghum was used as fermentation substrate (Figure 3C). The yeast and molds population reacting to different fermentation by-products differently based on the difference in chemical compositions in the sorghum varieties, the higher tannins level of this variety as compared to the other sorghum types used and the antifungal effect of these compounds might be observed here [22].
Metagenomic sequencing and composition profiling of microbial communities
Processed samples had more than 99.9% reads passed quality control and host filtering. All samples had an average read length between 772 to 1426 bp.
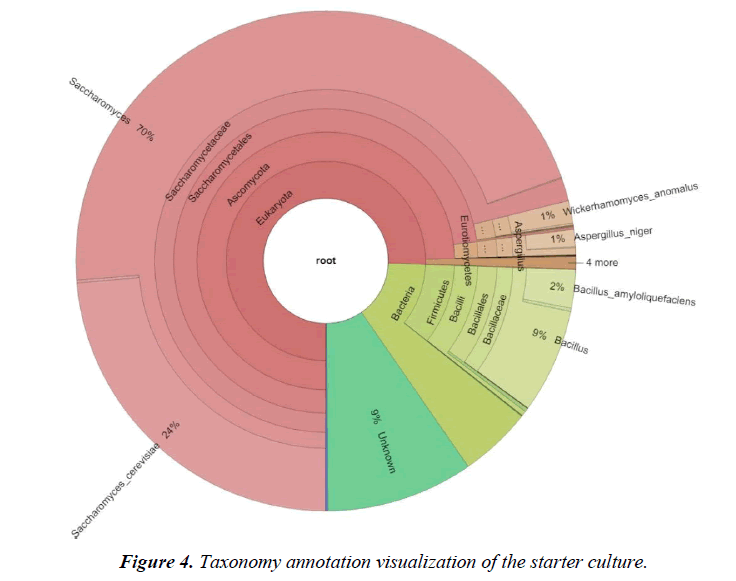
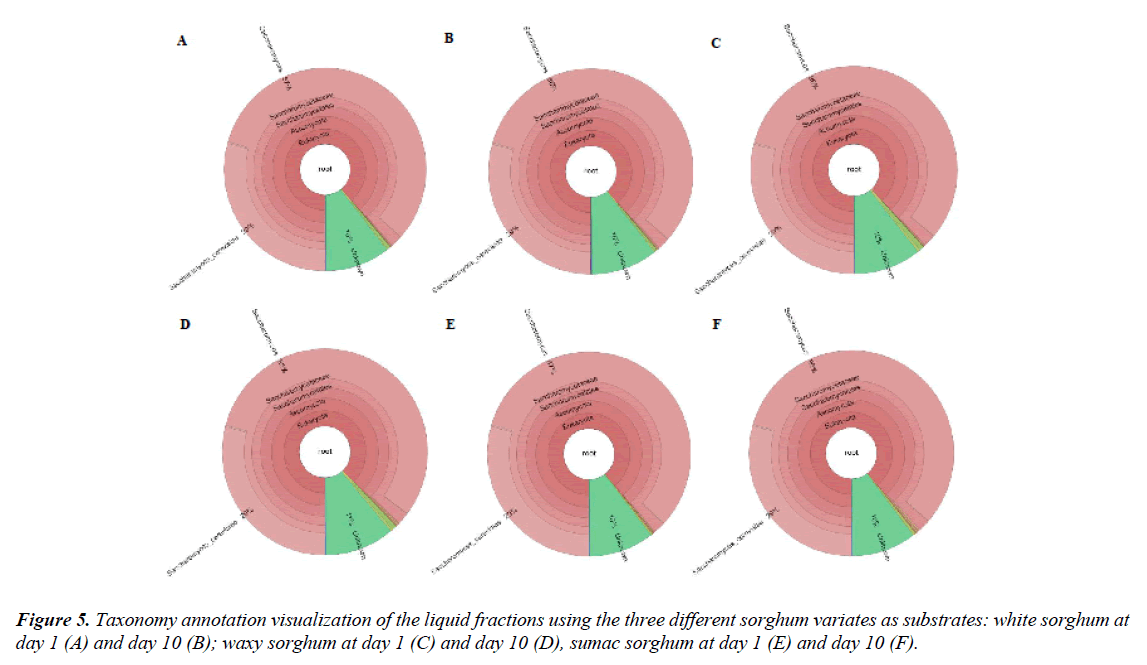
While the labeling of the commercial starter culture purchased in this study listed rice flour and Rhyzopus spp. as the main ingredients, Krona analysis identified 70% of the starter culture as Saccharomyces spp. (Figure 4). The starter culture also contained also bacteria (~15%), most belonging of belonged to the genus Bacillus. It also contained 1% Aspergillus mold. Findings from this study were slightly different from those reported by [23,24] where Rhizopus, Aspergillus, Saccharomyces and bacteria belonging to genus Weissella, Pediococcus, Pantoea, and Lactobacillus were isolated from Huangjiu starter cultures. Rhizopus spp. was not found in the starter samples and not have much variety in the bacteria populations was observed. Possible explanations include the use of different commercially available starter culture, as compared to the one used in this study, or the use of starters not in the market or from different regions of the world. Figure 5 described the taxonomy annotation of the liquid fractions when white (A-B), waxy (C-D) and sumac (E-F) where used as substrate for fermentation. Saccharomyces spp. Continue to be taxonomically relevant with concentrations varying from 85 to 87%. No significant difference (p>0.05) among sorghum varieties or sampling days (day 1 or day 10) was observed. This may be due to the enduring property of Saccharomyces spp. allowing them to thrive in osmotic, temperature and ethanol stresses found in the fermentation environment [25].
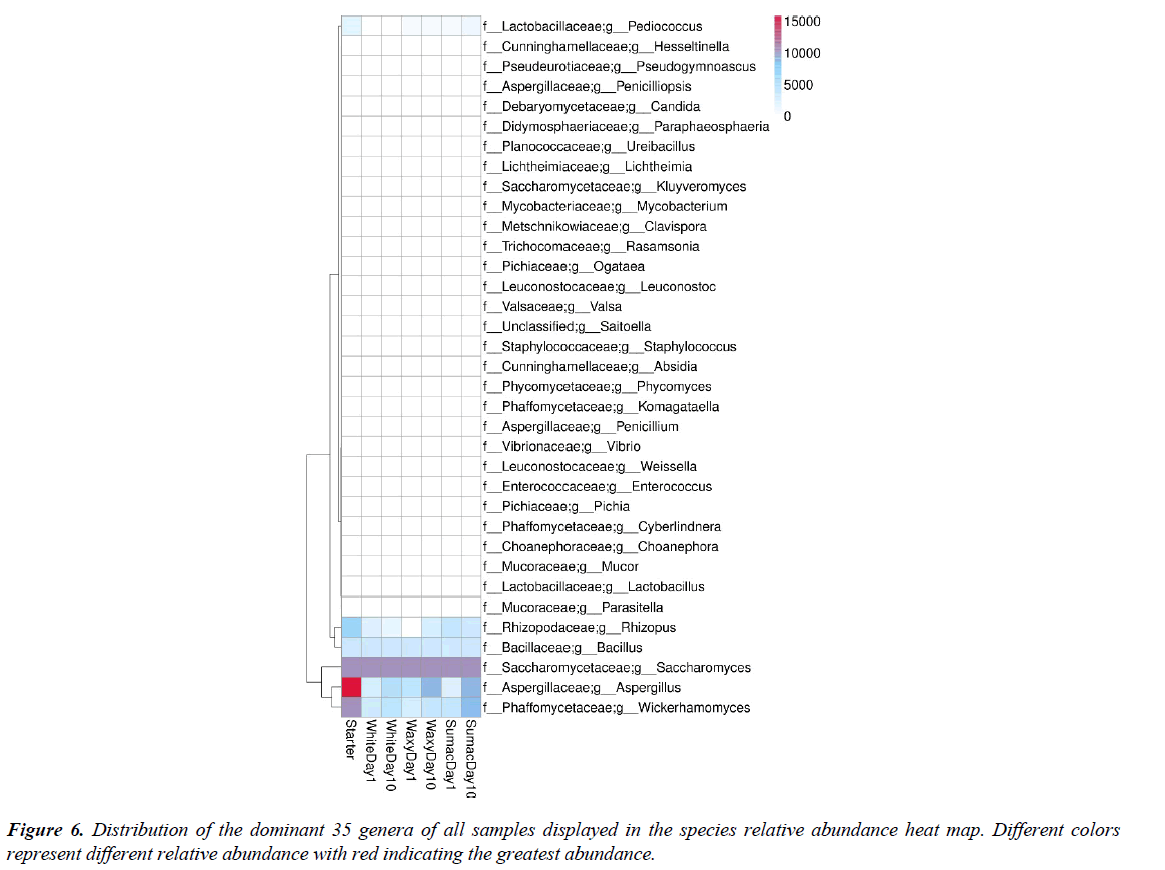
Heatmaps are a useful method to explore multivariate data sets, where the response variables (in this study relative abundances) are visualized using color gradients scheme. Figure 6 represents the distribution of the dominant 35 genera of all samples displayed in the relative abundance heat map. Different colors represent different relative abundance of the genus in all seven samples tested, with red indicating the greatest abundance. The genus Aspergillus spp. was the most abundant in the starter culture (red color in Figure 6), but its presence was inconsistent during the fermentation. The blue colors indicate low relative abundance at day 1 with a slight increased at day 10. This pattern was common to all the samples tested, independently of the variety of sorghum used as substrate. Conversely the relative abundance of Saccharomyces was high and constant (purple color) over time in all samples, no differences among sampling days or grains were observed. Similar trends were observed also for Bacillus spp. This genus was persistent across all samples and varieties, but with relatively low abundance (light blue). Similar findings were reported by Liang et al. [26] that observed Aspergillus and Rhizopus dominant at the beginning of the fermentation but rapidly outcompeted by Saccharomyces and other bacteria during fermentation, similarly to our observations, likely due to ethanol metabolized by Saccharomyces increased toxicity towards populations that does not share the same metabolic pathway, suppressing their growth [26].
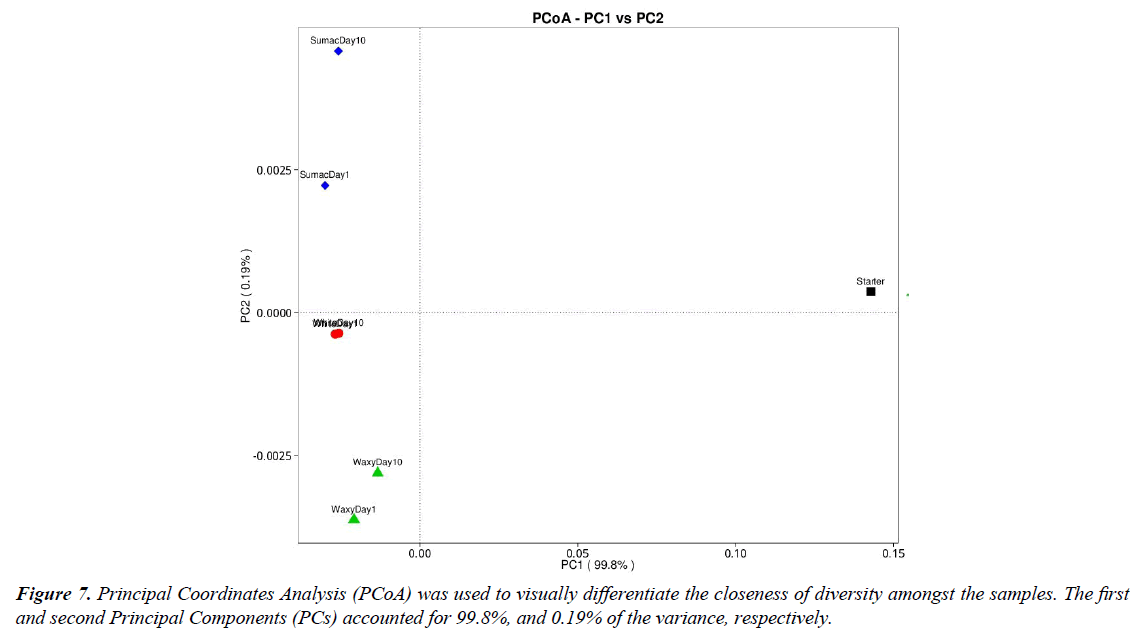
The principal coordinate analysis (PCoA) was conducted to visualize the closeness of diversity among samples (Figure 7) and to demonstrate data similarities or differences in the fungal and bacterial community. The PCoA score plot shows that all the liquid samples varied significantly in fungal and bacterial community as compared to the starter sample. The close positions among waxy samples and white samples highlight their similar principal genera composition, while sumac samples were separated in the PCoA plot, indicating a significant difference genera composition between day 1 and day 10.
Conclusion
This study explored changes in microbial population when different varieties of sorghum were used to produce a glutenfree sorghum Huangjiu, showcasing the potential of leveraging fermentation to improve the utilization of sorghum grain for human consumption. Additional research is needed, which was beyond the scope of this study, to measure the alcohol content, nutritional value, and conduct sensory evaluation of the different treatments and compare to traditional Huangjiu.
Acknowledgements
Funding for this research was made available by the USDA/ ARS.
Conflicts of Interest
Authors declare no conflicts of interest. The authors wish to thank Dr. Shuping Yan of USDA/ARS, Manhattan, KS for suggesting this research idea.
References
- IBISWorld. Single location full-service restaurants in the US. 2021.
- Chen GM, Huang ZR, Wu L, et al. Microbial diversity and flavor of Chinese rice wine (Huangjiu): An overview of current research and future prospects. Curr Opin Food Sci. 2021;42:37-50.
- Chen S, Xu Y. The influence of yeast strains on the volatile flavour compounds of Chinese rice wine. J Inst Brew. 2010;116(2):190-6.
- Ren Q, Sun L, Wu H, et al. The changes of microbial community and flavor compound in the fermentation process of Chinese rice wine using Fagopyrum tataricum grain as feedstock. Sci Rep. 2019;9(1):3365.
- Sun B. Chinese national alcohols: Baijiu and Huangjiu. World Scientific; 2021. 275.
- Yang Y, Hu W, Xia Y, et al. Flavor formation in Chinese rice wine (Huangjiu): Impacts of the flavor-active microorganisms, raw materials, and fermentation technology. Front Microbiol. 2020;11:580247.
- Chen S, Xu Y. Adaptive evolution of Saccharomyces cerevisiae with enhanced ethanol tolerance for Chinese rice wine fermentation. Appl Biochem Biotechnol. 2014;173:1940-54.
- Tian S, Zeng W, Fang F, et al. The microbiome of Chinese rice wine (Huangjiu). Curr Res Food Sci. 2022;5:325-35.
- Lebwohl B, Sanders DS, Green PH. Coeliac disease. The Lancet. 2018;391(10115):70-81.
- Research and Markets ltd. United States gluten free food market, size, forecast 2023-2028, industry trends, growth, impact of inflation, opportunity company analysis. 2021.
- Statista. Sorghum production worldwide in 2021/2022, by leading country (in 1,000 metric tons). 2022.
- McGinnis MJ, Painter JE. Sorghum: History, use, and health benefits. Nutrition Today. 2020;55(1):38-44.
- Rooney LW, Awika JM. Overview of products and health benefits of specialty sorghums1. Cereal Foods World. 2005;50(3):109-115.
- De Morais Cardoso L, Pinheiro SS, Martino HS, et al. Sorghum (Sorghum bicolor L.): Nutrients, bioactive compounds, and potential impact on human health. Crit Rev Food Sci Nutr. 2017;57(2):372-90.
- Stefoska-Needham A, Beck EJ, Johnson SK, Tapsell LC. Sorghum: An underutilized cereal whole grain with the potential to assist in the prevention of chronic disease. Food Rev Int. 2015;31(4):401–37.
- Sun H, Wang H, Zhang P, et al. Changes in phenolic content, antioxidant activity, and volatile compounds during processing of fermented sorghum grain tea. Cereal Chem. 2020;97(3):612–25.
- Guo H, Yang X, Zhou H, et al. Comparison of nutritional composition, aroma compounds, and biological activities of two kinds of tartary buckwheat tea. J Food Sci. 2017;82(7):1735-41.
- Xiong Y, Zhang P, Luo J, et al. Effect of processing on the phenolic contents, antioxidant activity and volatile compounds of sorghum grain tea. J Cereal Sci. 2019;85:6–14.
- Wu L, Huang Z, Qin P, et al. Effects of processing on phytochemical profiles and biological activities for production of sorghum tea. Food Res Int. 2013;53(2):678–85.
- Liu C, Gong X, Zhao G, et al. Liquor flavour is associated with the physicochemical property and microbial diversity of fermented grains in waxy and non-waxy sorghum (sorghum bicolor) during Fermentation. Front Microbiol. 2021;12:618458.
- Pathare PB, Opara UL, Al-Said FAJ. Colour measurement and analysis in fresh and processed foods: A review. Food Bioprocess Technol. 2013;6(1):36–60.
- Latté KP, Kolodziej H. Antifungal effects of hydrolysable tannins and related compounds on dermatophytes, mould fungi and yeasts. Z Für Naturforschung C. 2000;55(5–6):467–72.
- Cai H, Zhang T, Zhang Q, et al. Microbial diversity and chemical analysis of the starters used in traditional Chinese sweet rice wine. Food Microbiol. 2018;73:319-26.
- Chen C, Liu Y, Tian H, et al. Metagenomic analysis reveals the impact of JIUYAO microbial diversity on fermentation and the volatile profile of Shaoxing-jiu. Food Microbiol. 2020;86:103326.
- Wimalasena TT, Greetham D, Marvin ME, et al. Phenotypic characterisation of Saccharomyces spp. yeast for tolerance to stresses encountered during fermentation of lignocellulosic residues to produce bioethanol. Microb Cell Factories. 2014;13(1):47.
- Liang Z, Su H, Lin X, et al. Microbial communities and amino acids during the fermentation of Wuyi Hong Qu Huangjiu. LWT. 2020;130:109743.
Indexed at, Google Scholar, Cross Ref
Indexed at, Google Scholar, Cross Ref
Indexed at, Google Scholar, Cross Ref
Indexed at, Google Scholar, Cross Ref
Indexed at, Google Scholar, Cross Ref
Indexed at, Google Scholar, Cross Ref
Indexed at, Google Scholar, Cross Ref
Indexed at, Google Scholar, Cross Ref
Indexed at, Google Scholar, Cross Ref
Indexed at, Google Scholar, Cross Ref
Indexed at, Google Scholar, Cross Ref
Indexed at, Google Scholar, Cross Ref
Indexed at, Google Scholar, Cross Ref
Indexed at, Google Scholar, Cross Ref
Indexed at, Google Scholar, Cross Ref
Indexed at, Google Scholar, Cross Ref
Indexed at, Google Scholar, Cross Ref
Indexed at, Google Scholar, Cross Ref
Indexed at, Google Scholar, Cross Ref
Indexed at, Google Scholar, Cross Ref
