Research Article - Journal of Food Technology and Preservation (2023) Volume 7, Issue 3
Sensory evaluation and acceptability of vegetable biscuit.
Adelaide Spio Kwofie1*, Josephine Abakah Turkson2
1Department of Hospitality Management, Takoradi Technical University, Takoradi, Ghana
2Department of Hospitality Management, Cape Coast Technical University, Cape Coast, Ghana
- Corresponding Author:
- Adelaide Spio-Kwofie
Department of Hospitality Management
Takoradi Technical University
Takoradi, Ghana
E-mail: adelaide.spio-kwofie@ttu.edu.gh
Received: 18-Jan-2023, Manuscript No. AAFTP-23-87374; Editor assigned: 20-Jan-2022, PreQC No. AAFTP-23-87374 (PQ); Reviewed: 02-Mar-2023, QC No. AAFTP-23-87374; Revised: 07-Mar-2023, Manuscript No. AAFTP-23-87374 (R); Published: 14-Mar-2023, DOI:10.35841/2591-796X-7.3.171
Citation: Kwofie AS. Sensory evaluation and acceptability of vegetable biscuit. J Food Technol Pres. 2023;7(3):171
Abstract
Higher intakes of fruits and vegetables rich in micronutrients have been associated with better mental health. Thus, healthy eating patterns are important to establish during early childhood because they may continue to adulthood. The study was undertaken to improve intake of vegetables among children through the preparation of vegetable biscuit of acceptable quality. The sensory evaluation was conducted on 60 children using a Likert scale to evaluate the coded samples. The following attributes were used to evaluate the samples; colour, taste, flavor, texture and overall acceptability. All the data obtained were analyzed statistically to determine the level of significance of variation in observations caused by the changes in the biscuit’s formulations. The proximate and mineral composition was also analyzed and findings ascertained. Children overall evaluated sample B which was made up of wheat flour 75% & 25% carrot the highest and most preferable. Parents have a major role to play in the vegetable consumption by children. The carrot and spring onion enriched biscuits contained greater amount of protein, fibre, mineral, ash, moisture content than the control sample. The carrot and spring onion enriched biscuits contained more acceptable in terms of sensory and proximate characteristics.
Keywords
Vegetable, Carrot, Spring onion, Biscuit.
Introduction
Higher intakes of fruits and vegetables, rich in micronutrients, have been associated with better mental health, (Brookie). UNICEF’s “State of the World’s Children 2019, Food and Nutrition” reports that 44% of children worldwide are not fed any fruits or vegetables. Far too many school-age children around the world are eating too little fruits and vegetables and too many unhealthy snacks. Dietary risk factors associated with poor health in the United States are those considered to be low in fruits, whole grains, nuts and seeds and high in refined carbohydrates, added sugars, sodium and certain saturated fats.
However consumption of fruits and vegetable among Ghanaian adults is one of the lowest worldwide, and this may also pertain to children, [1]. Only 13% of children age 6-23 months in Ghana meet the minimum standards set by three core infant and young child feeding practices. Such poor diets in children are an issue of concern owing to the increasing evidence that a person’s diet has influence on their health [2].
In rural and semi-rural communities in Ghana child feeding practices indicate low dietary diversity. This in part results in childhood malnutrition and non-communicable diseases in adult life, indicating the importance of prioritizing nutrition interventions in order to address childhood malnutrition [3]. Parental reports indicate that 46% of foods disliked by children are vegetables. They recommend that with this in mind, efforts to increase vegetable consumption are needed and should be given attention by both researchers and practitioners [4]. The United Nation’s convention defines a child as every human being below the age of eighteen years [5].
The consumption of vegetables by children around the world falls below current recommendations, emphasizing the need to find strategies that can successfully enhance better acceptance of vegetables [6]. The researchers through personal observation and unofficial enquiries from parents has found that children dislike eating vegetables, which is a likely contributing factor to the low level of vegetable intake among children in Ghana. Incorporating nutrient rich and tasty vegetables like carrots into biscuits has the potential to enhance vegetable consumption among children in view of the fact that children enjoy taking biscuits. Several studies have been done using carrot p006Fwder and carrot pomace in biscuit production [7-13].
However, little has been done regarding the use of grated carrot and spring onion in biscuit preparation. The researcher therefore assessed the acceptability of biscuits incorporated with grated carrot and spring onions as a tactic to encourage vegetable consumption by children.
This study is intended to assess children’s acceptability of biscuits enriched with grated carrot and spring onions with the aim of promoting vegetable intake. The importance of this study emanates from the possibility of adding vegetables into biscuit to produce biscuits of acceptable sensory and nutritional qualities. The use of vegetables in biscuits for children can greatly enhance the nutritional value and develop children’s interest in eating vegetables.
Literature Review
The theory of planned behavior, proposed by Icek Adjen in 1985, emanated from Martin Fishbein’s theory of reasoned action (TRA) which he proposed in 1980. Both theories, viewed as deliberative processing models, infer that the attitudes of humans are formed after they have carefully weighed information available to them [14]. The theory of planned behavior states that the intention to carry out the behavior is the key driver for the behavior in question. This intention, in turn, is a function of underlying motivational variables such as attitude toward the behavior, subjective norm, and perceived behavioral control. The theory also serves as a useful framework for designing behavior change interventions, to analyze and develop the mechanisms by which interventions are expected to achieve desired results. Even though existing reviews have delivered preliminary confirmation regarding the effectiveness of TPB-based interventions, they are restricted by a focus on specific behavioral domains, chosen moderators relevant to these domains, and particular change methods [15]. The intention to patronize these biscuits will however be determined by underlying motivational variables such as attitude toward the behavior, subjective norm, and perceived behavioral control.
The Social Cognitive Theory (SCT) is a psychological perspective on human functioning that put emphasis on the critical role played by the social environment on motivation, learning, and self-regulation [16, 17]. The SCT uniquely emphasizes social influence and its emphasis on external and internal social reinforcement. SCT looks at the unique way in which a person acquires and maintains behavior, while also considering the social environment in which he or she performs the behavior. The theory takes into account a one's previous experiences, which factor into whether behavioral action will take place. These previous experiences affect reinforcements, expectations, and expectancies, all of which determine whether a person will engage in a particular behavior and the reasons why a person indulges in that behaviour [18].
In a study aimed at investigating the effective factors of healthy food behavior based on the application of cognitive social theory to 13 to 15-year-old students, Zolghadr, reports that outcome expectations, social support, and self-regulation might be effective in designing educational interventions to achieve healthy food behavior in students. Their results showed that SCT can explain about 63% of the variance of nutritional behavior in students through the studied independent variables. It appears that health education interventions based on the application of SCT can be helpful to increase healthy nutritional behavior. The results of this study identified the outcome expectations, social support, and self-regulation as the main determinant factors in nutrition education programs for students aged 13 to 15 years. The study concluded that by designing and implementing educational interventions based on these factors, it is possible to minimize the problems emanating from unhealthy nutritional behavior and improper food consumption patterns in this demographic group [19].
The implication of this social cognitive theory in this study is that the social environment at home, in the community and school will greatly influence the self-efficacy of the participants which will intern determine to a large extent children’s acceptance and consumption of biscuits incorporated with spring onions and carrot.
Conceptual Framework
Author’s construct, 2022
Figure 1 represents the author’s relevant variables for the study and maps out how they relate to each other to fulfill the research study.

Figure 1: Conceptual framework.
The diagram illustrates the factors positively or negatively linked with children's vegetable consumption which report to the following: Parental influence such as family meal’s structure, limit setting, and expectations for consumption. Parents have a great influence on the choice of food their children eat. When they tell their children the importance of eating vegetables and find ways of including it in their meals, they tend to eat it and that gives a positive effect of vegetable intake.
Environmental influence availability and accessibility and being able to make your own food choice, clearly seen during short breaks or access to unhealthy food. The environment has a positive influence on the choice of meals children have. When vegetables are readily available and presented in attractive ways children will build a positive attitude towards vegetable consumption.
Peer influences that are sharing food as a means of socializing, the symbolic value of food for image and gender identity. Based on data collected children were not greatly influenced by the choice of vegetables their friends eat but mostly influenced by their parents. They are influenced by the snacks other children take to school so means of incorporating vegetables into snack will be beneficial.
Sensory factors such as aroma, taste, texture have a unique influence of vegetable intake by children. Flavor as perceived by the nose and mouth will positively or negatively influence vegetable intake. The taste and texture also played a key role in the acceptability level of vegetable biscuit. When the taste and texture is preferable, they intern eat it. Agreeing to the findings of Povey, children aged 9-11 from an after school club at a primary school in a deprived area of England exhibited negative beliefs towards fruits and vegetables [20]. Some of the beliefs were related to taste and texture. A child, for example, described consuming mushrooms like, “eating a small furry animal,” with another suggesting that mushrooms tasted like slimy worms. To enhance children’s intake of vegetable included in the biscuit, with the framework developed environmental, peer influence, parental influence and sensory factors play key role in positively or negatively prompting intake.
UNICEF’s “State of the World’s Children 2019, Food and Nutrition” reports that 44% of children worldwide are not fed any fruits or vegetables. While the vast majority of young children consume breastmilk, they are not eating enough animal source foods, fruits, legumes or vegetables and rely too heavily on grains. Low intake of fruits and vegetables is common – a worrying phenomenon given that child who eats fruits and vegetables in childhood are more likely to continue doing so into adulthood. Though many government health departments recommend five portions of fruit and vegetables a day, it is abundantly evident that many children are not getting anywhere near these amounts (UNICEF 2019). It was found in a Brazilian study, for example, that no children aged 7–8 years met the diet quality index for vegetables. In 2017, a study of 39 schools in Mexico showed that vegetables, fruits, and plain water accounted for less than 7 per cent of the foods and drinks available in schools (UNICEF 2019). Among schoolgoing adolescents, 34 per cent consume fruit and 21 per cent vegetables less than once a day. Research from Kenya shows that people who shop in supermarkets buy fewer fresh fruits and vegetables (UNICEF 2019).
In a study in which, among other issues, outcomes in terms of food groups consumed were looked at high consumption was recorded for cereals (99.3%), oils and fats (65.5%), sweets (50.4%), meat (48.2%), vegetables (48.2%) and dairy products (43.9%). For vitamin-A-rich fruit and vegetables (3.6% and 9.4%, respectively) were recorded and for nuts and seeds (9.4%) [21].
Around 3.9 million deaths worldwide in 2017 were caused by a lack of fruit and vegetable consumption [22]. Several authors have found that growing prevalence of lifestyle diseases are as a result of inadequate fruit and vegetable intake and the increase in consumption of processed foods. The inadequate intake of fruits and vegetables is specifically associated with an increased risk of 41 non-communicable diseases [23]. The consumption of nutritious diets that contain vegetables is affected by factors such as age, gender, education, ethnicity, geographical location, region of residence and religion [24]. Low intake of vegetables during childhood has been attributed to their bitter taste [25]. Nevertheless, it is likely that early experiences with edibles, including vegetables, may induce and alter the establishment of stable food preference patterns and nutritional habits.
A study was conducted using a pretested food frequency questionnaire to collect information about all the types of food children in the Kwabre East and Tolon districts in Ghana had consumed within 7 days. Categories of the types of food included Vitamin A rich fruits and vegetables, other fruits and vegetables, dark green leafy vegetables and organ meat. The number of times they had consumed a particular food in the food group in the last seven (7) days was indicated. Food consumption from the food groups based on the 3-day repeated 24hr dietary recall showed that all the children (100%) from both regions consumed foods from the starchy food group Children from the Kwabre East district consumed more foods from meat and fish, vitamin A rich food, eggs, other fruits and vegetables and organ meat than children from the Tolon district. On the other hand, children from the Tolon district consumed more food from legumes, nuts and seeds, dark green vegetables and milk and milk products [26]. The food groups categories that were least represented and therefore the least consumed by the children involved in the study included eggs, organ meat, vitamin A rich foods and milk and milk product. Owusu, made parallel observations in a study among 182 school children (6-12 years) covered by the school feeding programme in the Greater Accra region [27]. Currently, an average Ghanaian consumes 2.3 per cent portion of vegetables daily as against the WHO requirement of four to six per cent per day. The study also revealed that the consumption of vegetables was high among men, low among women but very low among children. While men’s consumption rate hovered around 37 %, that of women was 30% and children was 10% (Daily Graphic, March 09, 2017).
Use of Vegetables in Confectionaries
There exists a need to manufacture food products that not only can function to supplement one's daily dietary needs but which children in particular would simultaneously find highly appealing because of the products confectionery-like taste and texture, including a melt-in-the mouth sensation. According to Myroshnyk, Dotsenko, Sharan, and Tsyrulnikova, nontraditional vegetable raw materials have a broad range of functional properties that influence the technological process and properties of structural components, to improve physicalchemical and organoleptic characteristics of semi-products and ready products, to improve their quality indices, food value and to correct their chemical composition. The dosage increase of vegetable powders strengthens cellulose, increases elasticity and produces better extensibility. The strengthening of structural-mechanical properties of cellulose is, most likely, conditioned by creation of complex compounds of flour proteins with carbohydrates and lipids of the introduced supplements and the effect of organic acids of the chosen powders. The use of powders of non-traditional raw materials results in increasing the food and biological value of ready confectionary products [28].
Raw carrots are used in fresh salads, cooked in a variety of vegetable dishes, and easily processed into juice drink. It can also be used in sweet dishes preparation. Carrot pomace powder is now widely used in bakery products and thus is more beneficial due to its wonderful medicinal properties. Carrot pomace can be used as valuable source of fibre for developing highly nutritious cookies. 12% replacement of wheat flour with carrot pomace powder can produce better quality cookies with acceptable physical and sensory characteristics. Rauf, Nurdiana, and Sarbini, carried out research to find out the effect of green spinach flour substitution to iron content, hardness, and acceptance of biscuits made from cassava and wheat flours composite [29]. They found out that the larger the substitution of green spinach flour, the higher the iron content of biscuits. The highest iron was obtained from biscuit substituted spinach flour 7.5%, which is 89.82 mg/kg of iron. There was no difference in the degree of hardness of biscuits substituted with green spinach flour at various levels. There is a substitution effect of green spinach flour on biscuit acceptability.
A study was conducted aimed at producing composite biscuits from wheat flour, soya bean and turmeric as a functional food. The variables looked at were wheat flour, soybean flour, and turmeric powder, with the focus by way of responses on moisture content, protein content, fat content, phenolic content, total antioxidant and reducing power. The colour and sensory characteristics were analysed and compared with those of wheat biscuit. It came out that turmeric powder had the highest positive influence on the antioxidant properties while soybean had the highest effect in improving the nutritional composition (protein,) of the biscuits. The study showed that incorporation of turmeric enhanced the nutritional quality without adversely affecting the colour and sensory characteristics [30]. It has been successfully demonstrated that dehydrated spinach powder could be safely employed as a protein, mineral and fibre source in biscuits at 5% level. Protein content up to 28.2% was achieved through the addition of 5% of dehydrated spinach. A reduction in fat content in the biscuits was highlighted with increased addition of spinach. It was concluded that the spinach incorporated biscuits can be used as an alternative source to meet the fibre requirements [31].
Factors positively linked with children's vegetable consumption report to the following: Environmental effects (availability, accessibility), norms and routines (family meals, structure, limit setting, and expectations for consumption), parental vegetable eating, food preparation and presentation (home-prepared vegetables, portion, and timing of offering in the day), and Socioeconomic factors (cost, income, and education) [32]. Children do not have quite a positive attitude towards vegetables because, unlike adults, they have not had as much time to try vegetables as many times as necessary so as to make them develop a liking for them, nor have they spent enough time observing through others really clear proof that vegetables are not harmful. Children usually associate processed foods that are high in fat and sugar (ice cream, cake, candy) with positive memories such as parties, holidays, celebrations, and rewards. On the other hand, they tend to associate vegetables with less positive memories, such as nagging parents and unpleasant meals during which they are pressured to eat green stuff. This makes children to consider junk foods as a reward, and vegetables as drudgery [33].
In a review of published literature on increasing vegetable intakes focusing on only interventions that target vegetables as a separate food group Appleton, reports among others that the bitter taste and increased need for preparation and cooking were frequently cited as inhibitions to vegetables consumption, and more so than for other foods [34]. Vegetable consumption was more often hindered by beliefs that people already ate enough vegetables, preferences for other foods, habit, cost and concerns about perishability. Taste, familiarity and hedonic factors such as preferences and likings, are major determinants of most food consumption, and both the poor taste, low liking and low familiarity with vegetables were often reported barriers to the consumption of vegetables across board. Vegetable consumption among children was found to be higher in families where vegetables are disguised or sauces are used to mask unwanted tastes, where vegetables are more often incorporated into composite foods in contrast to being consumed alone to dilute negative tastes, and where meals are cooked at home to accommodate individual preferences.
Albani, Butler, Traill, and Kennedy, Conducted a study seeking to understand fruit and vegetable consumption in children and adolescents [35]. Focus was placed on contributions of affect, self-concept and habit strength. Data was collected through face-to-face interviews with 362 children, 9-15 years old. Children were asked to report on measures of affective attitude, cognitive attitude, self-concept, social norms and facilitating factors. Three stages least squares was employed to measure the independent association of affective attitude and self-concept with intentions and of intentions and habit with intake. Self-concept played the most prominent role in explaining intentions irrespective of age for both fruit and vegetables. The importance of affective attitude varied by age and with fruit and vegetables, with greater importance for vegetables and for children aged 11-13 years. Cognitive attitude showed up to be more relevant than affective attitude for 14-15yearolds' fruit intentions. Intake was more strongly related to habit than intentions, with stronger linkages for 14- 15 year olds. According to Raggio and Gámbaro, the reasons for consumption among school-aged children depend on each type of vegetable and cannot be generalized [36]. The sensory characteristics of the vegetable (mainly colour and flavour) and the habits of consumption in the family environment play a major role in children’s acceptance or rejection of vegetables.
The main goal in developing a new food product is to make sure that it will be accepted by consumers. Food product development depends to a high extent on the consumer perception and acceptance; therefore, it is of utmost importance to include the consumer in the process of development to minimize failure probabilities. Sensorial analyses and market studies are among the tools more suitable to address this objective [37].
A consumer in buying a food product can buy nutrition, convenience, and image. Most importantly, however, consumers are buying sensory properties and sensory consistency. To this end, sensory analysis must be an integral part in defining and controlling product quality. Sensory analysis involves a set of test methods and recognized techniques for product presentation, statistical methods and strategies for getting results. Sensory analysis considers appearance, aroma, taste, flavour and texture.
Methodology
The target population is children from basic schools (one public and one private) in Cape Coast. The sample size for this study is sixty (60) respondents, thus 60 school children because they have the information needed to fulfill the research objectives. Through their daily lives, school children have access to different types of food depending on where they live and the school they attend. Not every school has a canteen; children whose schools do not have a canteen depend on street food vendors to meet their food needs during the day.
Most private school pupils are considered to be from educated and well-to-do families who are likely to be knowledgeable about benefits of vegetable consumption and can afford purchasing vegetables. On the other hand, pupils from public basic schools are largely from low income and less educated families who may either have little knowledge on the benefits of consuming vegetables or even if they have the knowledge may not be able to afford purchasing vegetables for consumption.
In neighborhoods where vegetables are readily available, there is the likelihood of it being purchased for consumption. Private school pupils are known to carry prepared food (lunch) to school which have the likelihood of containing vegetables. Public basic school pupils are known to be given money by their parents to purchase food. Most often these pupils end up buying sweets and other foods that do not have vegetables incorporated. Where parents consume vegetables there is the likelihood of them influencing their children to do same.
Both purposive and simple random sampling techniques were employed. Purposive sampling was used to select the school systems (private and public) so as to get responses from across different socio-economic backgrounds. Simple random sampling was used to select the 60 pupils from both public and private schools. However, to ensure gender balance 30 males and 30 females were randomly selected from each of the two schools to make up the 60. In purposive sampling technique the sample is formed by the discretion of the researcher purely considering the purpose of the study along with the understanding of the target audience and mostly based on research requirement [38].
Data collection procedure
The product was tasted and analyzed then the questionnaire was personally administered and collected. The school children (30 females and 30 males) from both schools were presented coded samples of the product in transparent disposable packs. The questionnaire was given to them to answer and after tasting each sample, the school children rinsed their mouth after tasting each sample and gave feedback of the sensory attributes (colour, texture, flavour, taste and overall acceptability) on a 5–point hedonic (1is dislike extremely, 2 is dislike, 3 is neither like nor dislike, 4 is like, 5 is like extremely) of products until it was completed. Due to the COVID 19, each respondent was given a package which comprised product A, B, C, D is shown in Figure 2.

Figure 2: Panel assessing the vegetable biscuit samples.
Product preparation
Drying of carrot: The carrot was prepared by washing the carrot under running water, peeled using a clean stainless vegetable peeler and washed again thoroughly with clean water, and finally grated carrot into thin pieces. The grated carrot was then soaked in syrup for 7days as a means of maintaining the colour then allowed to air dry from open space as a means of preserving the nutrients because harsh conditions could cause loss of vitamins is shown in Figure 3.

Figure 3:Flow chart for carrot preparation.
Drying of spring onion: The spring onion was prepared by removing unwanted parts, washed under running water, the bad skin taken off, thoroughly washed with brine solution to kill any bacteria present and then chopped into smaller pieces using stainless steel vegetable knife. The chopped spring onion was allowed to air dry in an open space to maintain the soluble nutrients and added to dough is shown in Figure 4.

Figure 4:Flow chart for spring onion preparation.
Process in the preparation of the vegetable biscuit
Author’s construct, 2022:
Sample preparation: The wheat flour was prepared with fortification of vegetables as described in the Figure 5.

Figure 5:Preparation of vegetable biscuit.
Ingredients and their Quantity
Flour- 2 pounds
Baking Soda- 200g
Sugar-800g
Salt-50g
Eggs-12 medium sizes
Nutmeg- 50g
Vegetable Margarine- 1 pound
Vanilla Extract- 60g
Carrot- 200g
Spring onion - 200g
Method/ Recipe
1. Assemble all ingredients
2. Cream sugar and fat until fluffy
3. Whisk in eggs and vanilla essence and fold in
4. In a separate bowl mix all dry ingredients: flour, baking soda, nutmeg, salt
5. Gradually fold in the dry ingredient into the mixture and mix to a smooth consistency
6. Collect some amount of the batter aside and add the carrot, then add spring onion to the next sample and then the last sample add both carrot and spring onion.
7. Fetch it into a piping bag and use desired nozzles to get the preferred shapes and size.
8. Pipe the biscuit onto a silicon lined baking sheet.
9. Space out 2 inches apart, placed in the oven and baked for 12 minutes at 180°C.
10. Allow it to cool for a couple of minutes before being transferring onto a wire rack to cool completely and stored in an airtight container (Figure 6).

Figure 6:Final outcome of biscuit samples.
11. Same was done for all the various samples.
Sample Formulation
Author’s construct, 2021: From Table 1, sample A had 100% of wheat and contained neither onion nor spring onion to enable the respondents to give the corresponding sensory value. Sample B had carrot but no spring onion which is to allow respondents give the corresponding sensory value, sample C had no carrot but had spring onion and sample D had both carrot and spring onion to allow respondent/researcher give the corresponding sensory value.
| Ingredients | Sample A | Sample B | Sample C | Sample D |
|---|---|---|---|---|
| Wheat flour | (100%) | (75%) | (75%) | (75%) |
| Carrot | - | (25%) | - | (12.5%) |
| Spring onion | - - | - | (25%) | (12.5%) |
| Salt | 2½ tsp | 2½ tsp | 2½ tsp | 2½ tsp |
| Baking soda | 5 tsp | 5 tsp | 5 tsp | 5 tsp |
| Egg | 70g | 70g | 70g | 70g |
| Vanilla extract | 5 tsp | 5 tsp | 5 tsp | 5 tsp |
| Nutmeg | 1¼ tsp | 1¼ tsp | 1¼ tsp | 1¼ tsp |
| Vegetable margarine | 500g | 500g | 500g | 500g |
| Ginger | 1¼ tsp | 1¼ tsp | 1¼ tsp | 11¼ tsp |
Table 1. Wheat flour -carrot/spring onion ratio formulation.
Sensory Evaluation
The resulting vegetable biscuit were subjected to sensory evaluation by a 60-member panel made up of children. The attributes of the evaluation were the taste, color, texture, aroma, moisture content and overall acceptability of the vegetable biscuit. Samples were coded and presented to the panelists on clear disposable plates. The panelists were provided with water to rinse their mouth after tasting each sample. A 5-point Likert scale was used for the test. That is because, the research is about children and they were used for data collection making it easier to answer. Where: 1=dislike extremely, 2=dislike 3=neither like nor dislike, 4=like, 5=like extremely.
Preparation of sample for proximate and nutritional analysis
Drying and grinding: The biscuit samples were sliced into pieces and dried in an oven at 60°C . The dried biscuit samples were then homogenized into powdery form ready for the analysis.
Moisture determination: Porclain crucibles were washed dried and weighed. About 10-12g of the fresh samples of biscuit were put into clean oven-dried crucibles and weighed. The crucibles containing the sample were spread over the base of the oven to ensure equal distribution of heat. They were then kept in a thermostatically controlled oven at 105°C for 48 hours. At the end of the period the vegetable biscuit and control samples were removed, cooled in a desiccator and weighed. Each sample was done thrice. The moisture content was then calculated as the percentage water loss by the sample.
Ash determination: The dried vegetable biscuit and control samples were then heated gently in oven at 105°C for about an hour and then transferred to furnace at a temperature of 550°C overnight, the heating continued until all the carbon particles are burnt away. The ash in the dish was removed from the furnace cooled in a desiccator and weighed. The ash content was then calculated as a percentage of the original sample.
Oil/ fat determination: About 10-12g of the milled vegetable biscuit and control samples were weighed into a 50×10mm soxhlet extraction thimble. This was transferred to a 50mL capacity soxhlet extractor. A clean dry 250mL round bottom flask was weighed. About 150mL Petroleum spirit was added and connected to the soxhlet extractor and extraction was done for 6 hours using a heating mantle as a source of heating.
After the 6 hours the flask was removed and placed in an oven at 60°C for 2 hours. The round bottom flask was removed, cooled in a desiccator and weighed. The percentage fat/oil was calculated as followed.
Calculation
Crude Fat (%)=
Where W is weight of oil
Carbohydrate determination
Reagent: Glucose solution
Stock solution: (1mL is equivalent to 0.25mg glucose), 0.250g D-glucose (dried in a vacuum oven at 70°C oven P2O5) was dissolved in water and diluted to 1liter.working standards: A range from 0 – 20mL stock solution was pipette into 50mL flasks such that 2mL of each standard gives a range from 0- 0.20mg glucose and diluted to volume.
Procedure extraction: Fifty milligrams (50mg) of the milled biscuit sample was weighed into a 50mL conical flask, 30mL of distilled water was added and a glass bubble placed in neck to simmer gently on a hot plate for 2 hours. It was topped up to 30mL periodically and allowed to cool slightly, then filtered through a No.44 Whatman paper into a 50mL volumetric flask and dilute to volume when cool. The extract was prepared shortly before color development. A blank was prepared by taking it through same procedure.
Colour development: Two milliliters (2mL) of each standard were pipette into a set of boiling tubes and 2mL of the extract and water blank was also pipetted into a boiling tube. Standards and samples were treated the same way. 10mL of anthrone solution was added rapidly to mix and the tubes immersed in running tap water or ice bath. The tubes were placed in a beaker of boiling water in a dark fume cupboard and boil for 10minutes. The tubes were then placed in cold water and allowed to cool, preferably in the dark. The optical density was measured at 625nm or with a red filter using water as a reference. A calibration graph was prepared from the standards and used to obtain mg glucose in the sample aliquot. The blank determination was treated same way and subtraction done where necessary.
Soluble carbohydrates (%)= 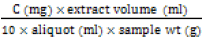
Where C=carbohydrate concentration from the calibration graph
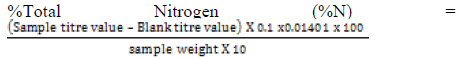
Protein determination: Protein present in food is calculated from nitrogen concentration of the food. The kjeldahl was used in the determination of protein. The method can be divided into three steps: digestion, neutralization or distillation and titration.
Distillation: A steam distillation apparatus was set up. The distillation apparatus was flushed with distilled water for about twenty (20) minutes. After flushing out the apparatus, five (5) millilitres of boric acid indicator solution was poured into a 100 mL conical flask was placed under the condenser of the distillation apparatus with the tip of the condenser completely immersed in the boric acid solution. An aliquot of the sample digest was transferred to the reaction chamber through the trap funnel. 10mL of alkali mixture was added to commence distillation immediately and about 50mL of the distillate was collected.
Titration: The distillate was titrated with 0.1N HCl solution until the solution changed from green to the initial colour of the indicator (wine red). Digestion blanks were treated the same way and subtracted from the sample titre value. The titre values obtained were used to calculate the nitrogen and hence the protein content. The conversion factor used was 6.25.
Crude fibre determination
Reagents: Sodium hydroxide, 1.25%
1.25%. Dissolve 12.5g NaoH in 700mL distilled water in a 1000mL volumetric flask and dilute to volume.
3Sulphuric Acid, 1.25%
Add 12.5g conc. Sulphuric acid to a volumetric flask containing 400mL distilled water and dilute to volume.
Procedure: About 1g of the sample was weighed and placed in a boiling flask, 100mL of the 1.25% sulphuric acid solution was added and boiled for 30mins. After the boiling, filtration was done in a numbered sintered glass crucible. The residue was transferred back into the boiling flask and 100mL of the 1.25% NaoH solution was added and boiled for 30mins. Filtration continued after the boiling and the residue washed with boiling water and methanol. The crucible was dried in an oven at 105 degrees overnight and weighed. The crucible was placed in a furnace at 500 degrees for about 4 hours. The crucible was slowly cooled to room temp in a desiccator and weighed.
Calculation

AOAC (2008)
Preparation of sample solution for the determination of major minerals
The preparation of sample solutions suitable for elemental analysis involves an oxidation process which is necessary for the destruction of the organic matter, through acid oxidation before a complete elemental analysis can be carried out.
Sulphuric acid-hydrogen peroxide digestion: The digestion mixture comprises 350mL of hydrogen peroxide, 0.42g of selenium powder, 14g Lithium Sulphate and 420mL sulphuric acid. The oven-dried ground sample was weighed into a 100mL Kjeldahl flask and 4.4mL of the mixed digestion reagent was added and the samples digested at 360°C for two hours.
Blank digestions (digestion of the digestion mixture without sample) were carried out in the same way. After the digestion, the digests were transferred quantitatively into 100mL volumetric flasks and made up to volume.
Determination of calcium and magnesium by EDTA titration: The method involves chelation of the cations with ethylene diaminetetra-acetic acid (EDTA). The procedure involved the determination of calcium and magnesium together and the determination calcium alone and agnesium found by difference. Calcium and magnesium together were determined by placing an aliquot of 10mL of the sample solution in a 250mL conical flask and the solution was diluted to 150mL with distilled water 15mL of buffer solution and 1mL each of potassium cynacide, hydroxylamine hydrochloride, potassium ferro-cyanide and triethanolamine (TEA). Five drops of erichrom Black T (EBT) were added and the solution was titrated against 0.005M EDTA. Calcium was determined by pipetting 10mL of the sample solution into 250conical flask and diluted to 150mL with distilled water. 1mL each of potassium cyanide, hydroxyl-amine-hydrocloride potassium ferrocyanide and TEA five drops of calcon indicator were added and the solution was titrated with 0.005M EDTA.
Calculations:
% Ca = 0.005 x 40.08 x T
Sample wt
% Mg = 0.005 x24.3 x T
Sample wt
Where T = titre value
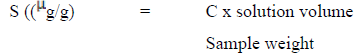
Determination of sulphur
The determination of sulphur is carried out in a di-acid digestion using nitric acid and perchloric acid (2:1). An amount of the sample (0.5g) was weighed into a digestion flask and 10mL of the di-acid mixture was added and the contents mixed by swirling. The flasks were placed in a digestor in a fumehood and heated, starting at 90°C and then the temperature raised to 200°C. Heating was continued until the production of red NO2 fumes ceased. The contents were further heated till they became colourless. After cooling the digest was diluted 100mL with distilled water. Sulphur in the digest is determined by turbidi-metric method.
A 10mL aliquot of the digest was pipette into a 25mL volumetric flask and 10mL of distilled water was added. 1mL of gelatin-BaCl2 reagent was added and mix thoroughly and allowed to stand for 30minutes. Standard sulphur solutions of 0, 1, 2, 3, 4 and 5 gs/mL were prepared to which were added 1mL gelatin-BaCl2 reagent and 10mL of blank digest and made up to volume with distilled water.
The absorbance of the standard and sample solutions were determined on a spectrophotometer at a wavelength of 420nm. A standard graph was plotted from which the concentrations, C, of the sample solutions were extrapolated.
Calculation
Results and Discussions
This deals with the analysis and discussions of the results of the data collected for the research work. It begins with the demographic analysis of the respondents followed by the analysis of the vegetable biscuit and then the analysis of the factors influencing the vegetable intake of children and ends with the analysis of sensory and proximate composition of the vegetable biscuit.
Demographic information
This bar chart represents the percentages of gender of pupils (male & female) in the primary school used for the data collection.
Figure 7 shows the percentages of the gender of the respondents. From the figure, 50% of the respondents are males whiles 50% are females. This shows that of the 60 pupils, 30 of them are males and 30 are females. This was done to have a fair judgment of the respondents.

Figure 7:Gender of students.
Table 2 is a cross tabulation between the ages of the respondents and the class of the students. This shows that most children start primary school at the age of 6 years. Primary school starting age (years) in Ghana was reported at 6 years in 2019, according to the World Bank collection of development indicators, compiled from officially recognized sources. Ghana - Primary school starting age (years) - actual values, historical data, forecasts and projections were sourced from the World Bank on September of 2020. A cross tabulation of Table 2 showing the responses of primary school pupils in both public and private schools concerning the inclusion of biscuit to food sent to school.
| Age of Respondents (Years) |
Class of Student | Total | |||
|---|---|---|---|---|---|
| Class Three | Class Four | Class Five | Class Six |
||
| 8 | 7 | 2 | 1 | 0 | 10 |
| 9 | 3 | 4 | 4 | 2 | 13 |
| 10 | 0 | 4 | 11 | 4 | 19 |
| 11 | 0 | 1 | 3 | 14 | 18 |
| Total | 10 | 10 | 16 | 20 | 60 |
Table 2.Ages and class levels
Table 3 is a crosstab between the school type and the rate at which school children include biscuit in their food which they take to school. The crosstab indicates that, among those who always include biscuit in their food, 2 (22%) go to public schools whiles 7(77.80%) attend private school. Furthermore, among those who sometimes go to school with biscuit, 24(53.33%) attend public schools whiles 21(46.67%) attend private schools. Also, with those who never go to school with biscuit, 4(66.67%) attend public schools whiles 2(33.33%) are from private schools. It implies that, majority (about 77%) of those who go to school with biscuit are from the private schools. Thus, the parents whose children attend private schools always give biscuit to their children more than their counterpart whose children attend public schools. Through their daily lives school children, have access to different types of food depending on where they live and the school they attend. In line with the findings, not every school has a canteen as children in public schools do not have a canteen but depend on street food vendors to meet their food needs during the day [39]. As a general assumption, public school children are average homes and could be a contributing factor for not going to school with biscuit.
| School Type | Do you include Biscuit in your food to School | Total | ||
|---|---|---|---|---|
| Always | Sometimes | Not at all | ||
| Public | 2 | 24 | 4 | 30 |
| Private | 7 | 21 | 2 | 30 |
| Total | 9 | 45 | 6 | 60 |
Table 3. Inclusion of biscuit to school.
Product information
A pie chart of Figure 8 representing the levels at which pupils in the private and public schools include biscuit to the food sent to school.

Figure 8:Inclusion of biscuit to school.
Figure 8 shows pupils who have biscuit included in the food they take to school. 15% represents pupil who take biscuit to school sometimes, 10% is not at all and 75% representing those who take biscuit to school always. Majority of primary school pupils go to school with biscuits. To Rai, Shukla, Kishor, Singh, and Dey, it will be a good initiative to incorporate vegetables in biscuit as school children often eat biscuits as snack [40]. Children usually associate processed foods that are high in fat and sugar (ice cream, cake, candy) with positive memories such as parties, holidays, celebrations, and rewards. This makes children to consider junk foods as a reward so have great choice in snacks such as cookies. It will therefore be a good initiative to incorporate vegetables in biscuit because such snacks are sent to school in contrary to stated studies.
The cross tabulation illustrates percentage levels of biscuit included in the food sent to school by both public and private schools.
Figure 9 of the pie chart shows the percentages of pupils in both private and public schools if they have consumed cream crackers before. It was done to find out if they had knowledge of vegetables included in biscuits such as cream crackers.

Figure 9:Response to consumption of cream crackers.
Figure 9 is the response given when the pupils were asked if they have eaten cream crackers biscuit before. 95% of them were affirmative whiles only 5% of them said they have not eaten Cream Crackers biscuit before. Majority of primary students eat Cream Crackers which a vegetable biscuit. Majority of primary students eat cream crackers that include vegetables. This is in line with Serivastava, on consumption of crackers by children in some fast-growing economies of the world. Serivastava, further stated crackers (biscuit) consumption per capita in India was 2.1 kg, compared to more than 10 kg in the USA, UK and West European countries and above 4.25 kg in South-east Asian countries, e.g., Singapore, Hong Kong, Thailand, Indonesia, etc. China has per capita consumption of 1.90kg, while in the case of Japan it is estimated at 7.5kg. Thus, he links the reasons for the consumption by many that, biscuit is an important source of high molecular carbohydrates, vegetable proteins and some vitamins and minerals. This means that, if the vegetables which are liked by most primary students are incorporated in cream crackers, such vegetables will be consumed by the children and help in the improvement of children’s intake of vegetables.
Table 4 is the cross tabulation that depicts the number of pupils who like the types of biscuits (soft and hard biscuit).
| Do you like biscuit | Category of biscuits you like | Total | |
|---|---|---|---|
| Soft Biscuits | Hard Biscuits | ||
| Yes | 29 | 18 | 47 |
| No | 5 | 8 | 13 |
| Total | 34 | 26 | 60 |
Table 4. Preference of the types of biscuit
Table 4 is a crosstab between those who like biscuit and the category of biscuit. Majority (34) of the respondents like soft biscuits whiles 26 like hard biscuits. 47 of them like biscuit and 13 do not have interest in biscuit. However, those who said don’t like biscuit do sometimes eat biscuit but they aren’t much interested in eating it. Among those who don’t like biscuit, 8 of them will choose hard biscuit whiles 5 of them will opt for soft biscuit. This is in contrast with those who really like biscuit. With those who enjoy eating biscuit, majority (29) of them like soft biscuit whiles the minority (18) like hard biscuit. Thus, most primary school children who enjoy eating biscuit prefer biscuit that are soft to hard biscuit. However, most of those who are not fans of biscuit prefer hard biscuit to soft biscuit when they do eat.
Figure 10 is a bar chart showing the preference of the types of biscuit by the respondents. The blue bar in the figure represents sweet biscuits. 36.33% of the pupils like sweet biscuits than semi-sweet and salted biscuits. Also, the red bar represents semi-sweet biscuit, and 45% of primary school prefer semi-sweet biscuit. The green represents salted biscuits. Only 16.67% of the children prefer Salted biscuit. Conferring to the findings of Rai, children usually associate processed foods that are high in fat and sugar (ice cream, cake, candy) with positive memories such as parties, holidays, celebrations, and rewards. In comparison to current study, children love to have semi-sweet biscuit and sweet biscuit as against the salted biscuit. This in agreement with mentioned study proves that children have a high taste for sweets.

Figure 10:Preference for the types of biscuit.
Figure 11 displays listed vegetables and the extent to which the respondents like them. It can be inferred from the table that most school children like carrot and spring onion a lot, therefore incorporating grated carrot and spring onions in biscuit will be a good idea. According to Raggio and Gámbaro, the reasons for consumption among school-aged children depend on each type of vegetable and cannot be generalized. The sensory characteristics of the vegetable (mainly colour and flavour) and the habits of consumption in the family environment play a major role in children’s acceptance or rejection of vegetables. It can be seen that each child may have their own reasons for the choice of a particular vegetable. But early and repeated exposure to vegetables can develop the liking for the sweet or bitter taste and choice of intake as observed by the study findings.

Figure 11:Children’s vegetable preference.
In line with findings of Zeinstra, Koelen, Kok, van der Laan, and de Graaf, providing the child with choice has a much greater potential to stimulate vegetable intake and deserves more attention [41]. To encourage children’s vegetable intake in the long term, a positive eating atmosphere where children have some autonomy over their vegetable choices will be most advantageous.
Table 5 is a cross tab.1.4 showing the relationship between the ages of the respondents and the type of biscuit preferred by the respondents. It can be seen that those who are 10 years like sweet biscuit the most whiles those who are 9 years are the least to like sweet biscuit. Children who are 11 years old turn to like semi-sweet biscuit the most but who are 10 and 8 years are the least to like Semi-Sweet biscuit. It can also be deduced from the table that children who are 10 years mostly like salted biscuit among those who like the salted biscuit whiles those who are 8 years have low likeness for salted biscuit. It turns out from the results children who are 10 years dominated in those who liked sweet biscuits as well as salted biscuit because, those who are 10 years are more than those in the other listed age category. However, it can be seen that majority of the 10 years’ children prefer sweet biscuit more than they liking salted biscuit.