Research Article - Journal of Food Science and Nutrition (2018) Volume 1, Issue 1
Children's nutritional status and its determinants in small towns, Sebeta Hawas district, Oromia, Ethiopia.
Abebe Haile*, Tigist Abera AmbomaCollege Development Studies, Centre for Food Security Studies, Addis Ababa University, Addis Ababa, Ethiopia
- *Corresponding Author:
- Abebe Haile
College Development Studies
Centre for Food Security Studies
Addis Ababa University
Addis Ababa
Ethiopia
Tel: + 251- 916-823834
E-mail: abebe.haile@gmail.com
Accepted date: February 10, 2018
Citation: Haile A, Amboma TA. Children’s nutritional status and its determinants in small towns, Sebeta Hawas district, Oromia, Ethiopia. J Food Sci Nutr. 2018;1(1):33-47.
DOI: 10.35841/food-science.1.1.33-47
Visit for more related articles at Journal of Food Science and NutritionAbstract
The study was aimed to assess the prevalence and examine determinant factors of children’s nutritional status in non-administrative two small towns (Awash Bello and Boneya) located Sebeta Hawas district, Oromia region. Cross-sectional design was employed in the existing two small towns selected randomly. The sample size was determined by using single population proportion formula then adjusted by finite population correction factor to draw the final 230 sample children and then allocated proportionally to each small town. Then the households were selected using systematic random sampling. If there is more than one child in the selected household only one child was considered randomly. Structured questionnaire was used to gather information on the demographic, socio-economic, and maternal and child caring practice, as well as environmental factors. While anthropometric measurement was used to collect height, weight and MUAC following the standard measurement tools and procedures. Information was entered into Epi-Data version 3.1 and anthropometric measurements were converted into Z-scores by WHO Anthro version 3.2.2., 2011 software. Then exported to STATA 13 and analyzed using descriptive statistics and inferential statistics. The result revealed that the prevalence of overall malnutrition was 46%. Specifically, stunting was (22.6%), underweight (16.1%) and wasting (7.4%), respectively. Bivariate and multivariate logistic regression model was employed to analyze determinants child malnutrition. Multivariate model revealed that age of child, number of under-five children in the household, no formal fathers and no formal maternal education, less than1500ETB monthly income, Antenatal care visit less than four times during pregnancy, not exclusive breast feeding and no fully vaccination were found positive and significant determinants for child malnutrition. And, child birth order was negative and significant determinant for child malnutrition. Thus, need continues training, awareness creation activities, special attention for child and maternal healthcare services by Sebeta Hawas district Health Office and other practitioners.
Keywords
Malnutrition, Boneya, Determinant, Nutritional status
Introduction
The concept of determinants origins in the original approach for the causes of child malnutrition lays out the hierarchical relationship between the immediate, underlying, and basic determinants of child nutritional status. The immediate determinants, which manifest themselves at the level of the individual child, are dietary intake (energy, protein, fat, and micronutrients) and health status. These factors themselves are interdependent. A child with inadequate dietary intake is more susceptible to disease; disease in turn depresses appetite, inhibits the absorption of nutrients in food, and competes for a child’s energy. The underlying determinants, which impact child nutritional status through the immediate determinants, manifest themselves at the household level. The first, household food security is assured access to enough food of adequate quality for living an active healthy life. The second is the quality of caring practices for children and women. Examples of caring practices for children are child feeding, health-seeking behaviors, and cognitive stimulation. The most obvious aspect of care for women that affects children’s nutritional wellbeing is care and support during pregnancy and lactation. Women are typically the main caretakers of children after birth, and in order to provide quality care they need continued adequate food consumption and health care, rest, and measures to protect their mental health, such as protection from abuse. The third underlying determinant, health environment and services, conditions children’s exposure to pathogens and the use of preventative and curative health care. Elements of a health environment include access to safe water, to sanitary facilities for disposing of human waste, to health services, and to shelter [1].
Information from the 2016 EDHS results revealed that in Ethiopia there was a very high prevalence of chronic child malnutrition in that more than one out of two under-five children (or 38 percent) was stunted. These figures are very high even compared to the developing countries which are severely affected by the problem of child stunting. Regional difference are prominent in Ethiopia, more than two in five children are stunted [with Amhara region (46.3%) leading to Benishangul (42.7%) and Afar regions (41.1%)]. EDHS conducted from 2000 to 2016 (for children under-five years of age), the prevalence of stunting has decreased from 66.6 percent in 2000 to 38 percent in 2016. But this figure is still the highest prevalence rate among the sub-Saharan African countries. Although there is a substantial decline in the aggregate prevalence rate of stunting in the underfive children of age, there are great differentials in child stunting rates between the regions within the country, with Oromia region took the prevalence rate (i.e., 36.5 percent of prevalence for stunting [2-4]. Furthermore, the framework also conceptualize caring practice behavior include maternal and child caring practices such as antenatal care visit during pregnancy, depletion of colostrums, exclusive breastfeeding, duration of breastfeeding, vaccination and age at start of complementary feeding, as well as child health conditions during the last weeks before the data collection period which has associated with child malnutrition. Environmental factors deals with sanitation and hygiene practice of the household like use of toilet facility, waste disposal practice and source of drinking water. The single arrow shows how those associated factors directly affect the child malnutrition and there is no backward association between determining factors as well as child malnutrition. The nutritional status of children is important as it determines their health, physical growth and development, academic performance and progress in life. Today, it is a formidable challenge. In globe every country is facing a serious public health challenge from malnutrition and almost one in three people on the planet is malnourished [5,6]. Nearly half of all countries are dealing with more than one type of malnutrition at the same time [7]. Children are more pretentious than adults, though the estimates indicate that 156 million children under-five age around the world were affected by stunting and 50 million children were wasted. Africa and Asia bear the greatest share of all forms of malnutrition. Which presented as 56 percent of all stunted children and 68 percent of all wasted children under-five age lived in Asia; Africa takes the share of 37 percent stunted and 28 percent wasted under-five children [8].
The consequences of malnutrition are factually devastating. An estimated 45 percent of deaths of children under age 5 are linked to malnutrition [9]. The Malnutrition and diet are now the largest risk factors responsible for the global burden of diseases [10]. The problem of malnutrition is serious and worldwide; developing countries are highly vulnerable. For instance in Africa the number of stunted children is rising by 16 percent from year a 2000 and 2015 and the half of the increment was by western Africa. Nevertheless prevalence of stunting and wasting under-five children also high in Eastern Africa 37.5 percent and 6.6 percent estimated respectively [8]. While in Ethiopia 38 percent of children under age five are stunted, while 10 percent of children are wasted, and 24 percent of children under age five are underweight [4] which is high compared to WHO reference point. Economic growth and human development require wellnourished populations who can learn new skills, think critically and contribute to their communities. Early life under nutrition is an underlying cause associated with about a third of young child deaths. Among the survivors that become stunted in the first two years of life, their capacity to resist disease, to carry out physical work, to study and progress in school, are all impaired across the life course [11].
Ethiopia is among the highest level malnutrition in children aged six to fifty-nine months in the world and it has long in history; most pressing health problems as well as 57 percent of child deaths are associated with malnutrition in Ethiopia [12]. The Ethiopian Demographic and Health Survey (EDHS) measure based on comparisons between Ethiopian children aged under five years with the latest WHO multi-country growth references show that 38 percent of children under age five are stunted, and 18 percent of children are severely stunted while 10 percent of children are wasted, and 3 percent are severely wasted and 24 percent of children under age five are underweight, and 7 percent are severely underweight. While in Oromia region the prevalence of child malnutrition indicated that 36.5 percent of the children are stunted with 17.1 percent severely stunted; 10.6 percent of the children are wasted with 3.5 percent severely wasted and 22.5 percent are underweight with 6.6 percent severely underweight which placed in the seventh level among the regions [4].
On the other hand many empirical studies have been conducted on the prevalence and determining factors of malnutrition. For instance, a cross sectional study by [13] identified that the determinants of malnutrition in drought prone rural area. Similarly [14] studied that the food insecurity and its association with children’s nutritional status and find out other associated factors in rural area. Moreover, [15] carried out a cross-sectional study and identified that the magnitude and the determinants of malnutrition in food surplus rural area [16] showed that the main determining factor of children under nutrition through community based cross-sectional study in urban setting. Similarly [17] identified the chronic malnutrition prevalence and associated factors on children aged 6-59 months in town. And also [18] indicated that the associated factors of malnutrition on facility based cross-sectional study within urban area. But most of them gave due attention for rural areas and few of them looked urban areas. Particularly, the knowledge of the relative giving of the major risk factors associated with malnutrition in non-administrative small towns was scarce. Thus the aim of this study is, therefore, to estimate the prevalence of malnutrition and identify its determinants among children age 6-59 months in non-administrative small towns of Sebeta Hawas district, Oromia Region.
Materials and Methods
Description of the study area
Sebeta Hawas District is found in Oromiya Special Zone around finfine, Oromia Region which is located between 8° 44' 59.99" N latitude and 38° 39' 59.99" E longitude with a total surface area of 867.92 km2. The district has 36 rural and 4 town kebeles; the total number of population accounts 162,852 out of this 83,528 male and 79,324 female [4]. According to the information obtained from Sebeta Hawas district Administration Office, the total population of the small towns Boneya and Awash Bello were having estimated population of 2,365 and 1,932 respectively. The two small towns were characterized by high production of cereals and legumes while majority of females were engaged in pity trade to diversify means of livelihood (Figure 1).

Figure 1: Study area map (Source: CSA, 2007; ERA and MoWI, 2010).
Study design
Cross-sectional design was employed to collect relevant and sufficient information within short period of time. The study design was used quantitative and qualitative research approach to assess the complex variables of child malnutrition in the small towns of Sebeta Hawas district; from February 21 to March 21, 2017.
Study population
The study population was children age 6-59 months pair with their mothers or caregivers lived in Awash Bello and Boneya towns of Sebeta Hawas District
Inclusion and exclusion criteria
Mothers or caregivers who have children age 6-59 months lived in the study area at least for six months prior to data collection were incorporated under this study. In the same manner visitors of the selected household during the data collection who have a child age 6-59 months were not included under study.
Data sources
Both primary and secondary sources of data were used to gather the information required for the study. The primary data was collected from eligible respondents (mother or caregiver of index child) and anthropometric measurement. Whereas, secondary data were collected from available document at Sebeta Hawas Health Office, catchment Health Center and Health post.
Sample size determination
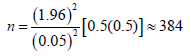
To determine the children to be included in the study different methods were employed in order to get representative sample size. Therefore Cochran (1963:75) formula to yield the required sample for proportions was used as Cited by [19].

Where:
n= Sample size required
p=The estimated proportion of an attribute that is present in the population, (expected prevalence).
q=1-p
z= Z- Score associated with appropriately chosen level of confidence (95%) with the table value of 1.96.
e= The desired level of precision
To estimate the sample size, assume p=0.50 maximum expected prevalence of malnutrition for the study area was not known. Accordingly, the desired level of precision 5% with 95% level of confidence the Z value equals 1.96. The estimated sample size to be:
The total population (total children age 6-59 months) of the small towns are 570; need to adjust using finite population correlation factors. Because, it is advisable to adjust the sample size. Finite population correction factor applied when the sample represents a significant (e.g. over 5%) proportion of the population as cited by [20]. The formula should be:
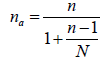
Where: a n = The required sample size, N = The total population of the children age 6-59 months in the study area, n = The sample size estimated based on the assumption of p = 0.50.
Thus, the final sample size:
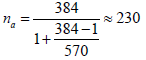
Adding 10% contingency for non-response, the final sample size of 6-59 months child-mothers/caregivers pair participate in the study was:

Sampling techniques and procedures
The study employed mix of sampling techniques; the sampling of
the Sebeta Hawas district was purposive, the major reason being
the geographical proximity of the area. On the other hand, simple
random sampling technique was used to identify the sample
household with eligible children. According to information
obtained from Sebeta Hawas district administration office,
the district has 36 rural kebeles; 4 town kebeles and four nonadministrative
small towns. Thus, the two non-administrative
Awash Bello and Boneya small towns were selected randomly.
Then to generate a sampling frame for each small town, the
calculated 253 sample were allocated based on probability
proportional to size. Finally, the eligible households with children
age 6-59 months were identified for each small town from Health
Post family folder and selected using simple random sampling
technique. The first eligible household was selected using
systematic random sampling then proceed by adding  up to
the required sample size were obtained. When there was more
than one child age 6-59 months present in the selected household
only one child was chosen randomly (Table 1).
up to
the required sample size were obtained. When there was more
than one child age 6-59 months present in the selected household
only one child was chosen randomly (Table 1).
Table 1. Probability proportional to sample size determination and the final sample for each small towns (Awash Bello and Boneya) of Sebeta Hawas District, 2017.
| Purposively selected small towns | Number of households with child 6-59 months | How to Compute Sample in each small town | Sample size | Not at home/refusal at three visit |
|---|---|---|---|---|
| Awash Bello | 192 | 192*253/570 | 85 | 8 |
| Boneya | 378 | 378*253/570 | 168 | 15 |
| Total | 570 | 253 | 23 | |
| Final sample | 253-23=230 |
Data Collection Instrument and Procedure
Qualitative and quantitative research method was used to collect the information on the determinants of child malnutrition. The structured questionnaire was administered to eligible respondents (mothers or caregivers of eligible child) to collect quantitative data. The information was collected by 4 enumerators who have one diploma and other have 3 BSc degree as well as fluent in local/Afan Oromo language with similar experience in field surveys were recruited and trained on the administration of the questionnaire and anthropometric measurement. Qualitative information of the study was obtained through focus group discussions (FGD). A close supervision of enumerator during the field work and administration of focus group discussions (FGD) was done.
In addition, to investigate the nutritional status of the children anthropometric measurement on height, weight, and MUAC was taken from each eligible child. Height of the child was measured using measuring board and their weight was measured using UNICEF electronic scale. While MUAC was measured using a new WHO standard MUAC tape (S0145620 MUAC, Child 11.5 Red/PAC-50). The height of infant age 6-23 months (less than 85cm) measured in recumbent position while for children age 24-59 months was measured in stand up position. Accordingly Weight of the lightly closed infants and measured to the nearest 10 g by UNICEF electronic scale for a child who stand alone and as well for not stand alone. For a child not stand alone the mother was weighted together with a child and then without the child. The difference between the two measurements was taken as the child’s weight.
On the other hand, Individual Dietary Diversity Score (IDDS) was collected using standard questionnaire for both breastfeeding and not breastfeeding children. IDDS among children 6-23 months of age was an indicator of minimum dietary diversity that has been defined as the proportion of children who received food from at least 4 food groups in the previous day (24 hour recall) using a standard list of 7 food groups. This standard list of 7 food groups used to calculate the indicator are Grains, Roots and tubers (staples foods), Legumes and nuts, Diary product (milk, yogurt, cheese), Fleshed foods (meat, fish, poultry and liver/organ meats), Eggs, Vitamin-A rich fruits and vegetables and Other fruits and vegetables. Every respondent was asked about food taken by the child during 24 hours (day and night) before the survey day inside home as well as outside the home. From the 7 food group the consumption of 4 food group was calculated by adding at least one animal source food (diary and meat) and at least one fruit or vegetable in addition to stable food [21].
Data Quality Assurance
To ensure the data quality the questionnaire was developed in English language and translated to local language (Afan Oromo) and to minimize language bias the data collectors’ were fluent speakers of local/Afan Oromo language. The questionnaire was adapted from EDHS instrument as well as from other similar studies. A one day intensive training was given to the data collectors on study objectives, overall survey instruments, how to administer structured questionnaires and how to take anthropometric measurements. Measurements was taken using UNICEF’s standard instruments of weighting scale and height board and routinely checked and adjusted to maintain its accuracy, precision and validity. For instance every day similar weight was taken before starting weighting of child and zero reading was checked following weighing child.
Ethical Consideration
The ethical considerations were taken the relevant institution of Addis Ababa University. On the ground, the Sebeta Hawas Administration and Health office was informed about the purpose of the research and permission granted. The respondents were requested to participate only on voluntary basis and informed that they should feel free not to answer any question that they were not comfortable with, however, the importance of answering all the questions were emphasized. Oral consent was obtained from research participants after explaining all the necessary information for them. In the presentation of result, the researcher has not used name in order to ensure confidentiality and anonymity of the respondents.
Data Processing and Analysis
The quantitative data collected through structured questionnaire was entered into Epi-Data version 3.1 and exported to STATA 13 for analysis. To convert the anthropometric data into Z-scores of the indices WHO Anthro version 3.2.2, 2011 software was used for stunting HAZ (Height for Age Z-score), underweight WAZ (Weight for Age Z-score) and wasting WHZ (Weight for Height Z-score) and exported STATA 13 for further analysis. Descriptive statistics such as frequency, percentage, mean and standard deviation was used to organize distribution of child demographic, household’s demographic and socioeconomic, maternal and caring behavior and environmental characteristics. Bivariate and multivariate regression model were used first to identify the association between independent determinants and outcome variables. As well as used to estimate the imperative determinants that influence on nutritional status of children [22].
Statistical Model Specification
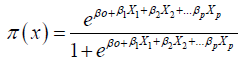
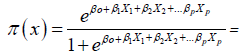
Univariate (bivariate) logistic regression and multivariate logistic regression, are approaches to develop a probability model for binary response variable having correlation. The rationale behind bivariate and multivariate logistic regression was the correlated outcome variables with their perspective independent variables were estimate in the model at one time. For instance the indicator of malnutrition such as stunting, wasting and underweight had a binary response 0 or 1 estimated within each covariate. From logistic distribution equation, π (x) is the probability of malnourished (stunted, underweight and wasted) that depend on p covariates or independent variables. Then using logit for modelling the probability;
 (1)
(1)
To obtain the corresponding logit function from this, we calculate (letting X represent the whole set of covariates X1, X2,…, Xp):
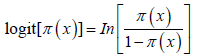 (2)
(2)
 (3)
(3)
 (4)
(4)
 (5)
(5)
= β0+β1X1+β2X2+...βpXp (6)
So, the logit of the probability of malnourished given X covariates is a simple linear function.
Finally, the basic equation of multivariate logistic regression is:
 (7)
(7)
This is the probability of malnourished children given the covariate values such as demographic, socioeconomic, environmental characteristics, child caring practice and child health. With the assumption that the mean probabilities of each data point error term has zero and it follows binomial distribution mean π (x) and variance π (x)[1−π(x)].
Diagnostic Tests
Before the start of any model analysis it is essential to attend to the problem of multicollinearity and contingency coefficients among the selected explanatory variable [22]. The correlation of above 0.80 and below - 0.80 are used and as a critical point to indicate serious multicollinearity problem [23,24]. The coefficients of all variables in this study were found to be below 0.6220 and above -0.1302. Therefore, there was no severe multicollinearity problem among independent variables.
Hypothesis and Definition of Variables
Outcome variable
The nutritional status of children indicated by stunting (height for age), underweight (weight for age) and wasting (weight for height) was used as outcome variable.
Predictor variables
Based on available literature the following selected predictor variables influence nutritional status of children was explained and hypothesized as follows (Table 2).
Table 2. Explanatory variables, type and expected sign, of Sebeta Hawas District, 2017.
| Explanatory Variable | Type | Expected Sign |
|---|---|---|
| Age of child (in months) | Continuous | + |
| Gender of the child (being male) | Dummy | -/+ |
| Household size | Continuous | + |
| Number of children under-five | Continuous | + |
| No formal maternal education | Categorical | + |
| No formal parental education | Categorical | + |
| Less than1500ETB monthly income | Dummy | + |
| Maternal employment status | Categorical | + |
| Not fully vaccinated | Dummy | + |
| Diseases during last two weeks (diarrhea, fever, cough) | Dummy | + |
| Less than 4 times antenatal care visit of the mother during pregnancy | Dummy | + |
| Not depleting colostrums | Dummy | + |
| Not exclusive breast feeding | Dummy | + |
| Duration of breast feeding | Continuous | - |
| Age at start of complementary feeding | Continuous | + |
| Source of drinking water | Categorical | - |
| Latrine facility in the house | Categorical | - |
Results and Discussion
The analysis and discussion of the responses gathered through the structured questionnaire and anthropometric measurement and focus group discussion. Descriptive statistics and statistical model analysis were employed. The relationship between the dependent variables (indicator of child malnutrition such as stunting, wasting and underweight) with their respective explanatory variables and the effect of the explanatory variables on the dependent variables are also presented.
Household demographic and socioeconomic characteristics
Some descriptive statistics of gender, households’ size, number of under-five children in the household, parental and maternal educational characteristics, mothers’ occupation and household’s income of the sampled households are summarized in the Tables 3 and 4. From complete response obtained from 230 households about 29% were female headed households and 71% were male headed households. The average household size was 5, while the minimum and maximum household size was 2 and 15 respectively. Number of children under-five years was found to be in the sampled households with means of 1.17. While minimum and maximum number of children lives within the households was 1 and 3 respectively.
Table 3. Household demographic characteristics in small towns (A/Bello and Boneya) of Sebeta Hawas District, 2017.
| Household head | |||||
|---|---|---|---|---|---|
| Sex | Number | Percent | |||
| Male | 196 | 71 | |||
| Female | 34 | 29 | |||
| Total | 230 | 100 | |||
| Households size | |||||
| Variable | Obs | Mean | SD | Min | Max |
| Household size | 230 | 5 | 2 | 2 | 15 |
| Number of under-five children | |||||
| Variable | Obs | Mean | SD | Min | Max |
| No under-five | 230 | 1.17 | 0.39 | 1 | 3 |
Table 4. Household socioeconomic characteristics in the small towns (A/Bello and Boneya) of Sebeta Hawas district, 2017.
| Parental education | ||||||
|---|---|---|---|---|---|---|
| Category | Number | Percent | ||||
| No formal education | 57 | 24.78 | ||||
| Can read and write | 19 | 8.26 | ||||
| Primary | 99 | 43.04 | ||||
| Secondary | 21 | 9.13 | ||||
| Degree and above | 3 | 1.30 | ||||
| Not alive & separate | 31 | 13.48 | ||||
| Total | 230 | 100 | ||||
| Parental education (Year) | ||||||
| Variable | Obs | Mean | SD | Min | Max | |
| Education (year) | 199 | 3.80 | 3.90 | 0 | 15 | |
| Maternal education | ||||||
| Category | Number | Percent | ||||
| No formal education | 109 | 47.39 | ||||
| Can read and write | 4 | 1.74 | ||||
| Primary | 95 | 41.30 | ||||
| Secondary | 19 | 8.26 | ||||
| Technical and vocational | 109 | 1.30 | ||||
| Total | 4 | 100 | ||||
| Maternal education (Year) | ||||||
| Variable | Obs | Mean | SD | Min | Max | |
| Education (year) | 230 | 2.97 | 3.59 | 0 | 13 | |
| Maternal occupation | ||||||
| Category | Number | Percent | ||||
| Housewife | 80 | 34.78 | ||||
| Farming | 27 | 11.74 | ||||
| Pit trade | 107 | 46.52 | ||||
| Employed | 14 | 6.09 | ||||
| Handcraft | 2 | 0.87 | ||||
| Total | 230 | 100 | ||||
| Household monthly income | ||||||
| Variable | Obs | Mean | SD | Min | Max | |
| Income | 230 | 3998.70 | 8688.84 | 150 | 120,000 | |
| Exposure to mass media | ||||||
| Category | Number | Percent | ||||
| Yes | 98 | 42.61 | ||||
| No | 132 | 57.39 | ||||
| Total | 230 | 100 | ||||
Obs-Observation
Parental and maternal education level considered in both completed grade and categorical form; because the categorical form helps the investigator to capture informal education attended by the parents of the child. Thus, the parental educational level from the surveyed households 57 (24.78%) had no formal education, 19 (8.26%) were can read and write, 99 (43.04%) were attended primary education, 21 (9.13%) were attended secondary education and only 3 (1.30%) were attended higher educational level. The mean parental education was 3.80 with maximum higher degree (bachelor degree) educational level. Similarly the maternal educational level attended by the respondents were 109 (47.39%) had no formal education, 4 (1.74%) were can read and write, 95 (41.30%) were attended primary education, 19 (8.26%) were attended secondary education and 3 (1.30%) were attended technical and vocational. And the mean of maternal education was 2.97 with the maximum attainment of technical and vocational education.
The survey result shows that the main occupation of mothers involved were petty trade 107 (46.52%), 27 (11.74%) farming, 14 (6.09%) employed at self-organization or governmental organization and 2 (0.87%) hand craft whereas the rest 80 (34.78%) were housewives. The mean households’ monthly income was 3,998.70ETB with minimum of 150ETB and maximum of 120,000ETB.
For the purpose of this study children age 6-59 months were targeted and only one child in this age category was selected from each sample household. From those 230 sampled children 118 (51.30%) were male and 112 (48.70%) were female. In other word the proportion of male and female included in the sample were almost equal. The minimum and maximum age of children was 6 and 59 months respectively with mean age of 28.84 months. Similarly the mean birth order of child was found to be 2.68 with minimum 1 and maximum 10 birth order (Table 5).
Table 5. Child demographic characteristics in the small towns (A/Bello and Boneya) of Sebeta Hawas district, 2017.
| Sex of child | |||||
|---|---|---|---|---|---|
| Sex | Number | Percent | |||
| Male | 118 | 51.30 | |||
| Female | 112 | 48.70 | |||
| Total | 230 | 100 | |||
| Age of child (in month) | |||||
| Variable | Obs | Mean | SD | Min | Max |
| Age | 230 | 28.84 | 15.45 | 6 | 59 |
| Birth order of child | |||||
| Variable | Obs | Mean | SD | Min | Max |
| Birth order | 230 | 2.68 | 1.84 | 1 | 10 |
As described in the Table 6, antenatal care visit by mothers during the pregnancy of selected child had mean value of 3.77 times with minimum 0 (no antenatal visit) and maximum 9 times visit. From 230 sample respondents 184 (80%) mothers provide breast immediately/ less than one hour after birth, 42 (18.26%) of them provide after one to twenty four hours after delivery and 3 (1.30%) mothers provide breast after twenty four hours. About 168 (73.04%) surveyed children fed colostrums and 62 (26.96%) of children not fed. Breast feeding is widely practiced among mothers, About 156 (67.83%) of them breast-fed their child exclusively for six months and 74 (32.17%) not exclusively fed their child. And about 139 (60.43%) of child fed breast during the survey. The mean value of duration of children breast feeding was 23.67 months with minimum of 0 and maximum of 54 months.
Table 6. Maternal and child caring behavior in the small towns (A/Bello and Boneya) of Sebeta Hawas district, 2017.
| Antenatal visit during pregnancy | ||||||||
|---|---|---|---|---|---|---|---|---|
| Variable | Obs | Mean | SD | Min | Max | |||
| Antenatal | 230 | 3.77 | 1.80 | 0 | 9 | |||
| Initiation of breast feeding | ||||||||
| Category | Number | Percent | ||||||
| Immediately\<1hr | 184 | 80 | ||||||
| After 1 to 24hr | 42 | 18.26 | ||||||
| After 24hr | 3 | 1.30 | ||||||
| Not given at all | 1 | 0.43 | ||||||
| Total | 230 | 100 | ||||||
| Feeding colostrums’ | ||||||||
| Category | Number | Percent | ||||||
| Yes | 168 | 73.04 | ||||||
| No | 62 | 26.96 | ||||||
| Total | 230 | 100 | ||||||
| Exclusive breastfeeding | ||||||||
| Category | Number | Percent | ||||||
| Yes | 156 | 67.83 | ||||||
| No | 74 | 32.17 | ||||||
| Total | 230 | 100 | ||||||
| Current breast feeding | ||||||||
| Category | Number | Percent | ||||||
| Yes | 139 | 60.43 | ||||||
| No | 91 | 39.57 | ||||||
| Total | 230 | 100 | ||||||
| Duration of breast feeding (in month) | ||||||||
| Variable | Obs | Mean | SD | Min | Max | |||
| Duration breast | 230 | 23.67 | 12.05 | 0 | 54 | |||
| Initiation of complementary feeding | ||||||||
| Category | Number | Percent | ||||||
| At 6 months | 118 | 51.30 | ||||||
| At < 6 months | 56 | 24.35 | ||||||
| At > months | 53 | 23.04 | ||||||
| Not yet start | 3 | 1.30 | ||||||
| Total | 230 | 100 | ||||||
| Vaccination | ||||||||
| Category | Number | Percent | ||||||
| Completed BCG-vitamin | 88 | 38.26 | ||||||
| Not completed BCG-vitamin | 125 | 54.35 | ||||||
| Not completed b/c age ( 6-9m) | 14 | 6.09 | ||||||
| Not vaccinated at all | 3 | 1.30 | ||||||
| Total | 230 | 100 | ||||||
The survey result also shows that about 118 (51.30%) of children fed complementary foods at the age of six months while 56 (24.35%) before six months and 53 (23.04%) after six months of age and only 3 (1.30%) of children had not started complementary foods. From the total 230 of children only 88 (38.26%) were fully vaccinated while 125 (54.35%) children were not fully vaccinated and 14 (6.09%) were not completed their vaccination because of their age lies from 6-9 months. Similarly 3 (1.30%) children were not vaccinated at all by any means (Table 7).
Table 7. Child health situations during the last two weeks before survey in the small towns (A/Bello and Boneya) of Sebeta Hawas District, 2017.
| Diarrhoea | ||
|---|---|---|
| Category | Number | Percent |
| Yes | 40 | 17.39 |
| No | 190 | 82.61 |
| Total | 230 | 100 |
| Cough | ||
| Category | Number | Percent |
| Yes | 85 | 37 |
| No | 145 | 63 |
| Total | 230 | 100 |
| Fever | ||
| Category | Number | Percent |
| Yes | 53 | 23 |
| No | 177 | 77 |
| Total | 230 | 100 |
| Vomiting | ||
| Category | Number | Percent |
| Yes | 5 | 2.2 |
| No | 225 | 97.8 |
| Total | 230 | 100 |
Disease incidence for child morbidity that occur during the last two weeks before the survey period result revealed that out of 230 children about 40 (17.39%) children were affected by diarrhea, 85 (37%) children were affected by respiratory infection disease, 53 (23%) children had fever and only 5 (2.2%) of children had vomiting in the last two weeks before survey.
Household environmental health situations
Environmental characteristics were one detrimental factors of child malnutrition. Thus, the survey result show that from 230 surveyed households only 15 (6.52%) households were used pipe water as main source of drinking water while 96 (41.74%) used public tap and 91 (39.57%) used protected dug well whereas 23 (10%) of households used unprotected dug well and the rest households used bottled water and unprotected spring. Regarding toilet facility about 81 (35.22%) had no toilet facility they used field or bush. While 30 (13.04%) households used pit latrine with slap and 119 (51.74%) of them used pit latrine without slap. Out of 230 sampled households 21(9.13%) had only a place for hand wash. Table 8 also indicates that 168 (73%) of the households were disposed waste in the field while 47 (20.43%) were disposed in pit dump and 15 (6.52%) burn the waste.
Table 8. Household environmental health situations in small towns (A/Bello and Boneya) of Sebeta Hawas district, 2017.
| Main source of drinking water | ||
|---|---|---|
| Category | Number | Percent |
| Pipe water | 15 | 6.52 |
| Public tap | 96 | 41.74 |
| Protected dug well | 91 | 39.57 |
| Unprotected dug well | 23 | 10.00 |
| Un protected spring | 1 | 0.43 |
| Bottled water | 4 | 1.74 |
| Total | 230 | 100 |
| Toilet facility | ||
| Category | Number | Percent |
| Pit latrine with slap | 30 | 13.04 |
| Pit latrine without slap | 119 | 51.74 |
| No facilities or bush/field | 81 | 35.22 |
| Total | 230 | 100 |
| Place of hand wash | ||
| Category | Number | Percent |
| Yes | 21 | 9.13 |
| No | 209 | 90.87 |
| Total | 230 | 100 |
| Waste disposal | ||
| Category | Number | Percent |
| Field | 168 | 73.04 |
| Pit dump | 47 | 20.43 |
| Burn | 15 | |
Children’s nutritional status
To assess nutritional status of children in the selected small towns of Sebeta Hawas district the anthropometric measurement of 230 children were collected. The most key indicators of nutritional status of children for both chronic and acute malnutrition were considered. Those indicators was height for age (stunting) which resulted from the effects of chronic malnutrition, weight for age (underweight) and weight for height (wasting). Additionally to strength the result of acute malnutrition MUAC measurement were also collected.
The anthropometric measurement was calculated using WHO Antro software according to the WHO [25] international growth standards. This software produces sex and age specific estimates for the prevalence of under nutrition, mean and SD of the z-scores for each indicator. Indices are expressed as standard deviation from the median reference group. According to this standard the cut point to be stunted, wasted or underweight (<- 2SD) while severely stunted, wasted or underweight (<-3SD) from the median of the reference population (Table 9).
Table 9. Overall prevalence of malnutrition, stunting, underweight and wasting in the small towns (A/Bello and Boneya) of Sebeta Hawas district, 2017.
| Indicators | < -3SD | < -2SD | Mean | SD | ||
|---|---|---|---|---|---|---|
| Number | Percent | Number | Percent | |||
| Overall Malnutrition | 25 | 10.9 | 106 | 46.0 | -0.79 | 1.23 |
| Stunting | 14 | 6.1 | 52 | 22.6 | -0.87 | 1.52 |
| Underweight | 7 | 3.0 | 37 | 16.1 | -0.91 | 1.12 |
| Wasting | 4 | 1.7 | 17 | 7.4 | -0.60 | 1.06 |
It indicates that the prevalence of overall malnutrition in the small towns was found to be high rate. From the total 230 sampled children 106 (46.0%) were malnourished and 25 (10.9%) were severely malnourished. Specifically, 52 (22.6%) children were stunted and 14 (6.1%) children were severely stunted. While 37 (16.1%) of children were underweight and 7 (3%) were severely underweight. Though the prevalence of wasting among those sampled children were 17 (7.4%) and 4 (1.7%) were severely wasted.
Stunting refers chronic malnutrition resulted from a cumulative and long term effect of inadequate nutrition, food shortages, frequent illness in the childhood. The consequence of to be stunted was mental retardation, low school performance, and reduce working capacity at adult age. The study result shows that the prevalence of stunting still high in the study area and the proportion stunted male children was higher compared to female children.
As indicated in the Table 10, the prevalence of stunting was found higher in children age group from 36-47 months 16 (32.70%) and lower at age group 6-11 months 2 (6.50%); severity of to be stunted also increase at age of 24-35 months by 9.80%.
Table 10. Prevalence of stunting by sex and age group in the small towns (A/Bello and Boneya) of Sebeta Hawas district, 2017).
| <-3SD | <-2SD | MEAN | SD | ||||
|---|---|---|---|---|---|---|---|
| Sex | Number | Percent | Number | Percent | |||
| Males | 118 | 8 | 6.80 | 27 | 22.90 | -0.91 | 1.53 |
| Females | 112 | 6 | 5.40 | 25 | 22.30 | -0.82 | 1.52 |
| Total | 230 | 14 | 6.10 | 52 | 22.60 | ||
| Age group in month n=230 | |||||||
| 6-11 | 31 | 0 | 0.00 | 2 | 6.50 | 0.10 | 1.16 |
| 12-23 | 72 | 5 | 6.90 | 11 | 15.30 | -0.50 | 1.73 |
| 24-35 | 41 | 4 | 9.80 | 12 | 29.30 | -1.21 | 1.67 |
| 36-47 | 49 | 3 | 6.10 | 16 | 32.70 | -1.38 | 1.12 |
| 48-59 | 37 | 2 | 5.40 | 11 | 29.70 | - | |