Research Article - Journal of Nutrition and Human Health (2025) Volume 9, Issue 1
Prevalence of cardiovascular disease risk factors among civil servant in Umuahia North local government area in Abia state.
1Department of Dietetics, University of Port Harcourt Teaching Hospital, Rives State, Nigeria
2Department of of Nutrition and Dietetics, Imo State University Owerri, Imo-State, Nigeria
*Corresponding Author:
- Collins PI Department of Dietetics, University of Port Harcourt Teaching Hospital, Rives State, Nigeria
E-mail:peacecollins60@gmail.com
Received: 21-Sep-2023, Manuscript No. AANHH-23-114403; Editor assigned: 25-Sep-2023, AANHH-23-114403 (PQ); Reviewed: 09-Oct-2023, QC No. AANHH-23-114403;
Revised: 08-Jan-2025, Manuscript No. AANHH-23-114403 (R); Published: 15-Jan-2025, DOI: 10.35841/aanhh.9.1.246
Citation: Collins PI, Okeke PN. Prevalence of cardiovascular disease risk factors among civil servant in Umuahia North local government area in Abia state. J Nutr Hum Health. 2025;9(1):246
Abstract
Background: Cardiovascular diseases contribute to high mortality rate occurring all over the world and its risk factors result from diabetes, hypertension, obesity/overweight, dyslipidemia, smoking and inactivity. Objectives: The study was aimed to assess the prevalence of cardiovascular disease risk factors among civil servant in Umuahia-North L.G.A in Abia-State.
Method: A cross sectional study was conducted among one thousand civil servants, (300 from Abia- State Secretariats while 700 from Federal Medical Centre Umuahia) both in Umuahia-North L.G.A. Multi-stage stratified sampling techniques were adopted in the study to obtained information on the cardiovascular disease risk factors among them. Civil servants aged 20-60 years were randomly selected. A standard method used to determine the height, weight measurement, body mass index, waist-hip circumference, blood sugar, blood pressure and dyslipidemia.
The data collected were analyzed using Statistical Package for Social Science (SPSS) version 21.0. Descriptive analysis of the means, standard deviation, frequency, percentage, correlation and Chi-square were used to present the basic demographic profile of the subject while T-test was used to determine the significance difference between male and female subjects.
Results: revealed that both male and female were at risk of cardiovascular diseases based on their waist circumference (49.6%) and waist-hip-ratio (52.2%) classification. Prevalence of overweight (35.1%) and obesity (36.9%) were high among the respondents. According to their systolic and diastolic blood pressure, it was observed that more men (8.4%) were at risk in hypertension crisis stage than women (2.3%). Also, 24.2% were pre-diabetic and diabetic.
Conclusion: men were found to be more at risk compared to the women. This shows the need for civil servant workers to be encouraged to take part in physical activity and to be physically active while controlling their food intake as it would help to reduce high mortality among people within the age of 41 and above because they were more predisposed to cardiac problems.
Keywords
Cardiovascular disease, Risk factors, Civil servant, Nutrition assessment, Clinical assessment, Dietary assessment.
Introduction
The prevalence of risk factors for Cardiovascular Disease (CVD) is on the increase in the developing nations of the world. Worldwide, CVD account for the majority of death due to chronic disease, and more than 80% of global burden of CVD will occur in low and middle income countries.
Cardiovascular Disease (CVD) is the most common cause of death in U.K and includes coronary heart disease (angina/heart attack), stroke (where normal blood supply to the brain is cut off, damaging the area affected), mini stroke (known as Transient Ischemic Attack or TIA) and peripheral arterial disease (narrowing of arteries usually in the legs) [1].
In the last decade in Nigeria and other parts of the world such as India and Saudi Arabia, cardiovascular diseases have become a major clinic and public health problem. It is characterized by high rate of disability, case fatality and unnecessary deaths particularly in Nigeria. However, there is a myth in Nigeria that death whether sudden or protracted from myocardial infarction (heart attack) or stroke (brain attack) is frequently attributed to spells on the family.
According to Srilakshmi, the various risk factors for cardiovascular disease have been classified into four categories which are:
Category I: Risk factors for which interventions have been proven to lower CVD risk are: Cigarette smoking, LDL cholesterol, high fat/cholesterol diet, hypertension disease, left ventricular hypertrophy and thrombogenic factors.
Category II: Risk factors for which interventions are likely to lower CVD risk are: Diabetes mellitus, physical inactivity, HDL cholesterol, triglycerides, small dense LDL, obesity and postmenopausal status.
Category III: Risk factors associated with increased CVD risk that if modified, might lower risk are: Psychological factors, lipoprotein, homocystine, Oxidative stress and no alcohol consumption.
Category IV: Risk factors associated with increased CVD risk which cannot be modified are: Age, male gender, and family history of early onset Cardiovascular Disease (CVD).
A report of a community base survey on cardiovascular risk factors and non-communicable disease in Abia state, Nigeria discovered that among the cardiovascular risk factors such as hypertension, diabetes mellitus and obesity was present in 31.8%, 3.6% and 13.8% respectively while low high density lipoprotein cholesterol was detected in 54.1% as the most prevalence in the community base survey done in Umuahia, Abia state [2-4].
Statistics has revealed that 15,000 Nigerian die annually as a result of CVDs and alarmingly, the number is expected to increase to 23million by the year 2030 if adequate measure are not taken. In 2008, 30% of all global death was attributed to cardiovascular disease. It is also estimated that by 2030, over 23million people will die from cardiovascular disease each year.
Dietary management is essential in type 2 diabetes mellitus, hypertension and obesity. Therefore, nutritional education and counselling remains an essential part of the management. Cardiovascular diseases take the lives of 17.9 million people every year, 31% of all global deaths [5].
Globally, overall CVD affects approximately 32.2% of all persons with type 2 diabetes. Cardiovascular disease annual global death are over 17 million, cancers are over 8.2 million, respiratory diseases are 4 million and diabetes are 1.5 million. In Nigeria, over half a million people died from CVDs in 2012 and one out of every five Nigerian adults over the age of 30 will likely die prematurely from CVDs [6,7]. Worse still, indices suggest the disease is substantially on the increase in the Nigeria as people continue to model their lifestyle and habits towards unhealthy living, thereby becoming more susceptible to the diseases. Of the several cardiovascular disease, experts say hypertension, closely followed by stroke is the most prevalent CVDs in Nigeria with many of the affected population unaware they are hypertensive or living with many of the deadly cardiovascular diseases.
A research carried out in 4 local government areas in Lagos state of Nigeria shows that there is general increase in death rates due to cardiovascular disease over the five year between 2000 to 2004. It was also discovered that the Proportional Mortality Ration (PMR) for cardiovascular disease was elevated in men (PMR=103; 95% cl=96-110) while there was deficit in female deaths (PMR=98; 95% cl=91-104). The highest CVD death rate was recorded among those in the 60-70 years age bracket [8,9].
Another study done in Umuahia, Abia state Nigeria in comparing indications for cardiovascular admissions into Federal medical centre, Umuahia, Abia state. It discovered in the study that hypertension and heart failure were the most prevalent in Umuahia which is the most common causes of admission in Federal medical centre Umuahia. And they are the indications of cardiovascular disease is FMC, Umuahia.
Materials and Methods
Survey design
The survey design was a cross sectional study and a mult-stage stratified sampling techniques was adopted in this study to obtain information on the cardiovascular disease risk factors among civil servant working in Umuahia North local government area, Abia state Nigeria.
Study area
The cross sectional study was carried out in Umuahia North local government area, Abia state, South-East Nigeria. Umuahia North has two clans, Ibeku and Ohuhu, it is a railway town and has a network of streets, roads and major roads linking it with other parts of the state.
Study population
The population of the study comprises of a total number of 1000 civil servant i.e. 700 from Federal medical centre Umuahia and 300 from Abia secretariats that have the highest population staffs from the listing of all the Government establishments in Umuahia North L.G.A, Abia- state was used [10].
Inclusion criteria and exclusion criteria
Inclusion criteria
- Participants must be residents of Abia state at least one year before the study.
- Eligible participants are the civil servant with in the age bracket of 20 year old and above.
- People who are civil servant and are working in the two selected parastatals.
Exclusion criteria
- Participants who are new in Abia state.
- Participants who are not civil servant.
- Those who are working in a private company.
Sampling method
A mult-stage stratified sampling techniques was used to select the study participants. There are (21) twenty-one government establishments in Umuahia-North Abia-state and they were arranged into 4 stages.
Stage 1: A combination of simple random sampling and systematic sampling techniques which are the probability sampling design were used to ascertain the selections of the parastatals in Umuahia North L.G.A.
Stage 2: A sampling frame was developed in form of a list and each establishment was given a number.
Stage 3: Selection of the establishment using systematic sampling techniques to select the one that have the highest population of civil servants in Umuahia North L.G.A.
Stage 4: The above two establishments were randomly selected from the listing of all the government establishments in Umuahia North L.G.A, Abia State with the age bracket between 20 to 70 years of civil servants.
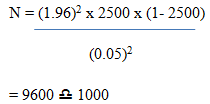
Sample size determination
The sample size for the study and the population size are 1000 and 2500 civil servant respectively.
Sample size estimation was determined using the Taro Yemane’s formular for calculating minimum sample size for descriptive studies when the population is equal or more than 10,000 below:
N=Z2pq/d2
Where:
N=Minimum sample size
Z=Standard normal deviation usually set as 1.96 which corresponds to 95% confidence interval.
d=Desired level of prevalence=0.05
p=Proportion/prevalence rate of the problem in the population estimated to have a particular characteristics.
q=1-P
Study instrument/tools
The instrument for data collection is semi-structured questionnaire which have two sections: The first one is the clinical data collection schedule section which contained information on clinical parameter such as blood pressure measurement, blood glucose estimation, fasting lipid profile determination and body mass index, waist-hip-ratio. The second one is the structured questionnaire section on the basic demographic and behavioural variables. The questionnaire instrument was adapted from the generic WHO-STEPS instrument approach to surveillance of chronic non-communicable disease risk factors and will be modify to suit Nigeria environment through robust review of relevant literature [11].
The demographic variables that were collected from the study population include age, sex, marital status, education, occupation, social class and family history of CVDs. The social classifications of the subjects were divided into lower, middle and upper occupational classes to suit Nigerian environment. The family history of CVD was coded as yes or no for the presence or absence of CVD such as hypertension, heart failure, myocardial infarction or stroke in any of the first, second or third degree generation family members respectively. The CVD risk factors were also evaluated where dyslipidermia, obesity, diabetes mellitus, alcohol consumption and physical activity were used [12]. The questionnaire was pre-testing which will enable me to ascertain any ambiguities or any irrelevance methods equipment and instruments and remove them.
The questionnaire instrument was interviewer-administer and English language was used. However, local language was also used to explain verbally to the civil servant in Umuahia North Local Government Area who could not understand the medical language in the questionnaire.
The glucometer apparatus were used to determine the fasting plasma glucose. The anthropometric indices was used to evaluate the weight and the height and the estimation of Body Mass Index (BMI) while the clinical assessment of blood pressure and fasting lipid profile were also used to assessed the cardiovascular risk factors among civil servants in Umuahia-north L.G.A.
Data management
Data reliability and validity plan: A pre-test test was carried among the civil servant in each selected government establishment.
Data entry plan: Data entry was done using SPSS version 21.0
Data analysis plan: Data analysis was done using SPSS Version 21.0 statistical software package.
Descriptive statistics: Categorical data was presented in frequencies and percentages, while continuous data were presented in means and standard deviations.
Inferential statistics: Statistical analysis of the data generated from the study was done using the Statistical Package for Social Sciences (SPSS) version 21.0 [13]. Values were expressed as mean ± of standard deviation. Correlation and Chi-square were used to establish associations between variables, while T-test was used to determine the significance difference of the respondent. A p-value less than or equal to 0.05 was considered significant for all statistics tests.
Results
Table 1 below revealed the socioeconomic characteristics of the respondents that took part of the study. The age of these civil servants ranged from 20-60 years. There were 609 (60.9%) females and 391 (39.1%) males which imply that greater percentage of the population in the study were females. Other demographic profiles of the study participants were shown in the Table 1.
| Male | Female | Total | ||||
| Variables | Freq | % | Freq | % | Freq | % |
| Age (years) | ||||||
| 20-40 | 172 | 44 | 318 | 52.2 | 490 | 49 |
| 41-60 | 207 | 52.9 | 285 | 46.8 | 492 | 49.2 |
| Above 60 | 12 | 3.1 | 6 | 1 | 18 | 1.8 |
| Total | 391 | 100 | 609 | 100 | 1000 | 100 |
| Education level | ||||||
| Primary | 82 | 2.1 | 20 | 3.3 | 102 | 10.2 |
| Secondary | 89 | 22.8 | 186 | 30.5 | 275 | 27.5 |
| Tertiary | 220 | 56.3 | 403 | 66.2 | 623 | 62.3 |
| Total | 391 | 100 | 609 | 100 | 1000 | 100 |
| Religion | ||||||
| Igbo | 363 | 92.8 | 581 | 95.4 | 944 | 94.4 |
| Hausa | 8 | 2 | 10 | 1.6 | 18 | 1.8 |
| Yoruba | 16 | 4.1 | 14 | 2.3 | 30 | 3 |
| Akwibom | 4 | 1 | 4 | 0.7 | 8 | 0.8 |
| Total | 391 | 100 | 609 | 100 | 1000 | 100 |
| Marriage | ||||||
| Married | 280 | 71.6 | 465 | 76.4 | 745 | 74.5 |
| Single | 107 | 27.4 | 124 | 20.4 | 231 | 23.1 |
| Widowed | 4 | 1 | 20 | 3.3 | 24 | 2.4 |
| Total | 391 | 100 | 609 | 100 | 1000 | 100 |
| Income | ||||||
| 20-50 | 152 | 38.9 | 222 | 36.5 | 374 | 37.4 |
| 51-60 | 41 | 10.5 | 63 | 10.3 | 104 | 10.4 |
| 61-100 | 91 | 23.3 | 148 | 24.3 | 239 | 23.9 |
| Above 100 | 107 | 27.4 | 176 | 28.9 | 283 | 28.3 |
| Total | 391 | 100 | 609 | 100 | 1000 | 100 |
| Social class | ||||||
| Upper level | 87 | 22.3 | 141 | 23.2 | 228 | 22.8 |
| Middle level | 266 | 68 | 389 | 63.9 | 655 | 65.5 |
| Lower level | 38 | 9.7 | 79 | 13 | 117 | 11.7 |
| Total | 391 | 100 | 609 | 100 | 1000 | 100 |
Table 1. Socioeconomic characteristics of the respondents.
The Table 2 showed that 97.3% the respondents consumed fruits and 96.6% of the respondents consumed vegetables.
| Male | Female | Total | ||||
| Variables | Freq | % | Freq | % | Freq | % |
| Fruit consumption | ||||||
| Yes | 368 | 94.1 | 605 | 99.3 | 973 | 97.3 |
| No | 23 | 5.9 | 4 | 0.7 | 27 | 2.7 |
| Total | 391 | 100 | 609 | 100 | 1000 | 100 |
| Frequency of consuming fruits | ||||||
| Once a day | 209 | 56.7 | 350 | 57.8 | 559 | 57.5 |
| Twice a day | 115 | 31.3 | 167 | 27.7 | 282 | 28.9 |
| Three times a week | 21 | 5.7 | 23 | 3.8 | 44 | 4.6 |
| More than four times a week | 23 | 6.3 | 65 | 10.7 | 88 | 9 |
| Total | 368 | 100 | 605 | 100 | 973 | 100 |
| Vegetables consumption | ||||||
| Yes | 379 | 96.9 | 587 | 96.4 | 966 | 96.6 |
| No | 12 | 3.1 | 22 | 3.6 | 34 | 3.4 |
| Total | 391 | 100 | 609 | 100 | 1000 | 100 |
| Frequency of vegetables consumption | ||||||
| Once a day | 344 | 90.8 | 474 | 80.8 | 818 | 84.6 |
| Twice a day | 22 | 5.8 | 68 | 11.6 | 90 | 9.4 |
| Three times a week | 7 | 1.9 | 25 | 4.2 | 32 | 3.3 |
| More than four times a week | 6 | 1.5 | 20 | 3.4 | 26 | 2.7 |
| Total | 379 | 100 | 587 | 100 | 966 | 100 |
| Whether you eat at home | ||||||
| Yes | 362 | 92.6 | 583 | 95.7 | 945 | 94.5 |
| No | 29 | 7.4 | 26 | 4.3 | 55 | 5.5 |
| Total | 391 | 100 | 609 | 100 | 1000 | 100 |
| Whether you eat fried foods | ||||||
| Yes | 333 | 85.2 | 492 | 80.8 | 825 | 82.5 |
| No | 58 | 14.8 | 117 | 19.2 | 175 | 17.5 |
| Total | 391 | 100 | 609 | 100 | 1000 | 100 |
| Type of meat eaten | ||||||
| Offal's meat | 94 | 24 | 96 | 15.8 | 190 | 19 |
| Red meat | 69 | 17.6 | 86 | 14.1 | 155 | 15.5 |
| Tozo/artery meat | 25 | 6.4 | 59 | 9.7 | 84 | 8.4 |
| Fish | 50 | 12.8 | 86 | 14.1 | 136 | 13.6 |
| Chicken | 16 | 4.1 | 57 | 9.4 | 73 | 7.3 |
| All of the above | 137 | 35 | 225 | 36.9 | 362 | 36.2 |
| Total | 391 | 100 | 609 | 100 | 1000 | 100 |
Table 2. Dietary habit of the respondents.
Their lifestyle pattern in the Table 3, below showed that 9.9% of the respondents smoke where 50.5% started it since 2 years ago and 24.2% opted a year. Only 46.8% of the respondents take alcoholic drink.
| Variables | Male | Female | Total | |||
| Freq | % | Freq | % | Freq | % | |
| Smoking | ||||||
| Yes | 61 | 15.6 | 38 | 6.2 | 99 | 9.9 |
| No | 330 | 84.4 | 571 | 93.8 | 901 | 90.1 |
| Total | 391 | 100 | 609 | 100 | 1000 | 100 |
| When you started smoking (years) | ||||||
| 1 | 15 | 24.5 | 9 | 23.7 | 24 | 24.2 |
| 2 | 24 | 3.3 | 26 | 68.4 | 50 | 50.5 |
| 3 | 1 | 1.6 | 0 | 0 | 1 | 1 |
| 4 | 7 | 11.5 | 0 | 0 | 7 | 7.1 |
| 7 | 3 | 4.9 | 0 | 0 | 3 | 3 |
| 10 | 4 | 6.6 | 0 | 0 | 4 | 4 |
| 18 | 3 | 4.9 | 3 | 7.9 | 6 | 6.1 |
| 20 | 4 | 6.6 | 0 | 0 | 4 | 4 |
| Total | 61 | 100 | 38 | 100 | 99 | 100 |
| Intake of alcoholic drinks | ||||||
| Yes | 231 | 58.8 | 238 | 39.1 | 469 | 46.8 |
| No | 160 | 41.2 | 371 | 60.9 | 531 | 53.2 |
| Total | 391 | 100 | 609 | 100 | 1000 | 100 |
| Number of bottles taken | ||||||
| 1-2 bottles | 93 | 40.4 | 129 | 54 | 222 | 47.3 |
| 3-4 bottles | 105 | 45.7 | 99 | 41.4 | 204 | 43.5 |
| 5 and above | 32 | 13.9 | 11 | 4.6 | 43 | 9.2 |
| Total | 230 | 100 | 239 | 100 | 469 | 100 |
| Frequency of alcoholic intake | ||||||
| Sparingly | 129 | 56.1 | 112 | 46.9 | 241 | 51.4 |
| Daily | 80 | 34.8 | 115 | 48.1 | 195 | 41.6 |
| once in a week | 21 | 9.1 | 12 | 5 | 33 | 7 |
| Total | 230 | 100 | 242 | 100 | 469 | 100 |
| History of alcoholic intake | ||||||
| Yes | 144 | 36.8 | 163 | 26.8 | 307 | 30.7 |
| No | 247 | 63.2 | 446 | 73.2 | 693 | 69.3 |
| Total | 391 | 100 | 609 | 100 | 1000 | 100 |
| Cholesterol | ||||||
| Yes | 86 | 22 | 99 | 16.3 | 185 | 18.5 |
| No | 305 | 78 | 510 | 83.7 | 815 | 81.5 |
| Total | 391 | 100 | 609 | 100 | 1000 | 100 |
| Seen a dietician | ||||||
| Yes | 94 | 24 | 124 | 20.4 | 218 | 21.8 |
| No | 297 | 76 | 485 | 79.6 | 782 | 78.2 |
| Total | 391 | 100 | 609 | 100 | 1000 | 100 |
Table 3. Lifestyle pattern of the respondents.
This Table 4 revealed that 32.5% engaged themselves in walking, 30.8% run around and 1.1% participant in 3 difference activity such as running, walking and football. Majority of the respondent 32.5% were diagnosed of hypertension 2 years ago and 78.4% are currently on anti-hypertensive drugs. It is also revealed that 20.6% of the participants had diabetes mellitus and 69.4% of them were diagnosed 1-5 years ago while 95.1% of them were on anti-diabetic medication.
| Male | Female | Total | ||||
|---|---|---|---|---|---|---|
| Variables | Freq | % | Freq | % | Freq | % |
| Types of exercise engaged in | ||||||
| Running | 150 | 38.3 | 158 | 25.9 | 308 | 30.8 |
| Swimming | 91 | 23.3 | 163 | 26.7 | 254 | 25.4 |
| Football | 19 | 4.9 | 4 | 0.7 | 23 | 2.3 |
| none of the above | 37 | 9.5 | 40 | 6.6 | 77 | 7.7 |
| Walking | 84 | 21.5 | 241 | 39.6 | 325 | 32.5 |
| basket ball | 2 | 0.5 | 0 | 0 | 2 | 0.2 |
| Running, football and walking | 8 | 2 | 3 | 0.5 | 11 | 1.1 |
| Total | 391 | 100 | 609 | 100 | 1000 | 100 |
| Whether you are physically active | ||||||
| Yes | 374 | 95.7 | 573 | 94.1 | 947 | 94.7 |
| No | 17 | 4.3 | 36 | 5.9 | 53 | 5.3 |
| Total | 391 | 100 | 609 | 100 | 1000 | 100 |
| Whether you are hypertensive | ||||||
| Yes | 191 | 48.8 | 249 | 40.9 | 440 | 44 |
| No | 200 | 51.2 | 360 | 59.1 | 560 | 56 |
| Total | 391 | 100 | 609 | 100 | 1000 | 100 |
| Year diagnosed hypertension | ||||||
| 1 | 57 | 29.8 | 84 | 33.7 | 141 | 32 |
| 2 | 59 | 30.9 | 84 | 33.7 | 143 | 32.5 |
| 3 | 11 | 5.8 | 24 | 9.6 | 35 | 8 |
| 4 | 16 | 8.4 | 3 | 1.2 | 19 | 4.3 |
| 5 | 20 | 10.5 | 7 | 2.8 | 27 | 6.1 |
| 6 | 7 | 3.7 | 12 | 4.8 | 19 | 4.3 |
| 7 | 0 | 0 | 3 | 1.2 | 3 | 0.7 |
| 8 | 8 | 4.2 | 7 | 2.8 | 15 | 3.4 |
| 9 | 5 | 2.6 | 12 | 4.8 | 17 | 3.9 |
| 10 | 4 | 2.1 | 7 | 2.8 | 11 | 2.5 |
| 12 | 2 | 1 | 3 | 1.2 | 5 | 1.1 |
| 16 | 0 | 0 | 3 | 1.2 | 3 | 0.7 |
| 24 | 2 | 1 | 0 | 0 | 2 | 0.5 |
| Total | 191 | 100 | 249 | 100 | 440 | 100 |
| Currently on medication | ||||||
| Yes | 155 | 82.9 | 190 | 75.1 | 345 | 78.4 |
| No | 32 | 17.1 | 63 | 24.9 | 95 | 21.6 |
| Total | 187 | 100 | 253 | 100 | 440 | 100 |
| Family history of hypertension | ||||||
| Yes | 130 | 33.2 | 271 | 44.5 | 401 | 40.1 |
| No | 261 | 66.8 | 338 | 55.5 | 599 | 59.9 |
| Total | 391 | 100 | 609 | 100 | 1000 | 100 |
| Diabetic | ||||||
| Yes | 113 | 28.9 | 93 | 15.3 | 206 | 20.6 |
| No | 278 | 71.1 | 516 | 84.7 | 794 | 79.4 |
| Total | 391 | 100 | 609 | 100 | 1000 | 100 |
| When diagnosed | ||||||
| 1-5 years | 67 | 59.3 | 76 | 81.7 | 143 | 69.4 |
| 6-10 years | 32 | 28.3 | 7 | 7.5 | 39 | 18.9 |
| 11-14 years | 14 | 12.4 | 10 | 10.8 | 24 | 11.7 |
| Total | 113 | 100 | 91 | 100 | 206 | 100 |
| On any medication for diabetes | ||||||
| Yes | 111 | 98.2 | 85 | 91.4 | 196 | 95.1 |
| No | 2 | 1.8 | 8 | 8.6 | 10 | 4.9 |
| Total | 113 | 100 | 91 | 100 | 206 | 100 |
| Family history of diabetes | ||||||
| Yes | 174 | 44.5 | 249 | 40.9 | 423 | 42.3 |
| No | 217 | 55.5 | 360 | 59.1 | 577 | 57.7 |
| Total | 391 | 100 | 609 | 100 | 1000 | 100 |
Table 4. Lifestyle pattern of the respondents.
The Table 5 below showed the anthropometric classifications of the respondents. Their waist circumference classification revealed that 50.4% were normal while greater percentage of the women (64.3%) compared to the men (28.1%) were at risk of cardiovascular diseases. Significant relationship (x2=118.356; p=0.000). Similarly, there was significant relationship (x2=369.173; p= 0.000) in the WHR classification of the men and women.
| Variables | Male | Female | Total | X2 | p-value | |||
| Freq | % | Freq | % | Freq | % | |||
| Waist circumference | 118.356 | 0.000* | ||||||
| Normal (female <88 cm and male <102 cm) | 281 | 71.9 | 223 | 36.6 | 504 | 50.4 | ||
| At risk (female>=88 cm and male >=102 cm) | 110 | 28.1 | 386 | 64.3 | 496 | 49.6 | ||
| Total | 391 | 100 | 609 | 100 | 1000 | 100 | ||
| Waist-hip-ratio | 369.173 | 0.000* | ||||||
| Normal (female <=0.8 and male <=1) | 335 | 85.7 | 143 | 23.5 | 478 | 47.8 | ||
| At risk (female >0.8 and male >1) | 56 | 14.3 | 466 | 76.5 | 522 | 52.2 | ||
| Total | 391 | 100 | 609 | 100 | 1000 | 100 | ||
| BMI | 21.63 | 0.000* | ||||||
| Underweight ( >18.5) | 2 | 0.5 | 15 | 2.5 | 17 | 1.7 | ||
| Normal (18.5-24.9) | 96 | 24.6 | 167 | 27.4 | 263 | 26.3 | ||
| Overweight (25-29.9) | 168 | 43 | 183 | 30 | 351 | 35.1 | ||
| Obese (30 and above) | 125 | 32 | 244 | 40.1 | 369 | 36.9 | ||
| Total | 391 | 100 | 609 | 100 | 1000 | 100 | ||
| Note: *=significant | ||||||||
Table 5. Anthropometric parameters of the respondent.
From the Table 6 below a good number of respondents had normal systolic blood pressure (43.5%). Some (22.1%) had elevated systolic blood pressure while 14.5%. 15.2% and 4.7% were in stage 1,2 and hypertensive crisis respectively.
| Male | Female | Total | X2 | p-value | ||||
| Parameters | Freq | % | Freq | % | Freq | % | ||
| Systolic blood pressure | 30.425 | 0.000* | ||||||
| Normal (<120) | 140 | 35.8 | 295 | 48.4 | 435 | 43.5 | ||
| Elevated BP (120-129) | 91 | 23.3 | 130 | 21.3 | 221 | 22.1 | ||
| Hypertension stage 1 (130-139) | 65 | 16.6 | 80 | 13.1 | 145 | 14.5 | ||
| Hypertension stage 2 (140-180) | 62 | 15.9 | 90 | 14.8 | 152 | 15.2 | ||
| Hypertensive crisis ( >180) | 33 | 8.4 | 14 | 2.3 | 47 | 4.7 | ||
| Total | 391 | 100 | 609 | 100 | 1000 | 100 | ||
| Diastolic blood pressure | 32.131 | 0.000* | ||||||
| Normal (<80) | 149 | 38.1 | 300 | 49.3 | 449 | 44.9 | ||
| Elevated BP (80) | 86 | 22 | 150 | 24.6 | 236 | 23.6 | ||
| Hypertension stage 1 (81-89) | 32 | 8.2 | 40 | 6.6 | 72 | 7.2 | ||
| Hypertension stage 2 (90-120) | 101 | 25.8 | 112 | 18.4 | 213 | 21.3 | ||
| Hypertensive crisis (>120) | 23 | 5.9 | 7 | 1.1 | 30 | 3 | ||
| Total | 391 | 100 | 609 | 100 | 1000 | 100 | ||
| Note: *=significant | ||||||||
Table 6. Blood pressure classifications of the respondents.
In the Table 7 below revealed that 48.7% were normal while 24.2% and 22% were both pre-diabetic and diabetic respectively.
|
|
Male |
Female |
Total |
X2 |
p-value |
|||
|
Freq |
% |
Freq |
% |
Freq |
% |
|||
|
Fasting blood sugar (mg/dl) |
16.03 |
0.001* |
||||||
|
Low (<70) |
23 |
5.9 |
28 |
4.6 |
51 |
5.1 |
||
|
Normal (70-99) |
174 |
44.5 |
313 |
51.4 |
487 |
48.7 |
||
|
Pre-diabetes (100-125) |
84 |
21.5 |
158 |
25.9 |
242 |
24.2 |
||
|
Diabetes (>125) |
110 |
28.1 |
110 |
18.1 |
220 |
22 |
||
|
Total |
391 |
100 |
609 |
100 |
1000 |
100 |
||
|
Note: *=significant |
||||||||
Table 7. Fasting blood sugar of the respondents.
The Table 8 below revealed the correlation between the FBS, systolic and diastolic blood pressure of the respondents and their anthropometric indices. The hip circumference of the respondent is significantly (p<0.005) affected their FBS.
| Parameters | FBS | Systolic | Diastolic |
|---|---|---|---|
| Weight | (0.875)0.005 | (0.003)0.093* | (0.200)0.041 |
| Height | (0.060)0.060 | (0.088)0.054 | (0.808)0.008 |
| BMI | (0.409)-0.026 | (0.041)0.65* | (0.243)0.037 |
| Hip | (0.026)0.071* | (0.000)0.130* | (0.001)0.110* |
| Waist | (0.007)0.085 | (0.025)0.071 | (0.018)0.075* |
| WHR | (0.505)-0.021 | (0.098)-0.052 | (0.490)-0.022 |
| Note:*=significant | |||
Table 8. Correlation between the FBS, systolic and diastolic blood pressure of the respondents’ and their anthropometric characteristics.
This Table 9 showed the mean anthropometric indices of the respondents. The mean weight, height and hip circumference of the men are (78.55 kg, 166.25 cm and 106.59 cm) respectively while the (74.88 kg, 162.59 cm and 103.66 cm) respectively are for women that participated in the study.
| Male | Female | Significance | |
| Parameters | Mean ± SD | Mean ± SD | |
| Weight | 78.55 ± 14.38 | 74.88 ± 19.45 | 0.001 |
| Height | 166.25 ± 8.29 | 162.91 ± 7.63 | 0 |
| BMI | 28.56 ± 5.55 | 28.31 ± 7.35 | 0.557 |
| Hip | 106.59 ± 17.01 | 103.66 ± 17.144 | 0.008 |
| Waist | 94.59 ± 11.88 | 92.98 ± 18.75 | 0.13 |
| WHR | 0.89 ± 0.13 | 0.91 ± 0.23 | 0.271 |
Table 9. Mean anthropometric characteristics of the respondents.
Discussion
Table 1 revealed the socioeconomic characteristics of the respondents that took part in this study. Out of 700 Federal medical centre staffs and 300 secretarial staffs that participated in this study, 60.9% (609) were females and 39.1% (391) were males, which implied that greater percentage of the study population were females. Close to half (49.2%) were within the age of 41-60 years and 49% were between 20 to 40. From these findings, it may be deduced that most of the respondents were middle aged (40-60 years), which may result from late completion of school due to academic delays via strike actions or duration of the courses studied at their various higher institutions, leading to late enrolment into the labour force [14]. On the other hand, only a few respondents were above the age of 60. This may be indicative of early retirement by health workers or possibly greater rate of employment of younger health workers.
Most (62.3%) of the respondents were graduates or still in high institution and 27.5% were SSCE holders. The fact that majority of the respondents used in this study suggests that they would be enlightened on the need to make healthy food choices and also eat healthy foods. In light of the above, Cai et al., reported that increased knowledge enables an individual to make healthy choices regarding dietary habits and physical activity [15]. According to their ethnic group, majority (94.4%) were Igbo. This may be attributed to the location of the study area within the eastern part of Nigeria, which is known to be densely populated by Igbos. Greater percentages (74.5%) were married and 23.1% singles. Income wise, 37.4% earned between 20-50 thousand naira, 28.3% above #100 k while 23.9% earned #51-60 k. Most (65.5%) of them opted that they were in middle class and 22.8% indicated that they were in upper class. This could be due to their income levels or as a result of their position in the society [16].
Dietary habit of the respondents in Table 2 above revealed that 97.3% of the respondents consumed fruits. Out of these numbers, 57.5% consumed it once a day and 28.9% took it twice a day. Similarly, 96.6% of the respondents claimed that they took one form of vegetables or the other. Among these numbers, 84.6% took it once a day and 9.4% took it twice a day. Greater percentage (94.5%) of them usually eats at home [17]. Majority (82.5%) consumed fried foods. According to their intake of meat, 36.2% consumed all types of meat listed in the study, 19% took offal's meat and this type of meat is said to be high in cholesterol and saturated fat as reported by Babatunde et al., in their studies, 15.5% took red meat and 13.6% took fish.
Their lifestyle pattern in Table 3 showed that only 9.9% of the respondents smoked where 50.5% started it since 2 years ago and 24.2% opted a year. Only 46.8% of the respondents claimed to take alcoholic beverages [18]. This could be that who do not take it was aware of its health implications because excessive alcohol can lead to decompensate liver disease possibly cirrhosis of the liver. Intake of alcoholic drinks among the respondents was low compared to 94.7% reported by Ordinioha. Among this number, 47.3% took 1-2 bottles and 43.5% took 3-4 bottles. According to their frequency of its consumption, 51.4% claimed that they took it sparingly and 41.6% took it daily. Due to the health implication of smoking and drinking, the civil servant Umuahia-North L.G.A should be advice to quit this act so to avoid elevation in their blood pressure which is a major risk factor for Cardiovascular Disease (CVD) causing significant loss of years of quality of life. In addition to this, Wolf in his studies opined that the relationship between alcohol consumption and the elevation of blood pressure is still controversial, meanwhile cigarette smoking is said to be responsible for at least 12% of all vascular diseases, including hypertension. However, 30.7% of them had family history of alcohol intake. Only 18.5% of the respondents agreed that they had elevated blood cholesterol levels. Also, it was observed that only 21.8% of them had seen a dietician. Smoking habits and alcoholism among the participants in this study could be the reason for the elevated blood cholesterol reported by the patient. This shows the need for them to be educated on the need to meet a dietitian who would educate them to eat right. This is because it could predispose them to various cardiovascular and metabolic diseases especially with age advancement [19].
In Table 4 above, 32.5% of the respondents engaged themselves in walking, 30.8% running around and 25.4% engaged in swimming. However, 94.7% opted that they were physically active. Those who were active and also took part in one form of exercise and the other in this study were not likely to be overweight or obese as it helps in weight reduction, although their level of activity was not specified. Greater percentage of the men were observed to take part in physical activity which concurred with report of Joint Health Surveys Unit (JHSU) of England where it was noted that physical activity levels vary according to gender with women being less physically active than men. Another study by Siyabonga and Nomathemba, among health professionals in Kwazulu-Natal South Africa, found that two-fifths (40%) of the health professionals were less physically active. This difference may indicate that the health workers in the present study have more work demands or were more physically active than their counterparts. Some (44%) of them were hypertensive. According to those who were hypertensive, 32.5% and 32% were diagnosed 1-2 years ago and 40.1% had family history of it, which is a predisposing factor. Majority (78.4%) were currently on medication which could be that, they were aware of the implication of not doing so. Ordinioha found lower prevalence of hypertension among lecturers probably due to the better health-seeking behavior of the medical lecturers, especially as 75% of those that were found to be hypertensive were already aware of their condition, and had taken concrete steps to control the hypertension. Also, 20.6% of them were diabetic and 70.1% of them were diagnosed 1-5 years ago while few (18.1% and 11.8%) were diagnosed 6-10 years and 11-14 years ago, respectively. Out of this number, 95.1% were on medication and 42.3% had family history of it [20].
The anthropometric classifications of the respondents in waist circumference revealed that 50.4% were normal while greater percentage of the women (64.3%) compared to the men (28.1%) were at risk of cardiovascular diseases. Significant relationship (x2=118.356; p=0.000). Similarly, there was significant relationship (x2=369.173; p=0.000) in the WHR classification of the men and women used in this study with greater percentage of the women (76.5%) being more predisposed to cardiovascular diseases when compared to 14.3% of the men. These could be due to the differences in way fat is stored in their bodies coupled with their ages. It was also found that 47.8% of them were normal. Central obesity prevalence in this study compared with 52.2% reported by Oguoma et al. According to their BMI classifications, 36.9% were obese, 35.1% were overweight while 26.3% were normal. However, 1.7% of them were underweight. There was significant differences (x2=21.630; p=0.000) in the men and women based on the fact that more women obese (40.1%) compared to 32% of the men. In consonance with this, a previous study by Kasu et al., among health workers in Kadjebi District of Ghana found similar rate (42.4%) of obesity among female workers than males (32.9%). However, Odili et al., in a study among pharmacy students in Benin City, Nigeria, found that most (80%) of the respondents had normal weight. This difference may be because of a higher level of physical activity among the pharmacy students than the health workers in the present study, since the former may be involved in increased activity as a result of academic involvements. Prevalence of overweight in this study (35.1%) was low compared to 60% reported by Ordinioha. However, those that were obese in this study (36.9%) were high compared to 22.6% reported by the authors.
Table 6 above revealed the blood pressure classifications of the respondents used in this study. Results indicate that a good number (43.5%) had normal systolic blood pressure. Some (22.1%) had elevated systolic blood pressure while 14.5%, 15.2% and 4.7% were in stage 1, 2 and hypertensive crisis, respectively. There was significant (x2=30.425; p=0.000) relationship among them and those who were at risk tend to be more among the men. Similarly, there was significant (x2=32.131; p=0.000) difference in the diastolic blood pressure of the men and women. It was also observed that more men were at risk due to their elevated diastolic blood pressure (8.2%, 25.8% and 5.9%) for those in stage 1, 2 and those at crisis stage compare to 6.6%, 18.4% and 1.14% of the women. Although 44.9% were normal. This calls for attention as this may migrate to stroke if nothing is done about it. This could be that some of them were not aware of this as some of them opted that they were not hypertensive.
Their FBS results showed that 48.7% were normal while 24.2% and 22% were both pre-diabetic and diabetic, respectively. Overall prevalence of pre-diabetes in this study was higher than 4.9% and 5.4% respectively reported by Oguoma et al., Significant (x2=16.030; p=0.001) relationship exists among the men and women due to greater number of the men (28.1%) compare to the women (18.1%) who were diabetic. This could be due to their nature of jobs or their feeding pattern, coupled with heavy night meals.
The correlation between the FBS, systolic and diastolic blood pressure of the respondents and the anthropometric characteristics revealed that, Hip circumference of the respondents significantly (p<0.05) affected their FBS. Weight of the respondents had significant (p<0.05) effect on their systolic blood pressure, including their BMI and hip circumference. Also, their hip and waist circumferences had significant relationship with their diastolic blood pressure (p<0.05).
The findings revealed that mean weight, height and hip circumference of the men (78.55 kg, 166.25 cm and 106.59 cm) was significantly (p<0.05) higher than that of the women (74.88 kg, 162.91 cm and 103.66 cm). However, no significant relationship was observed in the mean BMI, waist and WHR of the respondents.
Conclusion
Results revealed that most of them claimed to be physically active by taking part in one form of activity and the other. Although this did not reflect in their nutritional status as most of them were overweight and obese. A good number were at risk of cardiovascular disease, coupled with those that were diabetic according to their blood sugar levels. In all these parameters, women were found to be more at risk compared to the men. This shows the need for civil servants to be encouraged to take part in physical activity and to be physically active while controlling their food intake as it would help to reduce high mortality among people within the age of 41 and above because they were more predisposed to cardiac problems.
Inform Contest
Was obtained from the civil servants that agreed to participant in the study before administering questionnaire.
Confidentiality
Information was treated with the utmost confidentiality.
Ethical Clearance
Ethical certificate was obtained from the Health Research and Ethics Committee (HREC), Federal Medical Centre, Umuahia, Abia State.
Conflict of Interest
The author has no conflict of interest to disclose.
Funding
No funding was received.
Author Contribution
Collins, P. l. designed the study, conduct the research, interpret the result and wrote manuscript draft. Okeke, P.N supervised the study and reviewed the manuscript.
References
- Arodinwe EB, Ike SO, Nwokedinko SC. Case fatality among hypertension-related admisssions in Enugu, Nigeria. Niger J Clin Pract. 2009;12(2). [Crossref]
[Google Scholar] [PubMed]
- Babatunde OA, Andrew BF, Amanda C, et al. The Potential of offal’s consumption in food system: Production, prospects and challenges. Sustainability 2018. Amathole District Eastern Cape South African. 2018.
- Cai L, He J, Song Y, Zhao K, et al. Association of obesity with socio-economic factors and obesity-related chronic diseases in rural southwest China. Public Health. 2013;127(3):247-51.
[Crossref] [Google Scholar] [PubMed]
- Mendis S, Puska P, Norrving BE. Global atlas on cardiovascular disease prevention and control. World Health Organization. 2011.
- Iloh GU, Chuku A, Obiegbu NP, et al. Frequency of cardiovascular risk factors in adult Nigerians with family history of non-communicable cardiovascular disease in a primary care clinic of a tertiary hospital in a resource-constrained environment of Eastern Nigeria. Am J Health Res. 2013;1(1):17-25.
- Iloh GU, Ikwudinma AO, Obiegbu NP. Obesity and its cardio-metabolic co-morbidities among adult Nigerians in a primary care clinic of a tertiary hospital in South-Eastern, Nigeria. J Family Med Prim Care. 2013;2(1):20-6.
[Crossref] [Google Scholar] [PubMed]
- India Heart Association (IHA). Facts of Cardiovascular risk factors. J Human Hypertens. 2015;25: 224-30.
- Unit JH. Health survey for england physical activity validation study: Substantive report. Leeds, UK: Information Centre for Health and Social Care. 2007
- Ogah OS, Madukwe OO, Onyeonoro UU, et al. Cardiovascular risk factors and non-communicable diseases in Abia state, Nigeria: Report of a community-based survey. Int J Med Biomed Res. 2013;2(1):57-68.
- Ogah OS, Okpechi I, Chukwuonye II, et al. Blood pressure, prevalence of hypertension and hypertension related complications in Nigerian Africans: A review. World J Cardiol. 2012;4(12):327.
[Crossref] [Google Scholar] [PubMed]
- Oguoma VM, Nwose EU, Skinner TC, et al. Prevalence of cardiovascular disease risk factors among a Nigerian adult population: Relationship with income level and accessibility to CVD risks screening. BMC Public Health. 2015;15:1-6.
[Crossref] [Google Scholar] [PubMed]
- Ojikutu. The prevalence of Cardiovascular Disease in Lagos state of Nigeria. A report of Cardiovascular disease in 4 local Government in lagos state. Arch Med Sugery 2004;5.
- Ordinioha B, Brisibe S. The human health implications of crude oil spills in the Niger delta, Nigeria: An interpretation of published studies. Niger Med J. 2013;54(1):10-16.
[Crossref] [Google Scholar] [PubMed]
- Ordinioha B. The prevalence of hypertension and its modifiable risk factors among lecturers of a medical school in Port Harcourt, south-south Nigeria: Implications for control effort. Niger J Clin Pract. 2013;16(1):1-4.
[Crossref] [Google Scholar] [PubMed]
- Pandre HT, Chawla PS, Fernadez K. A recent developments in Cardiovascular Disease control and prevention in India. J Fan Med Primary Care. 2013;1:79-80.
- Kunene SH, Taukobong NP. Level of physical activity of health professionals in a district hospital in KwaZulu-Natal, South Africa. S Afr J Physiother. 2015;71(1).
[Crossref] [Google Scholar] [PubMed]
- Srilakshmi B Dietetics. New Age International. 2007.
- Uwanuruochi K, Ukpabi OJ, Onwuta CN, et al. Cardiovascular risk factors in adult staff of Federal Medical Centre, Umuahia: A comparison with other Nigerian studies. West Afr J Med. 2013;32(4):243-47. [Crossref]
[Google Scholar] [PubMed]
- Uthman OA, Hartley L, Rees K, et al. Multiple risk factor interventions for primary prevention of cardiovascular disease in low and middle income countries. Cochrane Database Syst Rev. 2015;8.
[Crossref] [Google Scholar] [PubMed]
- Wolf D. Patient satisfaction linked to hospital employee satisfaction. Code Green. 2008.