Review Article - Journal of Clinical Ophthalmology (2021) Volume 5, Issue 7
Visual acuity-DYOP® versus Snellen acuity charts: A review.
Peter Gordon*
Eye Physicians and Surgeons Clinic, Decatur, Georgia, United States
- Corresponding Author:
- Dr. Peter Gordon
Eye Physicians and Surgeons Clinic
Decatur, Georgia
United States
E-mail: petergordonmd@gmail.com
Accepted date: 07 January, 2022
Citation: Gordon P. Visual acuity-DYOP® versus Snellen acuity charts: A review. J Clin Ophthalmol. 2021;5(7):500-503.
Abstract
To compare the visual acuity of pre and post cataract surgery's patients using a Snellen acuity chart and DYOP acuity chart as to differences in resolution acuity versus recognition acuity.
Fifty-nine patients (105 eyes) with senile cataracts aged 40 years or older, and with no other ocular pathologies, were evaluated as to visual acuity for pre and post cataract surgery using the Snellen acuity and DYOP acuity charts.
Cataracts were nuclear in 50 eyes, nuclear and posterior sub capsular in 24 eyes, nuclear and cortical in 23 eyes, nuclear, cortical and posterior sub capsular in 4 eyes as well as nuclear, anterior and posterior sub cortical in 2 eyes, pre cataract surgery. The mean VA measured at pre cataract surgery was significantly overestimated with Snellen (OD: 0.64 ± 0.15, OS: 0.69 ± 0.23 decimal units) versus a DYOP (OD: 0.53 ± 0.25, OS: 0.55 ± 0.24 decimal units), for both eyes (OD: p=0.01, OS: p=0.01). The mean VA measured at post cataract surgery was also significantly overestimated with Snellen (OD: 0.88 ± 0.22, OS: 0.85 ± 0.20 decimal units) versus a DYOP (OD: 0.72 ± 0.22, OS: 0.72 ± 0.23 decimal units), for both eyes (OD: p=0.00, OS: p=0.01).
Visual acuity measurements for pre and post cataract surgery were different with a Snellen acuity chart and a DYOP acuity chart in that the DYOP test was a more precise indicator of acuity resolution. The apparent strength of the DYOP acuity assessment is that it utilizes Dynamic Resolution Acuity to prevent the 0.25 diopter overestimation of visual acuity inherent in the Static Recognition Acuity of the Snellen test.
Keywords
Visual acuity, Visual acuity charts, Age-related cataract, Cataract surgery, Visual impairment.
Introduction
Because the “real world” is dynamic, the ability to recognize a letter differs from a typical dynamic resolution task. Dynamic resolution tasks may include detecting a vehicle moving into the line of travel, or if that other vehicle has suddenly stopped. A vehicle moving at 60 miles per hour (96 km per hour) travels at 88 feet per second (27 meters per second). The typical stopping distance of such a vehicle on dry pavement at 60 mph is 180 feet (55 meters). A half second response delay brings that vehicle 44 feet closer to an obstacle. That delayed half second response could be the difference between hitting another vehicle at 60 mph, slowing to 30 mph or 10 mph, being able to swerve out of the way, or being able to totally stop in response to that vehicle. Avoiding a 60 mph collision could also mean the difference between life, and death, as determined by the driver’s dynamic visual responsiveness.
Considerable research has been done to evaluate the effect of cataract surgery on the restoration of vision due to the incidence of cataracts constituting 5% of blindness in Western Europe and approximately 50% in developing third world countries [2]. Traditional visual acuity in a clinical setting uses a Static Visual Acuity letter chart. However, we previously evaluated the comparison between the visual acuity assessed at pre and post cataract surgery using the Static Recognition Acuity of a Snellen acuity chart versus the Dynamic Resolution Acuity of a DYOP acuity chart which uses detecting the spin direction of a spinning segmented ring as a benchmark for include dynamic vision.
However, in the cited study, we evaluated the comparison between the visual acuity assessed at pre and post cataract surgery using the Static Recognition Acuity of a Snellen acuity chart versus the Dynamic Resolution Acuity of a DYOP acuity chart which uses detecting the spin direction of a spinning segmented ring as a benchmark for include dynamic vision.
Literature Review
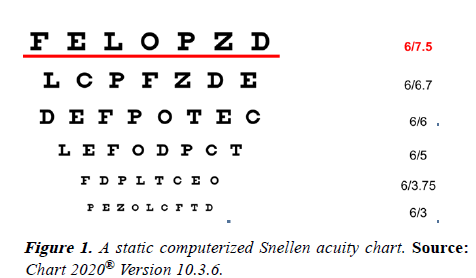
In 1862, Dr. Hermann Snellen created a Static Visual Acuity chart based on the recognition of European style letters (Figure 1). Since then the use of the Snellen test has become the global standard for measurement of Visual Acuity (VA) in clinical practice because of its accessibility and easy and quick procedure in assessing literate patients. Snellen acuity charts, as the most common chart in the world, typically have a big letter on top with the number of letters per line increasing, and letter size decreasing, from the top to the bottom of the chart. However, it has also been established that the combination of an irregular progression of letter sizes down the chart, the differing number of letters comprising each chart line, and the mixed relative legibility of the chosen letters together compromise the accuracy of conventional VA determination [3]. The typical test circumstances also prohibit statistical analysis of VA data [4].
The use of static optotypes is the conventional and standard function test of patients with cataracts based on common optical and physiological parameters [5]. However, visual acuity also depends on additional factors such as luminance, contrast, spectral distribution, age, and visual adaptation. While simple static acuity measurement can reveal many visual disorders, visual acuity is also a dynamic process rather than a static process.
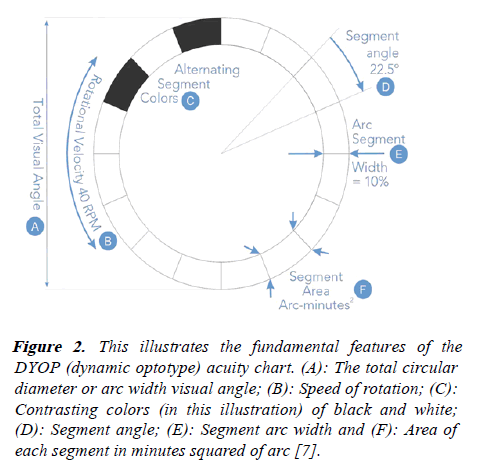
In 2008, Allan Hytowitz invented a dynamic optotype, or DYOP® using Dynamic Visual Acuity in the form of a uniformly spinning segmented ring which creates a binary strobic stimulus of the photoreceptors (Figure 2) [6].
Figure 2: This illustrates the fundamental features of the DYOP (dynamic optotype) acuity chart. (A): The total circular diameter or arc width visual angle; (B): Speed of rotation; (C): Contrasting colors (in this illustration) of black and white; (D): Segment angle; (E): Segment arc width and (F): Area of each segment in minutes squared of arc [7].
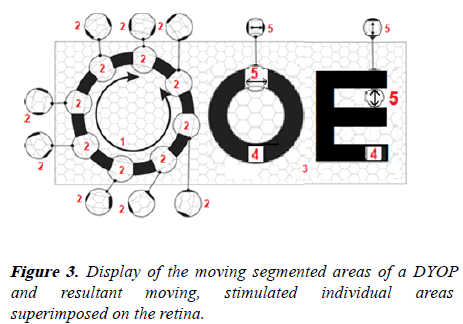
The design of a DYOP visual target combines the angular arc width diameter, segment stroke width, rotation speed (rotations per minute), segment contrast, segment color and the pixelized strobic photoreceptor refresh rate of the spinning segmented ring to create an acuity threshold as the minimum angular arc width of the optotype as an indicator for visual acuity and the functional parameters for determining perception and refractions (Figure 3). The DYOP acuity chart typically, and optimally, uses a circular segmented ring comprised of 8 black and 8 white equally sized alternating segments on a neutral gray background. The optimum DYOP as the equivalent of 20/20 (6/6) acuity has a 10% stroke width, a 40 RPN rotation rate, and a 7.6 arc minute angular width diameter.
Item 1: The visual angular movement/velocity for the strobic contrast response (40 RPM optimum) with a 0.33 arc minute squared per second refresh rate.
Item 2: The moving segmented 0.54 arc minute squared Minimum Area of Resonance (MAR) for dynamically stimulating a 20 photoreceptor cluster.
Item 3: Retinal photoreceptor cell clusters.
Item 4: Examples of a historic STATIC Recognition or Resolution acuity optotype.
Item 5: The static 1.0 arc minute squared Minimum of Resolution (MAR) of a 40 retina photoreceptor cluster for a historic static optotype.
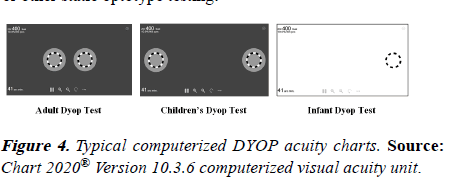
The DYOP mechanism of visual acuity assessment and refractions is a physiological response based on the strobic stimulus provided by the movement of the DYOP gaps rather than the cultural cognition of static letters. In addition to adult testing, the revised DYOP test can be used as an acuity test for children, infants, illiterates (Figure 4), and non-verbal as well as literate individuals. Additionally, the current DYOP format uses a bracketing algorithm rather than the traditional sequential optotype sizing format. The result of the algorithm is a significant increase in efficiently permitting a DYOP test to typically take 10 to 20 seconds per eye for acuity measurement and 60 to 90 seconds per eye for refraction, which is about one-third the typical time for subjective Snellen or other static optotype testing.
When there are two DYOPs displayed, the DYOP test methodology is to have the subject verbalize whether the left or right DYOP is spinning, and whether that spinning DYOP is spinning clockwise or counterclockwise. At a sub-acuity DYOP diameter, the subject will not be able to detect the spin direction of the spinning DYOP. The revised Children’s Test and the new Infant Test both also use preferential looking as to head and eye motions to determine the acuity endpoint. At a sub-acuity DYOP diameter, a non-verbal subject will not be able to detect the DYOP as spinning and will tend to look elsewhere rather than at the DYOP display. Preferential looking also minimizes the need for the subject to verbalize the clockwise or counterclockwise spin of a DYOP.
What enables DYOP functionality is the Dynamic Visual Acuity as provided by the vibratory motion of the visual saccades to refresh the responsiveness of the photoreceptors. The photoreceptors, located in the back of the retina, function much as the pixels of the scanning lines of an electronic display. That saccade induced photoreceptor refresh in turn allows the neurons on the inner surface of the retina to act as the equivalent of a biological circuit board. The retina neural ganglia combine the photoreceptor stimulus to send a signal to the brain via the optic nerve fibers. The DYOP combines both Resolution Acuity and Resonance Acuity where the DYOP gaps resonate with the saccade-induced photoreceptor refresh rate. The refraction process also creates distinct color focal depths which allow the photoreceptors to use the constantly changing chromatic triangulation of the blue, green, and red focal depths to regulate acuity.
The optimum empirically determined DYOP stimulus gap (0.54 arc minutes squared as the Minimum Area of Resolution- MAR) is also half of the stimulus area of the calculated Snellen/Sloan stimulus gap (MAR of 1.00 arc minutes squared). This smaller DYOP stimulus is advantageous as to contributing to the increased DYOP precision, the increased speed at which the threshold of the acuity endpoint is defined, the finer acuity granularity of DYOP testing as compared to the typical acuity “line” steps, the ease of endpoint identification by subjects, and the improved ease of measuring Low Vision due to the smaller linear increase in the ratio of the DYOP diameter to diopters of blur.
A paired T test showed a significant 0.25 diopter overestimation in visual acuity with the Snellen acuity chart (for both pre cataract surgery and post cataract surgery) versus the DYOP acuity chart. This comparison is in line with the study by Harris and Keim assessing the threshold acuities of Sloan letters versus a DYOP doublet where the Snellen test had an acuity overestimation of 0.25 diopters to 0.50 diopters [8]. The explanation seems to be that irregular static Sloan letters tend to deplete the response of the photoreceptors and thus induce a compensatory overminus response. The strobic stimulus of the DYOP gaps/segments resonates with the saccade induced refresh of the photoreceptors and thus minimizes the potential for an overminused response.
Independent research by Dr. Isaac Sanni showed the same 0.25 refraction overminus for the Snellen chart versus the DYOP chart [9].
Discussion
An increase in cataract severity is strongly associated with a decrease in visual acuity in the sufferers. A more precise measure of visual acuity assessment in patients with cataracts could help in the objective estimation of the need for cataract surgery prior to surgery, and also assess the level of vision restoration post cataract surgery [10].
In the assessment the mean visual acuity for both eyes with pre cataract surgery with a Snellen chart (Static Recognition Acuity) improved significantly for post cataract surgery. Similarly, the mean visual acuity for both eyes for pre cataract surgery with a DYOP chart (Dynamic Resolution Acuity) improved significantly for post cataract surgery.
A simple secondary validation of a Snellen induced overminus may be easily determined by having the patient move their eyeglasses forward about a half inch (1 cm) to one inch (2 cm) from their eyes to increase the plus and reduce the optical minus of the lenses. Regardless of the viewing distance and the refraction, if the image becomes more legible and clearer, the improved clarity and legibility would indicate that the current refraction is actually overminused and potentially would reduce cognition.
Also available due to the attributes of Dynamic Visual Acuity is a free online 40 second DYOP test for visual impairment (which was originally created to detect marijuana intoxication). Since cataracts primarily occur in older patients, having a test for visual impairment is also an extremely helpful tool both for the clinician and the patient.
See www.visual-impairment.org or https://www.DYOP.info/ documents/DYOP_Visual-Impairment_Test-x10.swf.html. This screening test should also be useful for detecting age related visual impairment, sports concussion injuries, and PTSD.
Additionally, there is available a free online DYOP color screening test for detecting potential symptoms of dyslexia, migraines, and epilepsy [11].
Conclusion
Conclusively, there was significant improvement in the visual acuity assessed post cataract surgery as compared to the initial visual acuity assessment done pre cataract surgery, using the two charts. However, it was realized that there was a significant 0.25 diopter overestimation of visual acuity by the Snellen’s acuity as compared to the DYOP acuity assessment, likely due to the photoreceptor depletion response associated with static optotypes, with the DYOP test being more precise and with less variance. Recent DYOP methodology revision has also increased the DYOP test efficiency to become up to three times as efficient for acuity (10 to 20 seconds per eye) and refraction (30 to 60 seconds per eye) than Snellen testing.
Recommendations
• Further studies with larger sample size, should be done to establish a better evaluation of the two charts (DYOP versus Snellen) as to visual acuity assessment of cataractous eyes, pre and post-surgery.
• Further studies should be done to compare the DYOP test acuity and refraction efficiencies versus Snellen testing.
• Further studies should be done to compare the DYOP/ Snellen acuity charts with driving simulation testing in pre and post cataract surgery as to visual acuity assessment
• Further studies should be done with the DYOP test for visual impairment to detect possible deficiencies.
References
- Gordon P, Brewer K. Visual acuity assessment with a DYOP versus a Snellen acuity chart for pre and post-cataract surgery. Optom Vis Perf. 2021; 9:106-14.
- World Health Organization. Global Initiative for the Elimination of Avoidable Blindness: Action plan 2006-2011. 2007.
- Becker RC, Graef MH. Comparison of Landolt-C and Snellen E-Acuity in strabismus amblyopia. Inves Ophthalmol Vis Sci. 2006; 47:2454.
- Elliot DB, Hurst MA, Weatherill J. Comparing clinical tests of visual function in cataract with the patient’s perceived visual disability. Eye. 1990; 4:712-17.
- Wild JM, Hussey MK. Some statistical concepts in the analysis of vision and visual acuity. Ophthal Physiol Opt. 1985; 5:63-71.
- Hytowitz A. A new measure of vision performance. 2011.
- Hytowitz A. DYOP User Guide, GA, USA: DYOP Vision Associates LLC. 2019.
- Harris PA, Keim E. Validation of the DYOP Visual acuity test. Invest Ophthalmol Vis Sci. 2015; 56: 3888.
- Sanni. Subjective comparison between DYOP and Snellen refractions. Optom Vis Perf. 2020; 8:202-13.
- Rubin GS, Adamsons IA, Stark WJ. Comparison of acuity, contrast sensitivity, and disability glare before and after cataract surgery. Arch Ophthalmol. 1993; 111:56-61.
- Stark S. A Comparison of DYOP color perception and dyslexia diagnosis. Optom Vis Perf. 2020; 8:176-90.


