Research Article - Journal of Finance and Marketing (2018) Volume 2, Issue 1
Rice supply chain using lindo method at serang city, banten, indonesia
Aliudin*, Setiawan Sariyoga, Septian Tirta Cahyadi
Lecturer Departement of Agribusiness, Faculty of Agriculture, Indonesia
- *Corresponding Author:
- MP Aliudin
Universitas Sultan Ageng Tirtayasa Serang
Banten Indonesia
Tel: + 0254 280330
E-mail: alicardan@yahoo.com
Accepted date: January 20, 2018
Citation: Aliudin, Sariyoga S, Cahyadi st. Rice supply chain using lindo method at serang city, banten, indonesia. J Fin Mark. 2018;2(1):19-27.
DOI: 10.35841/finance-marketing.2.1.19-27
Visit for more related articles at Journal of Finance and MarketingAbstract
This research uses descriptive analysis method. The descriptive method of analysis is
strengthened by observation and survey. This research uses non probability sampling sampling
method, that is judgment sampling. The sampling technique was chosen to obtain sampling units
that had the desired characteristics and snowball sampling aimed to determine the information
of the respondents. Data analysis techniques using Linear Interactive and Discrete Optimize
(LINDO). Linear Interactive and Discrete Optimizer is an interactive programming package
of linear, quadratic and integral programs. The results showed that : Based on the calculation
of sensitivity analysis using LINDO, the allocation of rice from the sender to RTC Market,
wholesalers in Market of Lama, big trader of Kec Cipocok and big traders of Kec Walantaka
will not experience any change in allocations even though the costs required to supply rice have
increased, The highest coefficient on the LINDO result is in variable X2,9 of Rp. 400, - with the
aim of supply, a wholesaler of RTC Market - the retailer of Serang District. The lowest coefficient
is in variable X4,15 of Rp. 93, - occurred at the destination supply of large traders Cipocok
District - retailer Cipocok
Keywords
Supply chain, Lindo, Wholeselers, Retailers.
Introduction
Serang city is an area of the city with very fast economic growth compared to other regions. Like other cities in Indonesia, to achieve these economic growth are many challenges that must be faced. The most important challenge is the change of paradigm that is the increase and growth of the population which is not only caused by the fertility rate but also due to immigration [1].Growth and development of the population is causing development problems such as land conversion which has other implications for food availability. The development followed by steady economic growth that can increase the purchasing power of the community there is a tendency not to have direct implications on the availability of food, but on the contrary development that is not followed by steady economic growth cannot increase people's purchasing power and has implications directly to the welfare of society. (Table 1).
| No. | Commodity | Description | |||||||
|---|---|---|---|---|---|---|---|---|---|
| Procurement (ton) | |||||||||
| First stock | Local Product | Outside the Region | Import | Total | Demand | Distribution of other areas | Final Stock | ||
| 1 | Rice | 690 | 360 | 1030 | 200 | 2230 | 1560 | 1360 | 740 |
| 2 | Heat flour | 1150 | 0 | 1280 | 0 | 2430 | 1795 | 1795 | 660 |
| 3 | Vegetable oil | 595 | 0 | 1910 | 0 | 2505 | 2100 | 2100 | 370 |
| 4 | Salt | 45 | 22 | 102 | 0 | 169 | 120 | 120 | 50 |
| 5 | Sugars | 451 | 88 | 1280 | 26 | 1827 | 1415 | 1415 | 469 |
| 6 | fuel oil | 0 | 0 | 0 | 0 | 0 | 0 | 0 | 0 |
| 7 | Chicken meat | 340 | 380 | 230 | 0 | 950 | 630 | 630 | 340 |
| 8 | Chicken Egg Race | 429 | 178 | 365 | 0 | 972 | 569 | 569 | 432 |
| 9 | Meat | 26 | 48 | 136 | 0 | 210 | 177 | 175 | 26 |
| 10 | Soy Beans | 24 | 3 | 50 | 45 | 109 | 83 | 83 | 24 |
| 11 | Peanuts | 34 | 25 | 0 | 41 | 86 | 57 | 57 | 28 |
| 12 | Green beans | 20 | 10 | 60 | 0 | 90 | 73 | 73 | 18 |
| 13 | onion | 48 | 0 | 104 | 0 | 152 | 106 | 106 | 48 |
| 14 | Garlic | 24 | 0 | 0 | 83 | 107 | 81 | 76 | 25 |
| 15 | Potato | 23 | 0 | 61 | 0 | 84 | 58 | 58 | 25 |
| 16 | Red chili | 26 | 0 | 105 | 0 | 131 | 118 | 100 | 13 |
| 17 | Corn | 6 | 0 | 15 | 0 | 21 | 15 | 15 | 7 |
| 18 | Salted fish | 4 | 0 | 13 | 0 | 17 | 9,5 | 9,5 | 6,5 |
| 19 | Carrot | 3,5 | 0 | 14,5 | 0 | 18 | 16,5 | 11,5 | 1,5 |
| 20 | Vegetable beans | 5 | 0 | 9,5 | 0 | 14,5 | 8 | 8 | 7 |
| 21 | Vegetable Cabage | 3,5 | 0 | 15,5 | 0 | 19 | 15,5 | 15,5 | 3,5 |
Table 1. Food stocks and distribution in Serang city.
The food supply in Serang City is more supplied from outside the region. Analyzing the supply is inseparable from the role of distribution to meet the needs of more evenly distributed food, the distribution that tends to be less effective causes the community difficult to get the staple food because of the uneven effects of distribution that will lead to food scarcity. Food scarcity can cause food prices to increase and result in decreased purchasing power of people to food [2]. Serang city has a fairly competitive agricultural potential, seen from the production of food is quite large, concerning the problem of food security there are 3 aspects to note 1) consumption, 2) Distribution and 3) the availability of food. Of the three aspects of distribution is a very important aspect in meeting the availability and food consumption of a region, along with the development of reduced production that causes food scarcity it is due to the allocation of distribution and a combination of agricultural marketing is less balanced [3].
Material and Methods
This research uses descriptive analysis method. The descriptive method of analysis is strengthened by observation and survey. This research uses non probability sampling method that is judgment sampling. The sampling technique was chosen to obtain sampling units that had the desired characteristics and snowball sampling aimed to determine the information of the respondents. Data analysis techniques using Linear Interactive and Discrete Optimize (LINDO). Linear Interactive and Discrete Optimizer is an interactive programming package of linear, quadratic and integral programs. Linear Programming which has been expressed in the purpose function and constraints. [4]. This study also uses descriptive analysis techniques [5,6]. The purpose of this analysis is to describe the nature of a situation that is temporarily running at the time of the study, and to examine the causes of certain symptoms [7].Supply chain operations reference model Version 5.0 was Used [8]Analysis of food supply chain efficiency is done by using this commodity marketing efficiency approach [9]. The indicator used to know marketing efficiency in this research is by using marketing margin and allocation of food supply based on cost calculation by marketing institution [9-11]. Marketing efficiency uses an operational efficiency approach as measured by comparing marketing output to marketing inputs [12,13]. Formulation The marketing margin is as follows:
Mi = Pri – Pfi Mi = Ci + πi where
Mi : marketing margin at the level of the i marketing agency
Pri: the selling price at the level of the i
Pri: the selling price at the level of the i
Ci : marketing costs at the level of i marketing agency
πi : profit of the i-level marketing agency
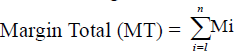
The total margin is calculated using the following formula :
The profit-to-cost ratio is calculated using formula = {πi / (Pfi + Ci)} * 100%
Pfi: the purchase price at the level of i marketing agency
Ci : marketing costs at the level of i marketing agency
πi: profit of the i-level marketing agency.
Efficiency is measured by comparing total transport costs based on current rice allocations with total transport costs based on optimal allocations.
Result and Discussion
Activity of Rice Supply Chain Marketing Institution
Importir (Inter-Territory traders) buy rice from farmers or from rice-gatherers. In general, Importir buy rice in the form of unhulled rice and perform further processing such as drying, grinding, packaging and branding. And than rice packaging is sold to wholesalers and retailers. Shipping and transportation of rice according to order. The table below shows the activity of rice marketing agencies in Serang City, Indonesia. Wholeseler buy rice from Importir (Inter- Territory traders) in sack packets, one sack of 20 kg - 25 kg of rice. Retailers also sell directly to household consumers. The following activities of primary supply chain members in Serang City are presented in Table. Large traders store rice in warehouses, Retailer does not store [14]. (Table 2).
| Aktivity | Rice Supply Chain Agency | ||
|---|---|---|---|
| Importir (Inter-Territory traders) | Wholesellers | Retailer | |
| Marketing | |||
| • Sales | + | + | - |
| • Purchase | + | + | - |
| Transportation and packaging | |||
| • Transportation | + | + | +/- |
| • Packaging | + | - | - |
| • Storage | + | + | - |
| Facilities | |||
| •Sortation | + | - | - |
| •Grading | + | - | - |
Table 2. Activity of rice marketing agency on rice supply chain in Serang city.
(+) activity, (-) no activity, (+/-) activity and no activity
Supply chain
Rice supply in Serang City area starts from Importir (Inter-Territory traders) because this institution is supplying rice to wholesalers directly from their respective regions. At Wholesalers already have a fixed supplier. Some wholesalers receive supplies from some Importer (Inter-Territory traders). The amount of rice supplied by Importer (Inter-Territory traders) is adjusted to the market situation and the interest of the household consumers in accordance with the estimates of the wholesalers. Importer (Inter-Territory traders) supplying rice to Serang City comes from rice production centers, namely: Pontang, The pattern of rice supply flow in Serang city generally can be seen in figure. Serang City there are four patterns of rice supply channels, for the pattern 1 is often found in every district in the area of Serang City. Pattern 2 reference Rau trade center. Pattern 3 with reference Importir (Inter-Territory traders). As for the pattern of 4 markets reference traders. Retailers buy rice from wholesalers both from within and outside the region. The price of rice varies among traders [15]. Most household consumers like the second type of rice, because the quality of rice is quite good. Rice with second quality average purchase price at the wholesale level is IDR. 8,330.00 per kg. Furthermore, the rice used in the average restaurant industry uses rice with the quality of the second and third (karya muda and rojolele, ramos). The price of rice based on quality can be seen in Table 3. (Table 3). Transportation on rice supply chain in Serang City is transportation from rice producers, to wholesalers and to consumers. Transportation in question is the transportation between traders and between areas within the city of Serang. Transportation facilities using trucks with a capacity of 1000- 5000 kg. Rice transport from wholesalers to retailers in the market area using human labor. At the level of large retailers transport is financed by the seller, while at the retailer level the transportation costs are paid by the wholesalers. The stock of rice at the wholesalers is stored in the warehouse in the store it owns. There are also rice traders who store rice at retail stores (trading partners). (Figure 1-4).
| Quality of rice | Price of sale (IDR) | Price at the retailers reseller level (IDR) | Price at the consumers reseller level (IDR) |
|---|---|---|---|
| Lonceng | 8.850 | 8.950 | 9.050 |
| Karya Muda | 8.230 | 8.330 | 8.430 |
| Ramos | 7.300 | 7.400 | 7.500 |
| Walet | 7.000 | 7.100 | 7.200 |
| Rojolele | 6.875 | 6.975 | 7.100 |
Table 3.The price of rice based on quality (IDR /Kg).

Figure 1. First pattern in rice supply chain at Serang city, Banten, Indonesia.

Figure 2.Second pattern in rice supply chain at Serang city, Banten, Indonesia..

Figure 3.Third pattern in rice supply chain at Serang city, Banten, Indonesia.

Figure 4.Fourth pattern in rice supply chain at Serang city, Banten, Indonesia.
Rice Distribution Chain
The Wholesalers in Serang City get rice supply from Pontang, Padarincang, Malingping, Kasemen, Karawang, Kediri (East Java), Sawah Luhur, Lampung, and Cianjur. The supply amounts to 1,381,750 kg per month. Distribution to the markets in Serang City area is 1,339,250 kg per month. Distribution to out of Serang City area 35.000 kg per month. The supply of rice out area of Serang City is 2.62%. The rest of the presentation is 96.82% marketed in the market in Serang City Region. Chain of Rice Distribution can be seen in Figure 3.
The supply of rice in Serang City through two ways is directly sent by the sender or supplier and some are bought directly by big traders in Serang City. Rice entering Serang City, not all of them are sold in Serang City market and outside Serang City area, but there are also some big traders supplying rice to the restaurant industry its volume is 7,500 kg per month. Table 4 shows the details of the needs of Restaurant Industry in Serang City [16,13]. (Table 4).
| Channel Type | 1 | 2 | 7 | 8 | 9 | 10 | |||
|---|---|---|---|---|---|---|---|---|---|
| Source of Supply | Supplier | ||||||||
| Goal Market | RTC | RTC | Market of Lama | Market of Cipocok | Market of Walantaka | Market of Konsumen | |||
| First purchase price | 7.800 | 6.700 | 7.500 | 8.000 | 7.200 | 8.000 | |||
| Last sale price | 8.200 | 7.200 | 8.500 | 8.500 | 8.200 | 9.000 | |||
| Total Cost | 111 | 111 | 162 | 17 | 36 | 263 | |||
| Total profit | 289 | 389 | 838 | 497 | 904 | 737 | |||
| Total margin | 400 | 500 | 1.000 | 500 | 200 | 1.000 | |||
Table 4. Total cost, total profit dan total margin of Chanel market type 1, 2, 7, 8, 9, 10 in IDR/kg.
Inventory control is simply done by senders, wholesalers and retailers. The system of buying rice at retailers from inside and outside Serang City through wholesalers. The payment system is made in cash. Rice is a staple food, increasing demand is directly proportional to the population. This condition is one factor that causes the price of rice to fluctuate over time. Figure 5.

Figure 5.Chain of rice distribution.
Inventory control cannot be separated from the storage process. Storage is one way of maintaining product quality, extending its usefulness, avoiding the flood of products to the market at the time of its abundant production and maintaining the sustainability of marketing, so as to control the price of rice. Wholesalers in Serang city besides playing a role besides as a wholesaler, retailers also acts as a retailer. The rice supply channel in Serang City can be seen in Figure 6.

Figure 6.The rice supply channel in Serang city.
Marketing margin analysis on the supply channel uses the assumption that the rice delivered comes from the sender and not the supply of supply in Serang City. The marketing costs of each marketing agency vary. Marketing costs at the merchant level include transportation costs, loading and unloading costs, depreciation costs, labor costs, cleaning service costs, electricity costs and store rental fees. At the Wholesalers level, marketing costs include transportation costs and depreciation charges. Table 4 and Table 5 below show the results of cost calculations, profits and total marketing margins for each marketing channel. Detailed results of marketing margin calculation, cost and profit can be seen in Appendix 1.
Based on Table 4, the smallest margin occurs on the Ninth marketing channel. Its Rp. 200. While the largest margin occurs on the tenth channel with a total margin of Rp 1000.
| Channel Type | 3 | 4 |
|---|---|---|
| Source of Supply | Supplier | |
| Goal Market | RTC | RTC |
| First purchase price | 8.000 | 8.600 |
| Last sale price | 8.500 | 9.500 |
| Total Cost | 119 | 125 |
| Total Profit | 381 | 722 |
| Total margin | 500 | 900 |
Tabel 5. Total cost, total profit dan total margin of Chanel market type 3 and 4 in IDR/Kg.
The third and fourth marketing channels with the smallest RTC destination market margin Rp. 500 and the largest margin of Rp. 900. (Table 5).
Transportation Model
Decision Variables
Wholesaler in Serang City supply rice from several regions: Karawang, Kediri (East Java), Pontang, Ciomas, Padarincang, Malimping, Kasemen, Lampung. Rice supply in Serang City comes from Wholesaler in Serang city such as: Serang Sub-district, Cipocok Sub-district, Kasemen Sub- District, Walantaka Sub-district. Rice from big traders is distributed to each retailer in all subdistricts in Serang City. In RTT Main Market there are many Wholesaler who supply their rice outside Serang City area. (Figure 7).

Figure 7.Rice supply chain in Serang city.
1. Suppliers, 2. Wholesaler Market of Induk RTC, 3. Wholesaler Market of Lama, 4. Wholesaler Kec. Cipocok, 5. Wholesaler Kec. Walantaka, 6. Wholesaler Kec. Kasemen, 7. Retalilers Kec. Curug, 8. Retalilers Kec .Taktakan, 9. Retailers Kec. Serang, 10. Wholesaler Market of Induk RTC, 11. Wholesaler Market of Lama, 12. Wholesaler Market of Cilegon, 13. Wholesaler Market of Merak, 14. Wholesaler Market of Kec. Serang, 15. Retalilers Kec. Cipocok, 16.Retalilers Kec. Walantaka, 17. Retalilers Kec. Kasemen
Decision variable is the amount of rice allocation from each rice supplier to all wholesalers in Serang City based on rice supply chain flow in Serang City. Merchant retailer Kec. Taktakan and merchant retailer Kec. Curug has been supplying rice from wholesalers in the RTC Market and Suppliers from the Ciomas region so that the allocations are not altered and not included in decision variables. The rice supply flow scheme can be seen in Figure. The decision variable chosen is the variable of the supply amount in each destination market in Serang City that comes from the rice supplier so it can know the amount of rice needed. The variables of the sought decision are presented in Table 6.
| Symbol | The decision variable |
|---|---|
| X1,2 | Total of supply from shipper to wholesaler in RTC |
| X1,3 | Total of supply from shipper to wholesaler in Market Lama |
| X1,4 | Total of supply from shipper to wholesaler in Cipocok Jaya |
| X1,5 | Total of supply from shipper to wholesaler in Walantaka |
| X1,6 | Total of supply from shipper to merchant in Kasemen |
| X1,7 | The supply amount from the sender to the retailer in Curug |
| X2,8 | Total supply from major traders P.I. RTC to retailer in Kec. Taktakan |
| X2,9 | Total supply from wholesaler in P.I.RTC to Retailer in Serang City |
| X2,10 | Total supply from major traders P.I.RTC to Large Traders P.I.RTC |
| X2,11 | Total supply from Wholesaler in P.I.RTC to wholesalers in Market of lama |
| X2,12 | Total supply from Wholesaler traders P.I.RTC to wholesalers in Cilegon |
| X2,13 | Total supply from Wholesaler P.I.RTC to wholesaler in Merak |
| X3,14 | Total of supply from wholesalers of Market of Lama to retailers in Kec. Serang |
| X4,15 | Total supply from wholesalers in Kec. Cipocoi to a retailer in Kec. Cipocok |
| X5,16 | Total supply from wholesalers in Kec. Walantaka to retailers in Kec. Walantaka |
| X6,17 | Total supply from wholesalers in Kec. Kasemen to retailer in Kec. Kasemen |
Table 6. The decision variable.
Variable constraints
The constraints in the model are the amount of rice supply from each source and the amount of rice needed in each market. The values are assumed to be fixed, in accordance with the results of interviews with traders. The formulation of the constraints is as follows:
a. Constraint of rice supply for Serang City

b. Constraints on the supply of rice from RTC

c. Constraints on the supply of rice that is not absorbed by retailers in Kec. Taktakan at RTC
d. Constraints on the supply of rice that is not absorbed by Wholesalers RTC, Market of lama, Cilegon and Cipocok
e. Constraints Amount of rice supply not absorbed by retailers Kec. Serang on the Market of lama

f. Constraints on the supply of rice that is not absorbed by retailers Kec.

g. Constraints on the supply of rice that is not absorbed by retailers in Kec.walantaka

h. Constraints on the supply of rice that is not absorbed by retailers in Kec. Kasemen
i. Constraint of positive value (amount of supply / requirement Rice more than 0)

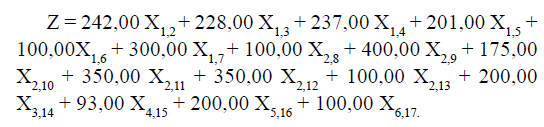
Objective Function
The purpose of model making is to find the optimal allocation which minimize total cost which include transportation cost, depreciation cost and supply price of rice to Serang City. The optimal allocation model is formulated as follows:
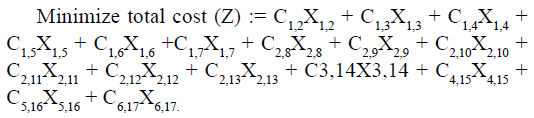
Where Z = Total Cost, Ci = Cost per kg of rice from source i to destination j.
Constraint Model
• The model of supply constraints for Serang City is 1,655,750 kg per month from rice supplier sources. X1,2 + X1,3 + X1,4 + X1,5 + X1,6 + X1,7 = 1.655.750
• The model of supply constraints for Serang City is 1,655,750 kg per month from rice supplier sources. X1,2 + X1,3 + X1,4 + X1,5 + X1,6 + X1,7 = 1.655.750
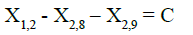
• Model Constraints on the supply of rice not absorbed by retailers Kec. Taktakan and Resk Kec.Serang in RTC Market as much as 4250 kg per month. X2,8 – X2,9 = 4250
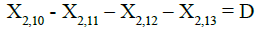
• Constraints on the supply of rice that is not absorbed by big traders P.I.RTC, Old Market, Cilegon and Merak. The amount of rice supply that is not absorbed by Wholesalers RTC, Market of Lama, Cilegon and Merak in RTC of Market is the supply of rice absorbed by retailers of Kec.Serang, Retailers in Kec. Taktakan and the amount of supplies used by the restaurant industries that is 61.000 kg per month. X2,10 – X2,11 – X2,12 – X2,13 = 61.000
• Constraints on the supply of rice that is not absorbed by big traders P.I.RTC, Old Market, Cilegon and Merak. The amount of rice supply that is not absorbed by Wholesalers RTC, Market of Lama, Cilegon and Merak in RTC of Market is the supply of rice absorbed by retailers of Kec.Serang, Retailers in Kec. Taktakan and the amount of supplies used by the restaurant industries that is 61.000 kg per month. X2,10 – X2,11 – X2,12 – X2,13 = 61.000
• Model Constraints on the supply of rice that is not absorbed by retailers in Kec. Cipocok and in Wholesalers Kec. Cipocok as much as 2250 kg per month. X4,15 = 2250
• Model Constraints on the supply of rice that is not absorbed by retailers in Kec. Cipocok and in Wholesalers Kec. Cipocok as much as 2250 kg per month. X4,15 = 2250
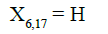
• Constraints on the supply of rice that is not absorbed by retailers in Kec. Kasemen in Large Traders Kec. Kasemen as much as 4000 kg per month. X6 17 = 4000. (Table 7).
| Symbol | Source | Objective | Cij (Rp/kg) |
|---|---|---|---|
| X1,2 | Pengirim (i=1) |
Wholesalers Market of RTC (j=2) | 242 |
| X1,3 | Wholesalers Market of Lama (j=3) | 228 | |
| X1,4 | Wholesaler Kec. Cp (j=4) | 237 | |
| X1,5 | Wholesaler Kec. Wn (j=5) | 201 | |
| X1,6 | Wholesaler Kec. Kn (j=6) | 100 | |
| X1,7 | Wholesaler Kec. Cg (j=7) | 300 | |
| X2,8 | Market of RTC (i=2 ) |
Wholesaler Kec. Tn (j=8) | 100 |
| X2,9 | Retailers Kec. Srg (j=9) | 400 | |
| X2,10 | Wholesalers P.I.RTC(j=10) | 175 | |
| X2,11 | Wholesaler Market of Lama (j=11) | 350 | |
| X2,12 | Wholesaler Cn (j=12) | 350 | |
| X2,13 | Wholesaler Merak (j=13) | 100 | |
| X3,14 | Wholesaler Market of Lama (i=3) | Retalilers kec. Serang (j=14) | 200 |
| X4,15 | Wholesaler Kec. Cp (i=4) | Retailers Kec. Cp (j=15) | 93 |
| X5,16 | Wholesaler Kec. Wn. Wn (i=5) | Retailers Kec. Wn (j=16) | 200 |
| X6,17 | Wholesaler Kec. Kn (i=6) | Retailers Kec. Kn (j=17) | 100 |
Table 7. Supply cost from each source to any destination (Cij).
• Constraints on the supply of rice that is not absorbed by retailers in Kec. Kasemen in Large Traders Kec. Kasemen as much as 4000 kg per month. X6 17 = 4000. (Table 7).
Model Analysis
To obtain the completion of the transshipment model that has been made, the calculation process is done with the help of LINDO device. The objective function model in terms of mathematical equations and constraint equations is included in the LINDO program. The result of solving equations using the help of LINDO produces an output of the optimal value of the decision variable sought. Value of decision variables optimization results presented in Table 4[17]. Based on these results, the minimum supply costs obtained if each month Kec. Kasemen gets rice supply from sender of 1,655,750 kg per month and supply of retailers in Kec. Taktakan get optimum supply of 4,200 kg per month. Wholesalers of RTC Market for the optimum amount in supplying rice to big traders in the RTC of Market as much as 503,375 kg per month and the optimum supply of 443,275 kg per month if Wholesalers of market of RTC send rice to Merak Market . (Table 8).
| Symbol | Decision Variables | Value |
|---|---|---|
| X1,2 | Total supply from supplier to wholesaler in P. I. RTC | 0 |
| X1,3 | Total supply from supplier to wholesaler in P. Lama | 0 |
| X1,4 | Total supply from supplier to wholesaler in Kec. Cp | 0 |
| X1,5 | Total supply from supplier to wholesaler in Kec. Wn | 0 |
| X1,6 | Total supply from suppliers to wholesalers in Kec. Kn | 1655750 |
| X1,7 | Total supply from supplier to retailer at Kec. Cg | 0 |
| X2,8 | Total supply from big traders P.I. RTC to p. porer in Kec. Tn | 4200 |
| X2,9 | Total supply from large pedestal P.I.RTC to p. retailer in Kec. Srg | 0 |
| X2,10 | Total supply from major traders of P.I.RTC to major P.I.RTC | 503375 |
| X2,11 | Total supply from major traders P.I.RTC to p. great at Market Of Lama | 0 |
| X2,12 | Total supply from P.I.RTC wholesalers to wholesalers in Cilegon | 0 |
| X2,13 | Total supply from P.I.RTC wholesalers to merchants in Merak | 443275 |
| X3,14 | Total supply from LM traders to retailers in Kec. Serang | 3000 |
| X4,15 | Total supply from wholesalers in Kec. Match it to a retailer in Kec. Cipocok | 2250 |
| X5,16 | Total supply from wholesalers in Kec. Walantaka to retailers in Kec. Walantaka | 500 |
| X6,17 | Total supply from wholesalers in Kec. Kasemen to retailer in Kec. Kasemen | 4000 |
Table 8. Optimal value decision variables (Kg).
The optimum allocation of LINDO calculation result is different from the result of rice allocation calculation that has been going on. The cost of supply for allocations that have been going on is Rp. 367,773,150 while the cost required for the allocation of optimization results of Rp. 299,362,375 per month. With the change in accordance with the allocation of output LINDO, obtained the cost minimization of Rp.68.410.775 per month. Thus, the supply of rice with the allocation according to LINDO calculation results will be more efficient because it will reduce the cost of supply. The calculation of optimal allocation is done based on the assumptions from the data obtained by the researcher. Sensitivity analysis or sensitivity analysis is an analysis conducted to determine the effect or effect of changes that occur on linear programming parameters to the optimal solution that has been achieved. Sensitivity analysis has a sensitivity interval that can show the changes that occur in the optimization results. The sensitivity interval consists of an allowable decrease and an allowable increase [18].
Table 4 presents the results of sensitivity analysis using LINDO devices. It also presents the limits of changes in the coefficients of the objective function. The objective function coefficient shows the cost of supply consisting of shipping costs, depreciation costs and the price incurred per kg of rice from each source and destination. The results of the sensitivity analysis indicate the extent to which changes in the cost per kg of rice can occur without changing the allocation of rice that minimizes the cost of supply. (Table 9).
| Variable | Limits of changes in Goal Function Coefficients | ||
|---|---|---|---|
| Current Koef | Allowable Increase | Allowable Decrease | |
| X1,2 | 242 | Unlimited | 142 |
| X1,3 | 228 | Unlimited | 128 |
| X1,4 | 237 | Unlimited | 137 |
| X1,5 | 201 | Unlimited | 101 |
| X1,6 | 100 | 100 | Unlimited |
| X1,7 | 300 | Unlimited | 200 |
| X2,8 | 100 | Unlimited | 225 |
| X2,9 | 400 | Unlimited | 225 |
| X2,10 | 175 | 225 | Unlimited |
| X2,11 | 350 | Unlimited | 250 |
| X2,12 | 350 | Unlimited | 250 |
| X2,13 | 100 | 225 | Unlimited |
| X3,14 | 200 | Unlimited | Unlimited |
| X4,15 | 93 | Unlimited | Unlimited |
| X5,16 | 200 | Unlimited | Unlimited |
| X6,17 | 100 | Unlimited | Unlimited |
Table 9. Limits on changes in coefficients of destination functions (Rp/Kg).
Based on the calculation of sensitivity analysis using LINDO, the allocation of rice from the sender to RTC Market, wholesalers in Market of Lama, big trader of Kec.Cipocok and big traders of Kec. Walantaka will not experience a change of allocation even though the cost required to supply rice has increased, and will change if its supply cost decreases to Rp. 142, - for RTC Market, Rp. 128, - for wholesalers in Market of Lama, Rp. 137, - for wholesalers Kec.Cipocok and Rp. 101, - for wholesalers Kec. Cost of allocation from shipper to wholesalers Kec. Kasemen will experience changes if the cost of supply increased by Rp. 100, - per kg and does not change the allocation if the cost of supply is reduced indefinitely. Allocation costs incurred for reseller merchants Kec. Curug will not change the allocation, although the cost required to supply rice increases and will change if the cost of supply is reduced by Rp. 200, -. Allocation of rice from a wholesaler RTC Market for retailers Kec. Taktakan and Kec. Serang will not change the allocation, although the cost required to supply the rice increases and changes if the supply cost is reduced by Rp. 225, - The allocation of rice for the wholesalers of the RTC Market to the wholesalers of the RTC Market, will change if the required rice allocation cost increases by Rp. 225, - and will not change if it is unlimited. The allocation of rice from Wholesalres in RTC Market for big traders of Pasar Lama and Cilegon will not change the allocation, although the cost required for rice supply allocation is increased indefinitely and will change if the supply cost is reduced by Rp 250 / kg. The cost of allocation of rice from the RTC Market to Merak Wholesalers will change if their supply cost is increased by Rp. 225, - and will have no effect if costs are lowered. Rice allocation for retailers Kec. Serang, Kec. Cipocok, Kec. Walantaka and Kec. Kasemen will not be subject to alocation change if the costs necessary to supply rice have increased and decreased. The highest coefficient on LINDO result is found in variable X2,9 of Rp. 400, - with the aim of supply, a wholesaler of RTC Market - retailers of Serang District. The lowest coefficient is in variable X4,15 of Rp. 93, - occurred at the destination supply of large traders Cipocok District – retailer Cipocok. The sensitivity analysis on the right-handed constraint parameter values gives information about where the right-handed value may change [19]. The right-hand segment of the constraint equations in the model shows the amount of rice available from each region and the quantity of rice demand per market. The LINDO processing results show that the value of the decision variables will still result in a minimal cost if the number of needs of each market and the amount of rice available from each region is unchanged. The results of sensitivity analysis on the right-hand side of LINDO program output can be seen in (Table 10).
| Equation on function constraints | Right Side Change Limit | ||
|---|---|---|---|
| Current rhs | Allowable increase | Allowable decrease | |
| 2 | 1655750 | Unlimited | 1655750 |
| 3 | 950000 | Unlimited | 884750 |
| 4 | 4250 | 884750 | 4250 |
| 5 | 61000 | 884750 | 1006750 |
| 6 | 3000 | Unlimited | 3000 |
| 7 | 2250 | Unlimited | 2250 |
| 8 | 500 | Unlimited | 500 |
| 9 | 4000 | Unlimited | 4000 |
| 10 | 0 | 0 | Unlimited |
| 11 | 0 | 0 | Unlimited |
| 12 | 0 | 0 | Unlimited |
| 13 | 0 | 0 | Unlimited |
| 14 | 0 | 1655750 | Unlimited |
| 15 | 0 | 0 | Unlimited |
| 16 | 0 | 4250 | Unlimited |