Review Paper - Journal of Molecular Oncology Research (2017) Volume 1, Issue 1
Quantification of newer anticancer drug enzalutamide by stability indicating RP-LC method and UV-visible spectroscopic method in bulk and synthetic mixture.
Dharmendra J Prajapati1*, Usmangani K. Chhalotiya1, Minesh D. Prajapati1, Jalpa U. Patel1 and Harsha V. Patel2
1Department of Pharmaceutical Chemistry and Analysis, Indukaka Ipcowala College of Pharmacy, Phase IV, ADIT Campus, New Vallabh Vidyanagar –388121, Gujarat, India
2Department of Pharmaceutics, Indukaka Ipcowala College of Pharmacy, Phase IV, ADIT Campus, New Vallabh Vidyanagar–388121, Gujarat, India
- *Corresponding Author:
- Usmangani K. Chhalotiya
Department of Pharmaceutical Chemistry and Analysis
Indukaka Ipcowala College of Pharmacy
New Vallabh Vidyanagar –388121, Gujarat, India
E-mail: usmangani84@gmail.com
Accepted on 08 August, 2017
DOI: 10.35841/molecular-oncology.1.1.65-73
Visit for more related articles at Journal of Molecular Oncology ResearchAbstract
An accurate, sensitive, selective and precise stability indicating Isocratic RP-LC method and UV-visible Spectroscopic method were developed for the quantitative determination of enzalutamide in bulk and synthetic mixture. The HPLC was carried out by reversed-phase technique on Sun fire C18, 5 µm column with mobile phase containing methanol: water (70:30). The flow rate was 1.0 ml/min and effluents were monitored at 234 nm with help of photodiode array (PDA) detector. UV spectroscopic determination was carried out at an absorption maximum of 234 nm using methanol as a solvent. The linearities were in the range of 4-14 µg/ml for UV-visible spectroscopic method and 0.03-20 µg/ml for RP-LC method, respectively. Validation of proposed method has been carried out with respect to linearity, accuracy, precision, specificity and robustness. Stock solution of EZA was subjected to acid and alkali hydrolysis, chemical oxidation, dry heat degradation and photolytic degradation and quantification has been carried out by proposed RP-LC method. Enzalutamide is susceptible to acidic and basic hydrolysis while it is stable towards chemical oxidation, dry heat and photolytic stress condition. Statistical comparison of both the method has been carried out by Student’s F-test showed no significant difference between the results obtained by the two methods. Due to sensitivity, rapidity and accuracy of methods, we believe that the both proposed methods will be useful for the routine quality control analysis and quantification of drug in bulk and from synthetic mixture.
Keywords
Enzalutamide, RP-HPLC, UV-visible spectroscopy, Force degradation, Validation.
Introduction
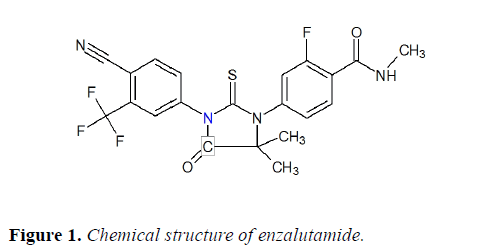
Enzalutamide (EZA), a androgen receptor antagonist suitable for the treatment of adult men with metastatic castrationresistant prostate cancer. Chemically, it is 4-{3-[4-cyano-3- (trifluoromethyl)phenyl]-5,5-dimethyl-4-oxo-2- thioxoimidazolidin-1-yl}-2-fluoro-N-methylbenzamide (Figure 1).
Enzalutamide is indicated for the treatment of adult men with metastatic castration-resistant prostate cancer who have received docetaxel therapy, compared with other anti-androgen, it shows reduced expression of androgen receptor dependent genes, decreased growth of prostate cancer cells, induction of cancer cell death and tumor regression. Molecular formula and molecular weight of EZA are C21H16F4N4O2S and 464.44 g/ mol, respectively [1-3]. Enzalutamide is freely soluble in acetonitrile and absolute ethanol and practically insoluble in water [4-7].
Comprehensive literature survey reveals that several analytical methods have been reported for the quantification of enzalutamide which includes UV Spectroscopy [8-14] and high performance liquid chromatography [15].
Most of the analytical methods for estimation of EZA in biological fluid were carried out by LC-MS/MS [16,17]. Literature review revealed that simple RP-HPLC method has been reported for the quantification of enzalutamide in its pharmaceutical dosage form. Therefore, it was our thought of interest to develop and validate sensitive, accurate, and reproducible analytical methods for estimation of enzalutamide in bulk and synthetic mixture. The aim of the present work was to develop a sensitive, selective, accurate, repeatable, and specific and stability indicating RP-LC method and UV-visible spectroscopic method for the quantification of EZA in bulk and synthetic mixture. The proposed both methods were validated according to ICH guidelines and its updated international convention [18,19].
Materials and Methods
RP-HPLC method
HPLC instrument: The liquid chromatographic system consist of Waters series 2998 (Shelton, USA) equipped with a PDA detector, series 515 quaternary isocratic pump and manual injector rheodyne valve with 20 μL fixed loop. The analyte EZA were monitored at 234 nm. Chromatographic analysis was performed by use of Sunfire C18 column having 250 mm-1 4.6 mm i.d. and 5 μm particle size. The drug and chemicals were weighed on Mettler Toledo electronic balance (ME204/A04, Mettler Toledo Group).
Chemicals and reagents: Analytically pure EZA was procured as a gift sample from reputed pharmaceutical industry, India. HPLC grade methanol, HPLC grade water and AR grade methanol were obtained from E.Merck Ltd., Mumbai, India. Lactose, magnesium stearate, silicon dioxide and starch were obtained from SRL Pvt Ltd., Mumbai, India.
Chromatographic conditions: The Sunfire C18 column equilibrated with mobile phase methanol:water in (70:30 v/v) ratio. The flow rate was maintained at 1 ml/min, eluents were monitored with PDA detector at 234 nm, and the injection volume was 10 μL. The total run time for estimation of EZA was kept 7 min.
Preparation of standard stock solutions: Accurately weighed EZA (10.0 mg) transferred into 10 ml volumetric flask and swirl dissolved in few ml of methanol. Volume was made upto the mark with mobile phase which gives a solution containing 1000 μg/ml of EZA (Stock solution A). From above stock solution A, aliquot (1.0 ml) solution was appropriately transferred into another 10 ml volumetric flask and diluted up to the mark with mobile phase to obtain working standard of 100 μg/ml (stock solution B).
Method validation: The method was validated for linearity, accuracy, precision, detection limit, quantitation limit, specificity, ruggedness and robustness as per ICH guidelines.
Linearity: Appropriate aliquot from working standard solution of EZA (stock solution B) was transferred in series of different 10 ml volumetric flasks and diluted up to the mark with mobile phase to obtain final concentrations of 0.03, 0.05, 0.1, 0.5, 1, 5, 10 and 20 μg/ml of EZA. The 20 μL fixed loop system was used to inject the solutions into the LC system and chromatograms were recorded. Regression equations were computed by constructing calibration curves between average peak areas versus concentrations (n=6).
Precision: The intra-day and inter-day precision study (intermediate precision) was carried out by estimating the responses 3 times on the same day and on 3 different days for three different concentrations of 0.03, 1, 20 μg/ml and the results were reported in terms of %RSD.
Accuracy: Standard addition method was used to performed accuracy studies by calculating recoveries of EZA. Known amount of EZA (0, 0.5, 1, 1.5 μg/ml) were added to a pre quantified sample solution, and the amount of EZA was estimated by measuring the peak areas and by fitting these values to the straight-line equation of calibration curve.
Detection limit and quantitation limit: The limit of detection (LOD) is defined as the lowest concentration of an analyte that can reliably be differentiated from background levels. Limit of quantification (LOQ) of an individual analytical procedure is the lowest amount of analyte that can be quantitatively determined with suitable precision and accuracy. LOD and LOQ were calculated by visual method as per ICH guidelines.
Robustness: Robustness of the method was performed by deliberately changing the experimental conditions like flow rate, percentage of organic phase and detection wavelength.
Solution stability: Stability of sample solutions were studied at 25 ± 2°C for 24 h.
System suitability: A system suitability test was an integral part of the method development to check that the system is appropriate for the analysis of EZA to be performed. System suitability test of the chromatography system was performed before validation run. Area, retention time (RT), capacity factor, column efficiency and symmetric factor for the five suitability injections were determined.
Analysis of synthetic mixture: A synthetic mixture of 100 mg powder containing 40 mg of EZA, which is subjected to dissolved in some portion of methanol in 10 ml volumetric flask. Sonicate the solution for proper solubility of EZA into it. Make up the volume up to the mark with methanol.
From the above solution, transfer 2.5 ml of solution to the 10 ml volumetric flask and make up to the mark with methanol which gives 1000 μg/ml solution. Transfer 1 ml of portion to 10 ml volumetric flask and make up upto the mark which gives 100 μg/ml solutions (stock solution A).
From stock solution A, 1.0 ml was transferred to another 10 ml volumetric flask and volume was adjusted up to the mark with mobile phase to obtain 10 μg/ml EZA. Solution was injected as per the mentioned chromatographic condition and the peak areas were recorded. The quantification was carried by keeping these values to straight line equation of calibration curve.
Forced degradation study: Forced degradation study using acid and alkali hydrolysis, chemical oxidation, photolytic degradation and dry heat degradation were carried out and interference of the degradation products was investigated. Accurately weighed EZA (10.0 mg) was transferred into 10 ml volumetric flasks and expose to different stress conditions.
Heat induced alkali hydrolysis: Accurately weighed 10.0 mg of EZA was taken into the 10 ml volumetric flask and 2.0 ml of 0.1 N NaOH was added to perform heat induced base hydrolysis. The flask was heated in a water bath at 80°C for 10 min and allowed to cool to room temperature. The solution was neutralized by addition of required amount of 0.1 N HCl and volume was made up to the mark with methanol. Pipette out the aliquot (1.0 ml) solution was transferring into another 10 ml volumetric flask and make up the volume upto the mark with mobile phase to obtain final concentration of 10 μg ml-1 of EZA.
Heat induced acid hydrolysis: Accurately weighed 10.0 mg of EZA was taken into the 10 ml volumetric flask and 2.0 ml of 0.5 N HCl was added to perform heat induced acid hydrolysis. The flask was heated in a water bath at 80°C for 4 h and 80°C required amount of 0.5 N NaOH and volume was made upto the mark with methanol. Pipette out the aliquot (1.0 ml) solution was transferring into another 10 ml volumetric flask and make up the volume upto the mark with mobile phase to obtain final concentration of 10 μg ml-1 of EZA.
Heat induced oxidative stress degradation: To perform heat induced oxidative stress degradation, 10.0 mg of EZA was transferred in 10 ml volumetric flask and 2.0 ml of 3% hydrogen peroxide was added. The mixture was heated in a water bath at 80°C for 6 h and allowed to cool to room temperature and volume was made upto the mark with methanol. Pipette out the aliquot (1.0 ml) solution was transferring into another 10 ml volumetric flask and make up the volume upto the mark with mobile phase to obtain final concentration of 10 μg ml-1 of EZA.
Dry heat degradation: Accurately weighed analytically pure 10 mg sample of EZA was exposed in oven at 80°C for 4 h. The drug powder was allowed to cool and transferred into 10 ml volumetric flask containing few ml of methanol and volume was made upto the mark with the methanol. Pipette out the aliquot (1.0 ml) solution was transferring into another 10 ml volumetric flask and make up the volume upto the mark with mobile phase to obtain final concentration of 10 μg ml-1 of EZA.
Study of photolytic degradation: In Petridis, accurately weighed analytically pure 10 mg of drug was exposed to UV light for 24 h. The powder content was transfer into 10 ml volumetric flask containing few ml of methanol and volume was made up to the mark with the methanol. Pipette out the aliquot (1.0 ml) solution was transferring into another 10 ml volumetric flask and make up the volume upto the mark with mobile phase to obtain final concentration of 10 μg ml-1 of EZA.
The final concentrations of all the EZA solutions (10 μg/ml) was injected into the column and chromatograms were recorded.
Result and Discussion
RP-LC Method
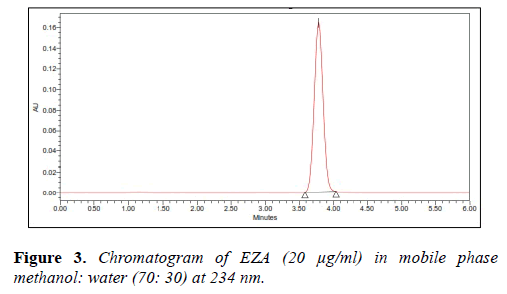
Various mixtures containing methanol and water, methanol were tried as mobile phases in the initial stage of method development. The mobile phase methanol:water (70:30, v/v) was found to be satisfactory and gave symmetric peak for EZA. The retention time for EZA was 3.84 min (Figure 2).
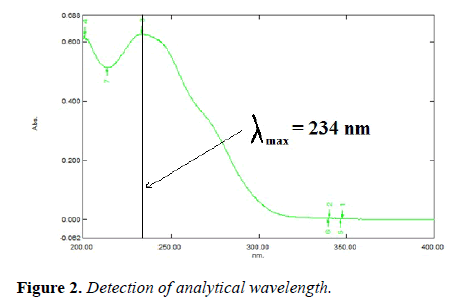
The asymmetric factor for EZA was 1.04 and the flow rate of mobile phase was maintained at 1 ml/min. The selection of detection wavelength was carried out by scanning 10 μg/ml solutionin between rang of 200-400 nm (Figure 3).
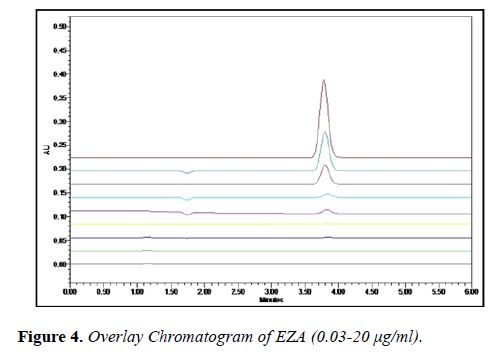
The linearity of enzalutamide was found to be in the range of 0.03-20 μg/ml with correlation coefficient 0.999. The overlain chromatogram of EZA (0.03-20 μg/ml) is shown in (Figure 4). Precision was determined by performing repeatability test and the coefficient of variance for EZA was found. The intra-day and inter-day precision studies were carried out for three different concentrations of EZA and the %RSD of intraday and interday were found to be 1.20-1.33 and 1.52-1.66, respectively.
The LOQ and LOD were found to be 0.03 μg/ml and 0.13 μg/ml, respectively and the summary of validation parameters are shown in Table 1.
| Parameters | EZA |
|---|---|
| Range (µg/ml) | 0.03-20 |
| Retention time | 3.84 |
| Detection limit (µg/ml) | 0.04 |
| Quantitation limit (µg/ml) | 0.13 |
| Accuracy (%) | 99.31-100.62 |
| Precision (%RSD) | |
| Intra-day (n =3) | 1.20-1.33 |
| Inter-day (n =3) | 1.52-1.66 |
| Instrument precision (%RSD) | |
| Injection (n=6) | 1.12 |
| Specificity | Specific |
| Assay (% Amount of drug) (n=3) | 99.84 |
| Solution stability | Stable for 24 h |
Table 1. Summary of validation parameters of proposed RP–LC.
Standard addition method is used for determination of accuracy by calculating recoveries of EZA. The recovery studies were performed at each level in triplicate and the recovery was found to be in the range of 99.32-100.63 % (Table 2).
| Amount of drug taken from synthetic mixture (μg/ml) |
Amount of standard drug spiked (μg/ml) | Amount of drug found (μg/ml) (n=3) |
%Recovery ± SD |
|---|---|---|---|
| 1 | 0 | 0.99 | 99.56 ± 0.59 |
| 1 | 0.5 | 1.50 | 100.15 ± 1.65 |
| 1 | 1 | 2.01 | 100.62 ± 1.00 |
| 1 | 1.5 | 2.50 | 100.18 ± 0.50 |
Table 2. Result of accuracy study by proposed RP–LC method.
Robustness study has been carried out by deliberately changing the experimental conditions like composition of mobile phase, detection wavelength, and flow rate. In all these conditions the percentage amount of the drug was determined and the RSD was found to be less than 2% (Table 3).
| Change in parameters | EZA (10 µg/ml) | ||
|---|---|---|---|
| Area± SD (n=3) | %RSD | ||
| Proportion of M.P. (Water:methanol) (70:30, v/v) |
68:32 | 726631.4± 7176.43 | 0.98 |
| 72:28 | 730405.7± 7627.9 | 1.04 | |
| Change in wavelength(λmax-234nm) | 233 | 720878.2± 13506.7 | 1.87 |
| 235 | 729823.6± 10731.4 | 1.47 | |
| Change in flow rate(1 ml/min) | 0.8 ml/min | 749443.04± 9476.78 | 1.45 |
| 1.2 min/ml | 730783.91± 8249.47 | 1.30 | |
Table 3. Robustness studies of EZA by proposed RP–LC method.
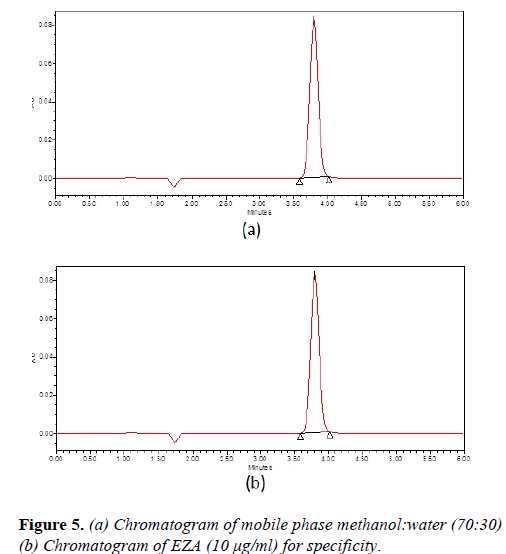
Solvent suitability study of standard solution of EZA was carried out at room temperature and test was carried out after different time intervals. The drug was found to be stable with recovery more than 99%. Specificity studies of EZA are shown in Figure 5.
System suitability parameters were evaluated and results are reported in Table 4.
| Parameter | EZA |
|---|---|
| Retention time (min) | 3.84 |
| Capacity factor | 1.20 |
| Column efficiency | 8292.87 |
| Tailing factor | 1.04 |
Table 4. Result of system suitability of proposed RP–LC.
Analysis of synthetic mixture: The proposed method is applied to the determination of EZA in synthetic mixture. The % amount of drug found to be more than 98%.
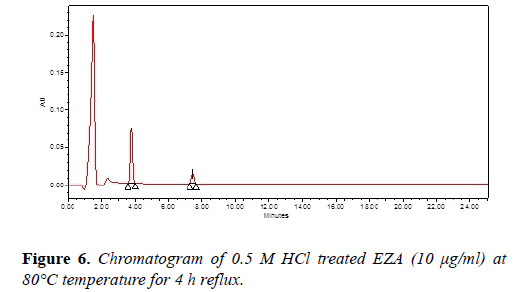
Forced degradation study: Acid and base hydrolysis study, photolytic degradation, dry heat degradation and oxidative stress degradation studies were carried out and the degraded samples were analyzed by the developed method. Chromatogram of acid hydrolysis was performed at 80°C for 4 h reflux showed degradation of EZA with degradation product peak at retention time (Rt) 7.45 (Figure 6).
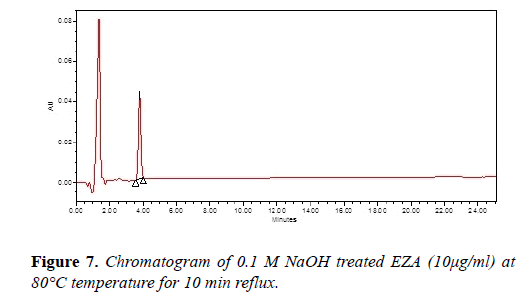
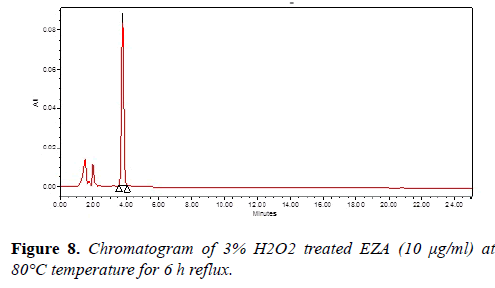
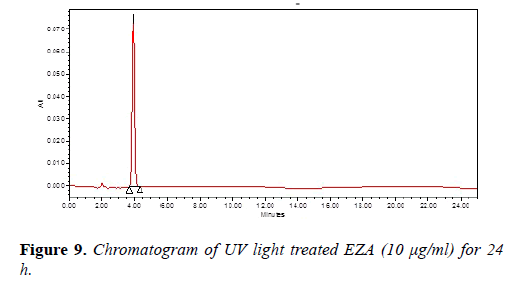
Chromatogram of base hydrolysis was performed at 80°C for 10 min reflux showed degradation of EZA (Figure 7). The chromatogram of oxidized EZA with 3% hydrogen peroxide was performed at 80°C for 6 h reflux, does not show any degradation of EZA (Figure 8). The chromatogram of ultraviolet light exposed EZA was performed for 24 h, drug was found to be stable (Figure 9).
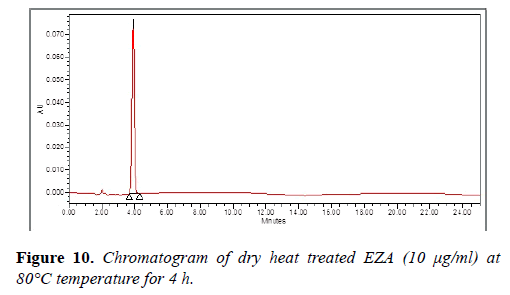
The chromatogram of EZA exposed to dry heat at 80°C for 4 h, does not shows degradation of EZA (Figure 10). The degradation study thereby indicated that EZA was found to be stable under oxidation (3% hydrogen peroxide), photolytic degradation and dry heat degradation while it was found to be susceptible to acid and base hydrolysis. The degradation peaks are well resolved from the drug peak and no degradation products from different stress conditions interfere in the determination of EZA which indicate that the method is selective and specific.
Summary of Forced Degradation Study is shown in Table 5.
| Stress condition | Time | % Amount of Drug found | Rt of Degradation products (min) |
|---|---|---|---|
| Acid 0.5 N HCl | 4 h | 90.81 | 7.45 |
| Base 0.1 N NaOH | 10 min | 83.62 | - |
| 3% Hydrogen peroxide | 6 h | 99.66 | Stable |
| Dry heat | 4 h | 101.11 | Stable |
| UV exposure | 24 h | 100.93 | Stable |
Table 5. Forced degradation study of enzalutamide by proposed method.
UV-visible spectrophotometry
Chemicals and reagents: Methanol was used throughout UVvisible spectroscopic method development and validation.
Instrumentation: UV spectrophotometric method was performed on double beam UV-visible spectrophotometer (Shimadzu, model 1700) having two matched quartz cells with 1 cm light path.
Selection of solvent: EZA is slightly soluble in aqueous solvent and soluble inorganic solvent. It is freely soluble in methanol; therefore methanol was chosen as a solvent for stock solution preparation.
Preparation of standard stock solution (100 μg/ml): Accurately weighed EZA (25.0 mg) was transferred into 25 ml volumetric flask having few ml (10.0 ml) of methanol and swirl to dissolve and diluted up to the mark with methanol to obtain solution having concentration of EZA (1000 μg/ml). From the above solution, pipette out 1.0 ml of an aliquot and transfer into another 10 ml volumetric flask and diluted upto the mark with methanol to obtain standard stock solution of 100 μg/ml.
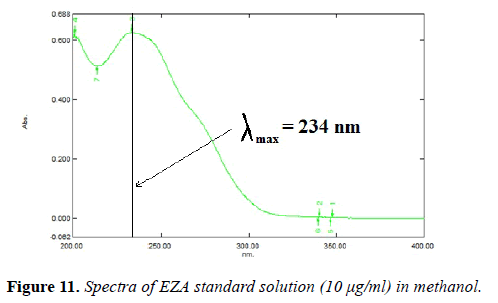
Selection of analytical wavelength: The solution of EZA was prepared in methanol at a concentration of 10 μg/ml. It was scanned in the wavelength range of 400-200 nm. Analytical wavelength of 234 nm was selected for determination of EZA.
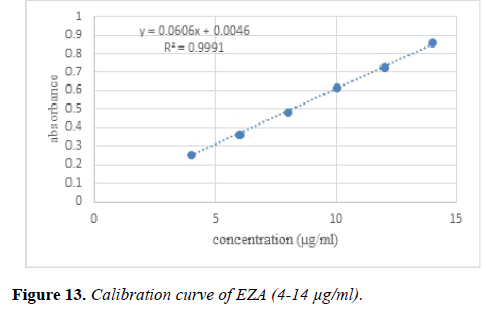
Calibration curve: Appropriate aliquot from the stock solution were taken in series of different 10 ml volumetric flask. Volume was made upto the mark with methanol which gives final concentrations of 4, 6, 8, 10, 12 and 14 μg/ml.
Validation
Linearity andrange: Linearity of the method was performed by constructing calibration curves at six different concentration levels over a range of 4-14 μg/ml for EZA. The calibration curve was constructed by plotting absorbance versus concentration (n=5).
Precision
Repeatability: Standard solution of EZA (10 μg/ml) was prepared and spectra were recorded. Absorbance was measured at 234 nm using methanol as a blank. The absorbance of the same concentration of EZA solution was measured six times and %RSD was calculated.
Intra and inter day precision: Difference in the results of three different concentrations (4, 10 and 14 μg/ml) within the same day (intra-day) and difference in the results between different days (inter-day) were analysed. Intra-day precision was performed by analysing each concentration of EZA for three times in the same day. Inter-day precision was performed by analysing each concentration of EZA for three times for three different days.
Limit of detection: From the linearity curve equation, the standard deviation (SD) of the Y-intercepts (response) was calculated. Then LOD was measured by using mathematical expressions given in section. The limit of detection (LOD) of the drug was calculated by using the following equations designated by International Conference on Harmonization (ICH) guideline: LOD=3.3 Χ σ/S,
Where, σ=Standard deviation of the response at Y-intercept
S=Slope of the calibration curve
Limit of quantification: From the linearity curve equation, the standard deviation (SD) of the Y-intercepts (response) was calculated. Then LOQ was measured by using mathematical expressions given in section. The limit of quantification (LOQ) of the drug was calculated by using the following equations designated by International Conference on Harmonization (ICH) guideline: LOQ=10 Χ σ/S
Where, σ=Standard deviation of the response at Y-intercept
S=Slope of the calibration curve
Accuracy: The accuracy study of the method was performed by calculating recoveries of EZA by standard addition method. Known amount of EZA (0, 2.5, 5, and 7.5 μg/ml) were taken from the working standard solution (100 μg/ml of EZA).
It was added to pre-quantified sample solutions to obtain 5, 7.5, 10, 12.5 μg/ml solutions. The amount of EZA was determined by measuring the absorbance and by fitting these values to the straight line equation of calibration curve.
Ruggedness: It is the degree of reproducibility of test results obtained by analysing the drug under variety of normal test conditions such as different analysts, instruments, days, reagents and columns.
Solution stability: The stock solution of EZA (100 μg/ml) was prepared and store in room temperature analysed by UV spectroscopic at regular at intervals 0, 4, 8 and 24 h.
Analysis of synthetic mixture: A synthetic mixture of 100 mg powder containing 40 mg of EZA, which is subjected to dissolved in some portion of methanol in 10 ml volumetric flask. Sonicate the solution for proper solubility of EZA into it. Make up the volume up to the mark with methanol.
From the above solution, transfer 2.5 ml of solution to the 10 ml volumetric flask and make up upto the mark with methanol which gives 1000 μg/ml solution (Stock solution A).
From above solution, pipette out 1.0 ml of stock solution in to 10 ml volumetric flask and make up upto the mark which gives 100 μg/ml solutions (stock solution B). From stock solution B, pipette out 1.0 ml of solution and was transferred into another 10 ml volumetric flask and adjusted up to the mark with methanol to obtain final concentration of 10 μg/ml EZA.
The resulting solution was analysed by proposed spectrophotometric method and quantification of EZA was carried out by keeping absorbance values to the straight line equations of calibration curves.
UV visible spectrophotometric method
Selection of solvent: EZA is slightly soluble in aqueous solvent and soluble in organic solvent. It is freely soluble in methanol; therefore, methanol was chosen as a solvent for stock solution.
Selection analytical wavelength: The solution of EZA was prepared in methanol at a concentration of 10 μg/ml. It was scanned within the wavelength range of 200-400 nm. Data was recorded at an interval of 1 nm. The wavelength of 234 nm was selected for estimation of EZA (Figure 11).
Validation of developed UV method
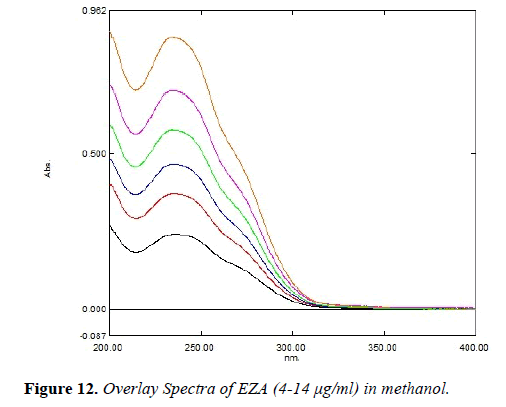
Linearity and range: The method was found to be linear over the range of 4-14 μg/ml. Overlay spectra of EZA is shown in Figure 12.
Calibration curve for EZA was plotted between absorbance versus concentration (Figure 13). The regression equation was compared and correlation coefficient was determined.
Precision
Repeatability: Repeatability studies carry out and data was reported in. The %RSD is <2 for EZA which indicates that the method is repeatable.
Intra and interday precision: Variation of results within the same day (intra-day), variation of results between days (interday) was analysed. For intra-day (n=3) %RSD was found to be 0.22-0.61 and %RSD for inter-day (n=3) was 0.40-0.93 for EZA. The %RSD is <2 for EZA which indicates that the proposed method is precise.
Limit of detection and limit of quantification: Under the experimental conditions used, the minimum amount of drug that could be detected (LOD) for EZA was found to be 0.330. The limit of quantification (LOQ) for EZA was found to be 1.00. Summary of Validation parameters are shown in Table 6.
| Parameters | EZA |
|---|---|
| Range(μg/ml) | 4-14 |
| Detection limit (μg/ml) | 0.33 |
| Quantitation limit (μg/ml) | 1.00 |
| Accuracy (%) (n=3) | 99.12-99.75 |
| Precision (%RSD) | |
| Intra-day(n =3) | 0.22-0.61 |
| Inter-day(n=3) | 0.40-0.93 |
| Repeatability(n=6) | 0.62 |
| Assay (% Amount of drug) (n=3) | 100.65 |
| Solution stability | Stable for 24 h |
Table 6. Summary of validation parameters of UV–visible spectrophotometric method.
Accuracy: Accuracy study was performed by calculating the recovery. The recovery was found to be 99.12-99.75% for EZA (Table 7), which indicates that method is accurate.
| Amount of drug taken from synthetic mixture (µg/ml) | Amount of standard drug spiked (µg/ml) | Amount of drug found (µg/ml) (n=3) | % Recovery ± SD |
|---|---|---|---|
| 5 | 0 | 4.95 | 99.12±0.38 |
| 5 | 2.5 | 7.47 | 99.64±0.21 |
| 5 | 5 | 9.97 | 99.75±0.09 |
| 5 | 7.5 | 12.45 | 99.67±0.07 |
Table 7. Result of accuracy study by proposed UV method.
Ruggedness: Ruggedness of the method was analysed by deliberate change different parameters like different analyst and different UV-visible spectrophotometer model (Table 8). The % RSD was <2 indicates that developed method is rugged.
| Concentration (μg/ml) | Change in Condition | Absorbance (n=3) | %RSD |
|---|---|---|---|
| 10 μg/ml | UV-1800 | 0.625 ± 0.004 | 0.64 |
| Elico | 0.630 ± 0.002 | 0.31 | |
| 1# | 0.622 ± 0.0015 | 0.24 | |
| 2# | 0.626 ± 0.0015 | 0.24 |
Table 8. Data of ruggedness by proposed UV method.
Robustness: Robustness of the method was analysed by deliberate variation in method parameters like change in wavelength (Table 9). The %RSD was <2 indicates that developed method is robust.
| Concentration (μg/ml) | Change in Condition (actual wavelength 234nm± change in wavelength) | Absorbance (n=3) | %RSD |
|---|---|---|---|
| 10 μg/ml | 235 | 0.629 ± 0.002 | 0.39 |
| 233 | 0.617 ± 0.002 | 0.32 |
Table 9. Data of robustness by proposed uv method.
Solution stability: The stock solution was prepared and store in room temperature. The stock solution was appropriate diluted upto 10 μg/ml and analyzed by developed method. The amount of drug was found to be more than 98% which shows that the solution was stable for 24 h. Summary of validation parameters are shown.
Analysis of synthetic mixture: Synthetic formulation was analyzed by the developed method and% amount of drug was found to be 100.65 ± 0.63.
Comparision between HPLC method and UV method
The proposed analytical methods were compared using statistical analysis and student’s F-test was applied which does not reveal significant difference between the experimental values obtained in the assay of sample analysis by the two methods. The calculated F-value (F cal=1.2) was found to be less than the critical F-value (tcri=2.91) at 95% significance level hence it was concluded that both the methods do not differ significantly. Therefore, both these methods can be conveniently used for routine quality control analysis of EZA in bulk and synthetic mixture.
Conclusion
A specific, accurate, precise and robust isocratic and stability indicating RP-LC and UV-visible spectroscopic methods have been developed for the quantification of enzalutamide in bulk and synthetic mixture. In RP-LC method, the drug was found to be susceptible in acidic and basic media and stable under oxidative stress, photolytic degradation and thermal degradation. The proposed both methods can be used for the drug analysis in routine quality control. The drug was subjected to acid, alkali, oxidative stress, dry heat and UV exposure.
Drug is stable under oxidative stress, dry heat and UV exposure. Drug is susceptible under acidic and basic hydrolytic conditions. In acidic media peak was well resolved from the pure drug peak. No significant degradent peak was found in basic condition by RP-LC method. Comparison with recently published HPLC-UV article 19 have been shows simple method for quantification enzalutamide while in proposed method is stability indicating LC method for quantification of enzalutamide and its impurities. In addition, the proposed stability indicating RP-LC procedure can be applied to the analysis of samples obtained during accelerated stability experiments to predict expiration dates of pharmaceuticals.
Acknowledgements
The authors are very thankful to SICART and Indukaka Ipcowala College of Pharmacy, New Vallabh Vidyanagar, for providing necessary facilities to carry out research work.
References
- Sethi PD. High Performance Liquid Chromatography:Quantitative Analysis of Pharmaceutical Formulations (1st Ed). CBS Publishers and Distributors. 2001;pp116-7.
- Synder LR, Kirkland JJ, Glajch LJ. Practical HPLC Method Development (2nd Ed). John Wiley & sons. 1997;pp2-10.
- Sethi PD. Quantitative Analysis of Drugs in Pharmaceutical Formulations (3rd Ed). CBS Publishers and Distributors. 2011;pp51.
- Willard HH, Merrit LL, Dean JA, et al. In Instrumental Methods of Analysis (6th Ed). C.B.S. Publishers. 1989;pp1-12.
- Conners KA. In Textbook of Pharmaceutical Analysis. A Wiley Publication. 1999;pp16-22.
- Skoog DA, West DM, Holler FJ, et al. In Fundamental of Analytical Chemistry (8th Ed). Cengage Learning. 1992;pp2-3.
- Bradley L. InRemington,InstrumentalMethodofAnalysis (21st Ed). Lippincott Williams and Wikkins. 2005;pp633.
- Lachman L, Lieberman HA, Kanig JL. The Theory and Practice of Industrial Pharmacy (3rd Ed). Varghese Publishing. pp374-411.
- Pod F, Brian C,Jones E. Pharmaceutical Capsules (2ndEd). Pharmaceutical press. 2004;pp61-93.
- Raymond C, Paul J, Sian C. Handbook of Pharmaceutical Excipients (5th Ed). Published by Pharmaceutical press. 2006;pp103-04.
- CHMP assessment report. “Introduction to drug and its use, chemical properties and mechanism of action”. European Medicines Agency. 2013.
- Astellas. “NICE Final Appraisal Determination (FDA) recommends use of prostate cancer treatment XTANDI prior to chemotherapy”. 2015.
- Astellas. “Enzalutamide phase 2 terrain trial demonstrated statistically significant increase in PFS as compared to Bicalutamide in metastatic prostate cancer”. 2015.
- Zamir GK, Swetal SP, Prashant KD, et al. Validated UV Spectroscopic Methods for Determination of Enzalutamide in Pure and Pharmaceutical Dosage Form. ACAIJ. 2016;pp1-8.
- Khan Z G, Patil SS, Deshmukh PK et al. Validated RP-HPLC Method for determination of Enzalutamide in bulk and pharmaceutical dosage form. Indian Drugs. 2016;pp 46-9.
- Daniel B, Jacqueline A, Roel M, et al. Validation of method for quantifying enzalutamide and its metabolites in human plasma by LC-MS/MS. Bioanalysis. 2014;6:737-44.
- Song JH, Kim TH, Jung JW, et al. Quantitative determination of Enzalutamide, an anti-prostate cancer drug, in rat plasma using liquid chromatography-tandem mass spectroscopy, and its application to a pharmacokinetic study. Biomed Chromatography. 2014;23(8):1112-7.
- ICH Guidelines. Validation of Analytical Procedures: Text and Methodology, Geneva, Switzerland. 2005.
- Puszkiel A, Plé A, Huillard O, et al. A simple HPLC-UV method for quantification of enzalutamide and its active metabolite N-desmethyl enzalutamide in patients with metastatic castration-resistant prostate cancer. J Chromatogr B Analyt Technol Biomed Life Sci. 2017;1058:102-7.
