Research Article - Environmental Risk Assessment and Remediation (2017) Volume 1, Issue 1
Implementation analysis of technical-economic solar and wind energy potential for small homes: a case study.
Ali Razmjoo1, Afshin Davarpanah2*, Mohammadreza S Heibati3
1Department of Energy Systems Engineering, Islamic Azad University-South Tehran Branch, Tehran, Iran
2Department of Petroleum Engineering, Science and Research Branch, Islamic Azad University, Tehran, Iran
3Department of Mechanical Engineering, Pardis Branch, Islamic Azad University, Tehran, Iran
- *Corresponding Author:
- Afshin Davarpanah
Department of Petroleum Engineering, Science and
Research Branch
Islamic Azad University
Tehran
Iran
E-Mail: Afshindpe@Gmail.Com
Accepted date: December 08, 2016
Citation: Razmjoo A, Davarpanah A, Heibati MS. Implementation analysis of technical-economic solar and wind energy potential for small homes:a case study. Environ R isk Assess Remediat. 2016;1(1):7-12
Abstract
One of the best way to reduce of greenhouse gas using of renewable energy actually renewable energies are as the best solution to reducing of global warming and it needs to reducing of fossil fuels. Country of Iran has a high potential in renewable energy such as solar, wind energy that can with a regular program use of them. The aim of this study is the analysis and assessment of solar and wind energy potentials in Zanjan city of Iran. At first, the required data from the national meteorological organization have been obtained and analyzed. A analysis has been carried out by HOMER software leads to the conclusion that, though installing large scale wind turbines is not feasible for the studied site; its solar potential would offset the wind’s shortfall. The result for solar energy radiation shows the potential of solar energy is sufficient for Zanjan likewise due to good wind speed in Zanjan area, can be say this city has a privilege in renewable energies.
Keywords
Grenewable energy, solar energy, wind energy, homer software, economic justification.
Introduction
Progress in renewable energy deployment is caused that utilization of fossil fuels reduced also from the environmental point of view in contrast to fossil fuels, renewable energy are in general pollution free which indeed it is essential factor for human life also there is an attempt to limit emission of carbon dioxide by using of renewable energy, actually the problems caused by fuel fossils is very harmful for mankind [1-3]. Renewable energy especially solar and wind energy technologies have seen much progress in different parts, Solar and wind energy can play a remarkable role as non-conventional resource in the world. About solar and wind energy applications many studies have been conducted related in different countries [4-6]. For example studied an assessment solar and wind energy in Bucaramanga, Colombia [7]. A review about renewable energy research progress in Mexico done [8]. A case study about empirical models for estimating global solar radiation have been done [9]. Technical and Economic Assessment of solar PV/diesel for Ethiopia country have been analyzed [10]. Determined the characteristics and potential of wind power for Kudat and Labuan located in Malaysia [11]. Presentation of Solar radiation model [12]. Wind energy potential of two sites in North-East, Nigeria considered [13]. Presented a study about solar radiation prediction by using of adaptive neurofuzzy approach in Nigeria [14]. Their results indicated which growing of the solar and wind energy is outstanding and has positive effects on our life also help us to having a better future, Meanwhile it was demonstrated that the growth of investment on the solar and wind energy will make a health space for our infants and other kind of members society [15]. Iran is one of the largest oil producers in the world and it was caused that approach usage of renewable energy be less than fuel fossils but [16]. Iran like developing countries has focus on renewable energy development [17].
Description Studied Area
Zanjan city is capital of zanjan province. It is located in north of Iran. This city is located at Coordinates 36°41′N and 48°29′E and at an altitude of 1,663 m meters above sea level. At the 2011 census its population was 386.851. Zanjan is a tourist city and also has a lot of historic places and historical attractions such as ancient market. The climate is cold in winter and autumn and moderate in spring and summer.
Technical-Economic Analysis of Solar Energy
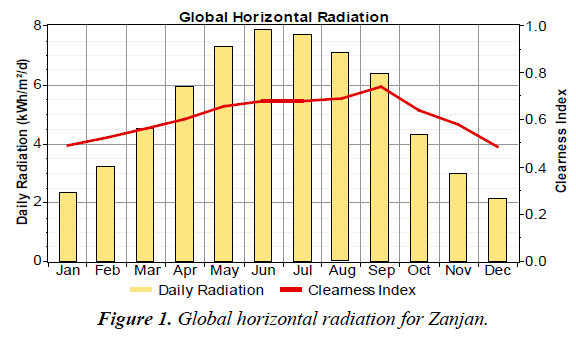
In this study the Homer software that is conventional was used to a technical-economic analysis on the solar energy generation potential of the studied area. Figure 1 shows the diagram of horizontal radiation pertaining to Zanjan city solar energy potential is shown in Figure 1. As this figure shows, the highest level of solar radiation is 7.860 kWh/m2/d per square meter, which has been received in June and the lowest level is 2.126 kWh/m2/d per square meter, which has been received in December also in this figure, clearness index and daily radiation are plotted for different month of the year and the red line was drawn by the software and it is a clearance index.
Table 1 shows Specifications of System architecture that is including PV Array 7 kW, generator 1, 7 kW, battery 24 Vision 6FM55D also invertor and Rectifie7 kW.
| PV Array | Generator 1 | Battery | Inverter | Rectifier | Dispatch strategy |
|---|---|---|---|---|---|
| 12 kW | 12 kW | 14Vision 6FM55D |
7 kW | 7 kW | Cycle Charging |
Table 1. Specifications of system architecture.
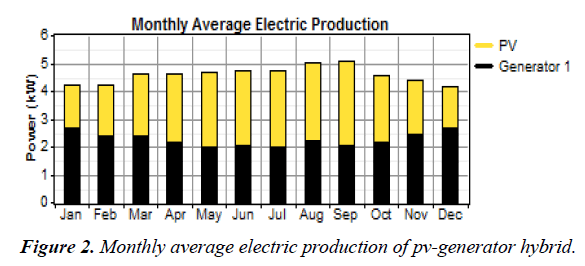
The monthly average electricity production by the photovoltaic collectors and generator 1 are each shown in Figure 2. In this figure the electrical power generation by the generator makes a significant contribution.
Table 2 Shows the Specifications of PV System by each household, the Rated capacity is 7 kW and Total production is 12,205 kWh/yr.
| Rated capacity kW |
Mean output kW |
Capacity factor % |
Total production kWh/yr |
PV penetration % |
Hours of operation Hr/yr |
|---|---|---|---|---|---|
| 12.00 | 2.31 | 19.3 | 20,255 | 65.3 | 4,387 |
Table 2. Specifications of PV system.
Table 3 shows Specifications of Generator System that is including Hours of operation, Number of starts, Electrical production, Mean electrical output, Fuel energy input, Mean electrical efficiency.
| Hours of operation hr/yr | Number of starts starts/yr |
Operational life yr |
Capacity factor % |
Electrical production kWh/yr |
Mean electrical efficiency % |
|---|---|---|---|---|---|
| 6,404 |
404 | 2,34 |
32.6 | 19,983 | 23.7 |
Table 3. Specifications of generator 1 system.
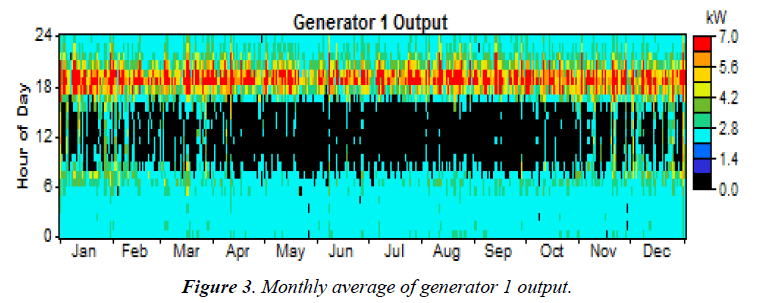
Figure 3 shows monthly average of Generator 1 Output that in this figure colors from black to red and unit age kW and respectively have been breakdown.
Table 4 shows Specifications of Battery System that each parameter in separation part has divided.
| String size | Strings in parallel | Bus voltage (V) | Nominal capacity kWh |
Losses kWh/yr | Annual throughput kWh/yr |
|---|---|---|---|---|---|
| 1 | 14 | 12 | 9.24 | 84.4 | 378 |
Table 4. Specifications of battery system.
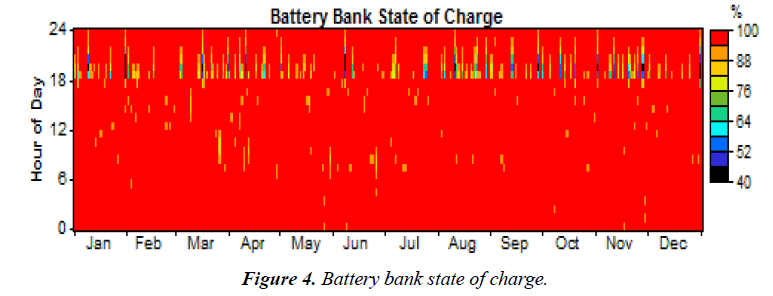
Figure 4 shows the battery bank state of charge for Zanjan city that battery has not been fully charged for the entire 24 hours of the day and sometimes has a fluctuation; Red color which is the graphical representation of battery performance in Figure 4 confirms this observation.
Table 5 shows Specifications of converter considered for each PV system consisting capacity, Mean output, Capacity factor, Hours of operation and Losses.
| Capacity (kW) |
Mean output (kW) | Capacity Factor (%) |
Hours of operation Hrs/yr |
Losses kWh/yr |
|||||
|---|---|---|---|---|---|---|---|---|---|
| Inverter | Rectifier | Inverter | Rectifier | Inverter | Rectifier | Inverter | Rectifier | Inverter | Rectifier |
| 7.00 | 7.00 | 1.39 | 0.04 | 19.8 | 0.5 | 4,449 | 4,225 | 1,348 | 58 |
Table 5. Specifications of converter considered for each PV system.
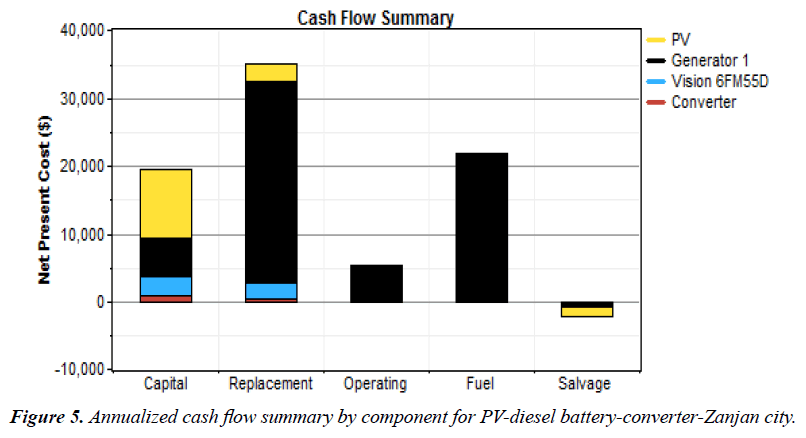
Figure 5 summarizes the annualized cash flow for this system, broken down by component for PV-diesel battery-converter. The maximum cost after the generator cost is belong to the PV cost.
Table 6 shows detailed breakdown of the NPC for PV-diesel battery-converter hybrid system that in this table the highest and lowest total lifetime cost of the system is belonging to the generator and convertor, which have values of US$ 61,807 and US$ 1,188 respectively in addition this system exhibits a maximum in terms of cost of the system, which is US$ 79,624.
| Component | Capital | Replacement | O&M | Fuel | Salvage | Total |
|---|---|---|---|---|---|---|
| ($) | ($) | ($) | ($) | ($) | ($) | |
| PV | 10,000 | 2,494 | 256 | 0 | -1,398 | 11,352 |
| Generator 1 | 5,833 | 29,701 | 4,775 | 21,941 | -444 | 61,807 |
| Vision 6FM55D | 2,800 | 2,537 | 179 | 0 | -239 | 5,277 |
| Converter | 817 | 273 | 149 | 0 | -51 | 1,188 |
| System | 19,450 | 35,005 | 5,359 | 21,941 | -2,132 | 79,624 |
Table 6. Detailed breakdown of the NPC for PV-diesel batteryconverter hybrid system.
Technical-Economic Analysis of Wind Energy
For analysis of wind energy in this system Homer software was used and all analysis presented in different tables and figures. Table 7 shows the specifications of wind System architecture that for this system 2 Generic 3 kW, a generator 7 kW and 24 Vision 6FM55D were selected.
| Wind turbine kW |
Generator 1 kW |
Battery | Inverter kW |
Rectifier kW |
Dispatch strategy |
|---|---|---|---|---|---|
| 1 Generic 3 | 7 |
24 Vision 6FM55D |
7 | 7 | Cycle Charging |
Table 7. Specifications of wind system architecture.
Table 8 shows Specifications of Generator System for wind energy that in this table total rated capacity 6 kW and Total production 2,769 kWh/yr obtained.
| Total rated capacity kW |
Mean output kW |
Total production kWh/yr |
Wind penetration % |
Hours of operation hr/yr | Levelized cost $/kWh |
|---|---|---|---|---|---|
| 3.00 | 0.136 | 1,190 | 3.84 | 5,181 | 0.171 |
Table 8. Specifications of generator 3kw system.
Table 9 as PV analysis shows Specifications of Generator 1 System that is consisting Hours of operation, Number of starts, Operational life, Capacity factor, Electrical production, Mean electrical output.
| Hours of operation hr/yr | Number of starts/yr | Operational life yr |
Capacity factor % |
Electrical production kWh/yr |
Mean electrical output kW |
|---|---|---|---|---|---|
| 8,725 | 28 |
1.72 | 50.5 | 30,983 | 3.55 |
Table 9. Specifications of generator 1 system.
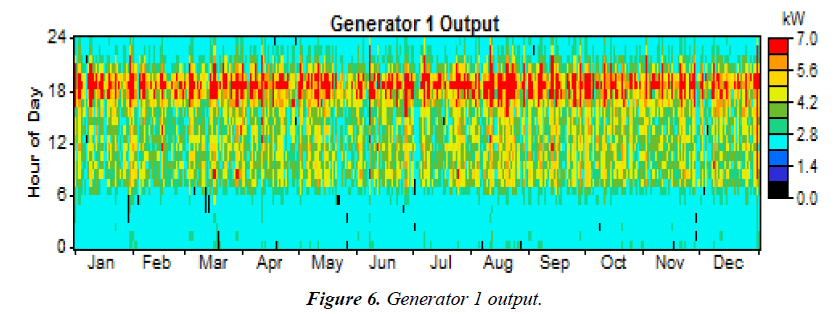
Figure 6 shows Generator 1 Output that has a range from 0.0 to 12 kW h/d.
Table 10 shows that is breakdown of Specifications of Electrical System which is consisting Wind turbines, Generator 1, Excess electricity, DC primary load, Capacity shortage and Renewable fraction.
| Wind turbine kWh/yr |
Generator 1 kWh/yr | Excess electricity kWh/yr |
AC primary load kWh/yr |
Capacity shortage kWh/yr |
Renewable fraction % |
|---|---|---|---|---|---|
| 1,190 | 30,983 | 894 | 31,021 | 7.32 | 0.037 |
Table 10. Specifications of electrical system.
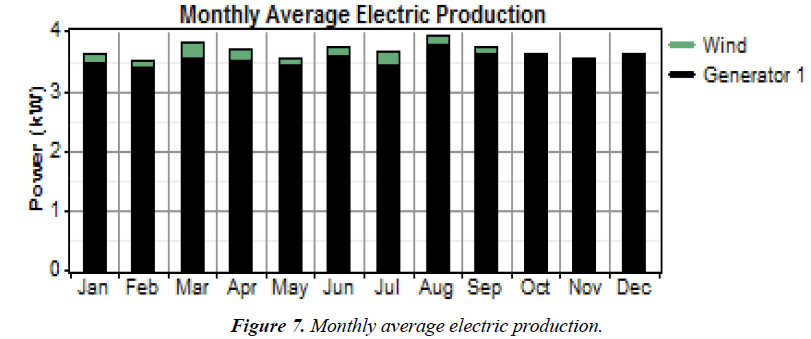
In this system Fraction for Wind turbines 4%, Generator 1, 96 % and DC primary load 100% obtained also Figure 5 shows Monthly Average Electric Production breakdown wind-diesel. The monthly average electricity production by the wind turbine and generator 1 are each shown in Figure 7. The electrical power generation by the generator is obviously in this figure.
Table 11 indicates Specifications of Generator System for wind energy of this considered system that String size, Strings in parallel, Bus voltage, Nominal capacity, Losses and Annual throughput have been shown.
| String size | Strings in parallel | Bus voltage (V) |
Nominal capacity kWh |
Lifetime throughput kWh | Losses kWh/yr |
|---|---|---|---|---|---|
| 1 | 24 | 12 | 15.8 | 6,144 | 75.6 |
Table 11. Specifications of battery.
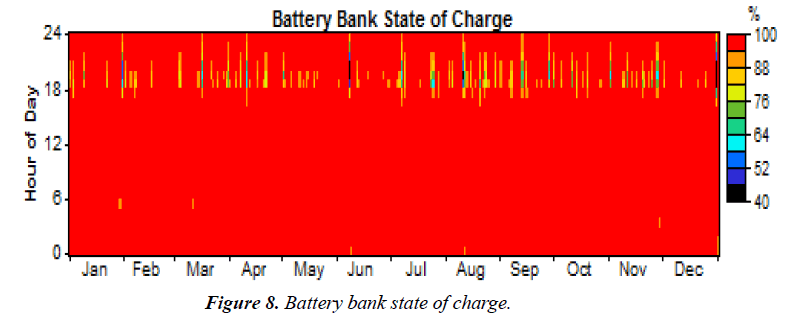
Figure 8 shows the battery bank state of charge for Zanjan city and it is obvious that battery has been fully charged for the entire 24 hours of the day.
Specifications of converter considered for wind system has been shown in Table 12 and is including Capacity, Mean output, Capacity Factor, Maximum and Minimum output.
| Capacity (kW) |
Mean output (kW) | Capacity Factor (%) |
Hours of operation hrs/yr |
Losses kWh/yr |
|||||
|---|---|---|---|---|---|---|---|---|---|
| Inverter | Rectifier | Inverter | Rectifier | Inverter | Rectifier | Inverter | Rectifier | Inverter | Rectifier |
| 7 | 7 | 0.13 | 0.04 | 1.9 | 0.5 | 4,165 | 3,873 | 128 | 55 |
Table 12. Specifications of converter considered for each PV system.
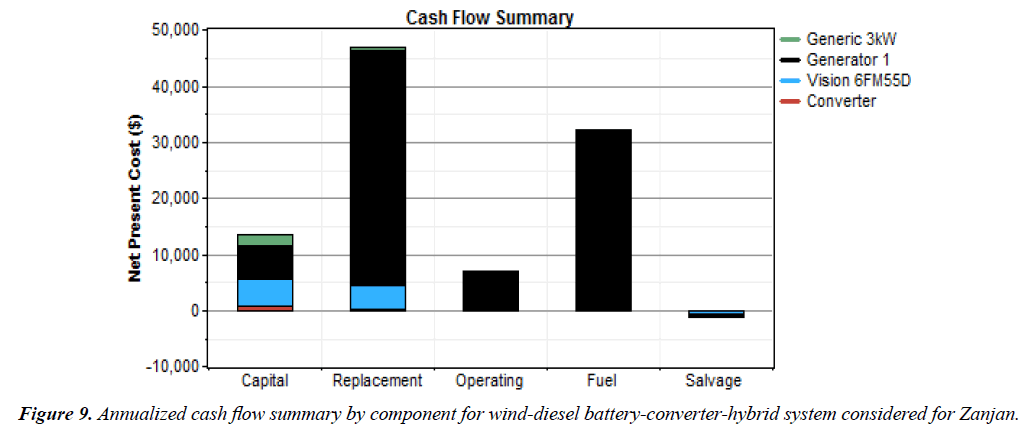
Figure 9 shows summarizes the annualized cash flow for this system, broken down by component for Wind-diesel -battery-converter that as PV-diesel battery-converter system the maximum cost is belong to the generator cost and then vision 6FM55D has maximum cost. Also in this study total net present cost 98,275$, levelized cost energy 0.248 $/kWh and operating cost 6,636 $/yr obtained.
Table 13 shows detailed breakdown of the NPC for Wind-diesel battery-converter hybrid system the highest and lowest total lifetime cost of the system is belonging to the generator and convertor, which have values of US$ 85,756 and US$ 1,188, respectively also this system present a maximum in terms of cost of the system, which is US$ 98,275.
| Component | Capital | Replacement | O&M | Fuel | Salvage | Total |
|---|---|---|---|---|---|---|
| ($) | ($) | ($) | ($) | ($) | ($) | |
| Generic 3kW | 2,000 | 668 | 64 | 0 | -124 | 2,607 |
| Generator 1 | 5,833 | 41,744 | 6,506 | 32,295 | -623 | 85,756 |
| Vision 6FM55D | 4,800 | 4,177 | 307 | 0 | -559 | 8,725 |
| Converter | 817 | 273 | 149 | 0 | -51 | 1,188 |
| System | 13,450 | 46,861 | 7,026 | 32,295 | -1,357 | 98,275 |
Table 13. Detailed breakdown of the NPC for wind-diesel-battery-converter hybrid system.
Conclusion
At present, energy is the main factor of growth activities and different production sin side by side of world, likewise in recent years, there has been an increasing amount of literature on renewable energy systems that about it can say that. It was proved that given the limited sources of fossil fuels energy storage than past decreased and demands increased also many causes such as citied development and different industrials have led to an increasing demand for energy, then Moreover enough energy lack in future is main cause of changing people attitude for rising renewable energy using in the world. In this study potential of wind and solar energy for Zanjan area in Iran analyzed and considered. The Results showed Zanjan city in solar and wind energy has a pretty potential and can providing require of people energy for their home likewise due to having high potential investment of it has economic justification.
Suggestions for Future
1. Creating a regular program long term to reduce of global warming by more use of renewable energy instead of fuel fossils.
2. More public training and encourage people to get absorbing to clean energy program for future.
3. Presentation renewable energy lessens in schedule children.
4. Support of everybody that use of renewable energy as power energy to its house.
References
- Mostafaeipour A, Sedaghat A, Dehghan-Niri AA, et al. Wind energy feasibility study for city of Shahrbabak in Iran. Renew Sustain Energy Rev. 2011; 15: 2545–56.
- S.Alemán G-Nava, H.Casiano-Flores V, L.Cárdenas-Chávez D, et al. Renewable energy research progress in Mexico: A review. Renewable and Sustainable Energy Reviews. 2014; 32: 140–53.
- Mohammadi K, Mostafaeipour A, Sedaghat A, et al. Application and economic viability of wind turbine installation in Lutak, Iran. Environmental Earth Sciences. 2016; 75: 1-6.
- Fazelpour F, Vafaeipour M, Rahbari O, et al. Considerable parameters of using PV cells for solar-powered aircrafts. Renewable and Sustainable Energy Reviews. 2013; 22: 81-91.
- Vafaeipour M, Valizadeh M.H, Rahbari O, et al. Statistical Analysis of Wind and Solar Energy Potential in Tehran. International journal of renewable energy. 2014; 4.
- Mojtaba Qolipoura, Ali Mostafaeipour, Shahaboddin Shamshirband. Evaluation of wind power generation potential using a three hybrid approach for households in Ardebil Province, Iran. Energy Conversion and Management. 2016; 118: 295-305.
- Vogiatzis N, Kotti K, Spanomitsios S, et al. Analysis of wind potential and characteristics in North Aegean. Greece Renewable Energy. 2004; 29: 1193–1208.
- Ali Mostafaeipour, Mojtaba Qolipoura, kasra mohamadi. Evaluation of installing photovoltaic plants using a hybrid approach for Khuzestan province, Iran. Renewable and Sustainable Energy Reviews. 2016; 60: 60-74.
- G Ordóñez, G Osma, P Vergara, et al. Solar Energy Potential Assessment for Development of Renewables Energies Applications in Bucaramanga, Colombia, The International Congress of Mechanical Engineering and Agricultural Sciences 2013, Materials Science and Engineering. 2014; 59: 012004 doi:10.1088/1757-899X/59/1/012004.
- Gibrán S, Alemán-Nava, Victor H, et al. Renewable energy research progress in Mexico: A review. Renewable and Sustainable Energy Reviews. 2012; 32: 140-53.
- Fariba Besharat, Ali A. Dehghan, Ahmad R. Faghih. Empirical models for estimating global solar radiation: A review and case study. Renewable and sustainable energy reviews. 2013; 21: 798-821.
- Zelalem Girma. Technical and Economic Assessment of solar PV/diesel Hybrid Power System for Rural School Electrification in Ethiopia. 2013; 3.
- M.R. Islam, R. Saidur, N.A. Rahim. Assessment of wind energy potentiality at Kudat and Labuan, Malaysia using Weibull distribution function. Energy. 2011; 36: 985-92.
- L.T. Wong, W.K. Chow. Solar radiation model. Applied Energy. 2001; 69: 191–224.
- R.O. Fagbenle, J. Katende, O.O. Ajayi, et al. Assessment of wind energy potential of two sites in North-East, Nigeria. Renewable Energy. 2011; 36: 1277-83.
- Lanre Olatomiwa, , Saad Mekhilef, Shahaboddin Shamshirband, et al. Adaptive neuro-fuzzy approach for solar radiation prediction in Nigeria. Renewable and Sustainable Energy Reviews. 2015; 51:1784-91.
- Saeidi D, Mirhosseini M, Sedaghat A, et al. Feasibility Study of Wind Energy Potential in Two Provinces of Iran: North and South Khorasan. Renewable and Sustainable Energy Reviews. 2011; 15: 3558– 69.
