Research Article - Environmental Risk Assessment and Remediation (2017) Volume 1, Issue 2
Flood Risk Zonation Using GIS Techniques: District Charsadda, 2010 Floods Pakistan.
Farish S1*, Munawar S2, Siddiqua A2, Alam N3, Alam M4
1COMSATS Institute of Information Technology, Islamabad, Pakistan
2University of Gujrat, Gujrat, Pakistan
3Institute of Space and Technology, Karachi, Pakistan
4Institute of Space and Technology, Islamabad, Pakistan
- Corresponding Author:
- Sidra Farish
COMSATS Institute of Information Technology
Islamabad
Pakistan
Tel: +923457899748
E-mail: sidrayousafzai@gmail.com
Accepted date: on April 10, 2017
Citation: Farish S, Munawar S, Siddiqua A, et al. Flood Risk Zonation Using GIS Techniques: District Charsadda, 2010 Floods Pakistan. Environ Risk Assess Remediat. 2017;1(2):8-14
Abstract
After agriculture revolution flooding has become the most potential natural hazard in the world. Pakistan being the sixth largest population of the world and having huge irrigation system is also facing this problem which worsened in recent decades. In 2010, monsoon season brought unusually large amount of rainfall and completely destroyed agriculture infrastructure in many districts all over the country. Charsadda district was the most severely affected district by both flash floods and reverine floods in 2010. These floodplains are densely populated and there is a need to identify flood hazard risk zones to prevent further damages caused by such floods. This article aims to prepare flood hazard risk zones map using Geographical Information System techniques. Digital Elevation Model of 30 m resolution is used to prepare the final maps. Flood risk potential zones around the rivers are identified by multiple ring buffer analysis. All layers from Digital Elevation Model analysis and buffer analysis are combined by weighted overly analysis in ArcGIS software to generate potential flood hazard risk zones map. Flood hazard zones are based on historical flood events. The map has been divided further into the highest, higher, moderate, low and lower flood hazard zones.
Keywords
Flood, geographical information system, flood hazard risk zones, weighted overlay analysis, monsoon Pakistan.
Introduction
Flooding is a temporary layering of water on land that may be caused by high rainfall. Flood hazards are the most common and harsh of all naturally occurring disasters. Flood is a global phenomenon affecting rich and poor, the prepared and unprepared alike [1]. Heavy rainfall in the river catchments and snow melting, generally result into floods in rivers during the monsoon season [2]. The major causes of flood disasters include the combining effect of land inundation from heavy rainfall, climate change, and blockage of drainages with refuse, construction of buildings across drainages, inadequate drainage networks, and population increase in urban areas. These factors independently do not cause floods but the combination of several of these usually cause flood disaster. Construction on natural drainages, increase in the population, and conversion of natural vegetation, agricultural land, and wetlands due to urbanization threaten the lives of people living in flood vulnerable areas such as flood plains and river beds [3]. All over the world, it is acknowledged that floods are the most serious natural hazards and spoil lives and property. Floods are causing vast socio-economic damages in the South Asian countries in the last few decades [4]. Flood problem has been reported almost everywhere in the world with much more pronounced effects in the developing countries [5-6]. Summer floods are common in Pakistan but 2010's flood in Pakistan is the century’s worst one. All the previous records of the amount of rainfall, discharge, and damage to property and life have been broken by the 2010's flood. Above normal rainfall has been received by almost every metrological station. Researchers report that profound and prolonged rainfall for four consecutive days (27-30 July) was the main reason of 2010-flood [7].
Flooding is a common experience in the areas of Khyber Pakhtunkhwa that are developed along the banks of River Kabul [8]. Monsoon rain started on July 27, and continued till July 29, 2010 that caused a destructive flood in the district Charsadda [9]. Flash floods during summer season are a recurrent environmental hazard in Charsadda [7]. In 2010 floods, KP was the worst affected province in Pakistan. District Charsadda in KP is exposed to risks from flooding in river Kabul and river Swat [10]. In the surrounding areas of Peshawar, Charsadda, and Nowshera, approximately 200-280 millimeters rainfall occurred. Kabul River remained in the high to very high flood stage (221,000 Cusecs) till August 8, 2010 [4]. In Charsadda, flash floods occur when the water discharges go beyond the waterway capability; therefore, within hours flash floods occur. Intensive agriculture has resulted in stacking of immense deposit in the drain. Accordingly, water carrying ability of the drain has decreased and recurrent overflow has been observed. Similarly, population stress on the land resources has lead to encroachment towards the drainage system. As a result, the watercourse has become limited and constricted with passage of time and the drain cannot pass complete discharge. Another big obstruction in the easy flow of water is the construction of narrow bridges across the drains at different locations [7].
Flood hazard maps are the first step for flood risk assessment [11- 13]. Flood damages can be reduced by applying GIS techniques to map flooded areas [14]. Flood hazard maps can be used for construction and development of flood overstressed areas [15]. The application of GIS techniques for rapid flood mapping and monitoring is a significant tool of information for decisionmakers [16]. GIS can be used to classify damage information, damage assessment monitoring, and post-disaster census information and in the evaluation of sites for reconstruction [17]. Advancement in GIS helps in quick damage assessment in flooded areas [18]. Flood and flood damage is possible to monitor by using GIS for emergency response and efficient relief work [19]. DEMs are the major basis to generate land topography [20]. It gives elevation information that is useful for various environmental purposes including hydrologic modeling and flood management planning [21]. The use of DEM has extensive applications in geomorphologic and hydrological purposes. It allows the extraction of topographic features of the earth surface and displays all natural features for both the vertical and horizontal resolutions [22]. Using the elevation of the area, flow accumulation analysis was carried out to discover the natural drainage pattern of the area and DEM was reclassified into high risk, moderate risk and low risk [23]. The terrain representation and flow direction of water that enters into an area can be obtained from DEM. DEM was used to create data on flow direction, stream definition, flow accumulation, stream segmentation in ArcGIS [24]. Important elements for drainage analysis can be evaluated using DEM [22]. Physical factors of the sub-basins were extracted from DEM [25]. The highresolution DEM is used to estimate slope, aspect, topographic wetness index, stream power index, and flow direction [26]. Drainage network is extracted by using DEM [27]. DEM was used to create flood inundation map [28].
Study area
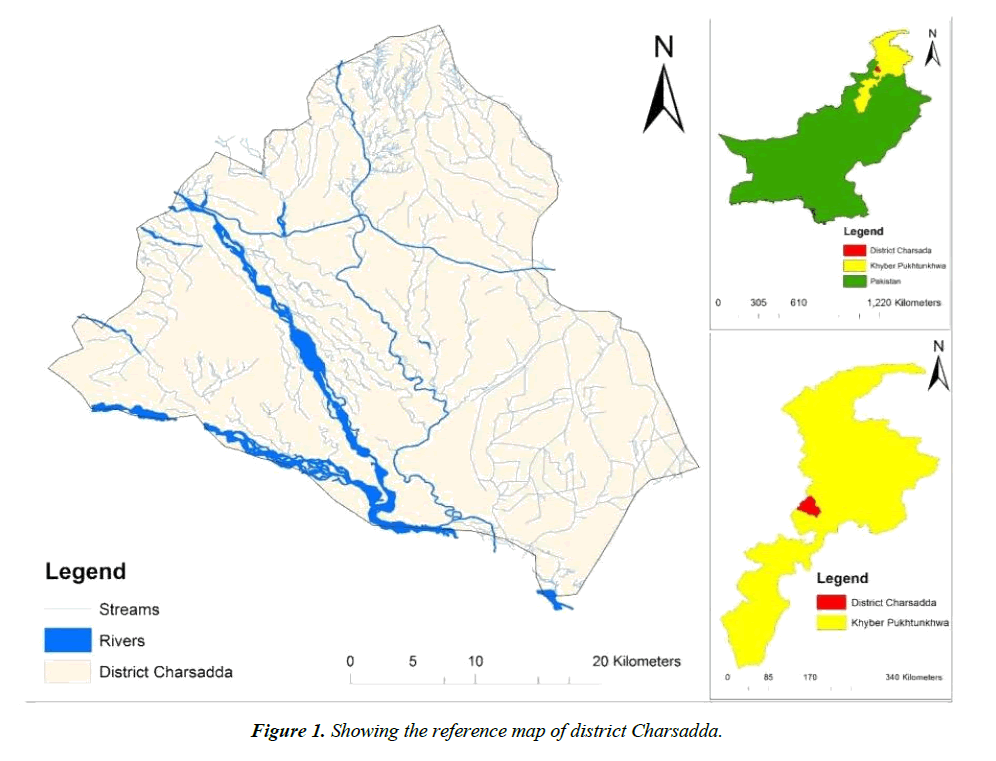
District Charsadda lies between 34°03' to 34°38' north latitudes and 71°53' to 71°28' east longitudes. The district is 32 kilometer away from Provincial Capital Peshawar and is divided into three tehsils i.e. Charsadda, Tangi, and Shabqadar. Geographically, it is divided into two sections; Hashtnagar and Doaaba. Hashtnagar means eight villages; Doaaba comprises are the area surrounded by streams and rivers [10]. The total geographical area of district Charsadda is 996 square kilometers (243753 acres). According to 1998 the total population of Charsadda was 1,022,364 [29,9,10]. The annual rainfall in district Charsadda is about 400 to 600 mm [30]. River Swat, River Kabul along with the upper and Lower Swat canals, Michini Dalazak Canal and Doaaba feeder Canal are the main sources of irrigation [31]. The three rivers then connect and join the Indus River [9]. From the west the Kabul River flows in the district of Charsadda. The Swat River is the important tributary of the Kabul River [32]. River Kabul forms the boundary between district Charsadda and district Peshawar. In the south of the district Warsak dam has been constructed on River Kabul [10]. The reference map of district Charsadda is shown in Figure 1.
Material and Methods
This study formulates a GIS based methodology for flood risk assessment. Flooded areas of district Charsadda has been evaluated using weighted overly analysis and multiple ring buffer analysis. Flood hazard risk zone maps of District Charsadda has been prepared using GIS tools. Al-Saud [22] used DEM with 30 meters precision to analyze drainage system in flood occurrence of Jeddah city in Western Saudi Coast. Riaz [8] also used 30 meters DEM for district Charsadda flood risk assessment of monsoon 2010 floods. The study also processed 30 meters DEM to make flood hazard map using ArcGIS 10.2. By giving ranks and weights to these, the weighted maps were created. Weighted Overlay Analysis method was adopted to prepare the flood hazard risk zone map. By preparing the risk zone maps, we can propose measures to reduce the risk of these repeatedly occurring floods in district Charsadda.
The reference map of Charsadda was created from the shape file using ArcGIS 10.2 software, obtained from Population Censes Organization [33]. The geological data was obtained from Geological Survey of Pakistan [34] and geological map was created using ArcGIS 10.2 software to study the characteristics of different soil layers to judge the flood water infiltration rate in the study area. The DEM of 30 meters resolution was taken from ASTER GDEM [35] in order to extract aspect, slope, flow length, flow accumulation, flow direction, basin classification, drainage points, drainage lines, catchments classification and water bodies (streams) of the study area. Multiple ring buffer analysis of streams are performed for flood hazard zoning and weightage overlay is performed for flood risk analysis of study area.
As there is no weather station in district Charsadda so to get rainfall data was difficult; therefore, research articles and reports are used to estimate the rainfall and discharge data of the last week of July to the first week of August, 2010 and compare these with the previous rainfall and discharge data of the study area. The Annual Monsoon Discharge (1000 cusecs) for River Kabul was recorded at Nowshera for a period of ten years (2001-2010) from Report-Flood Forecasting Division, Pakistan [36] was used in the study area and plotted.
Software used
The following software was used in the present study:
Arc GIS 10.2
Arc Hydro Toolbar
Microsoft Office
Result and Discussion
Catchments classification map
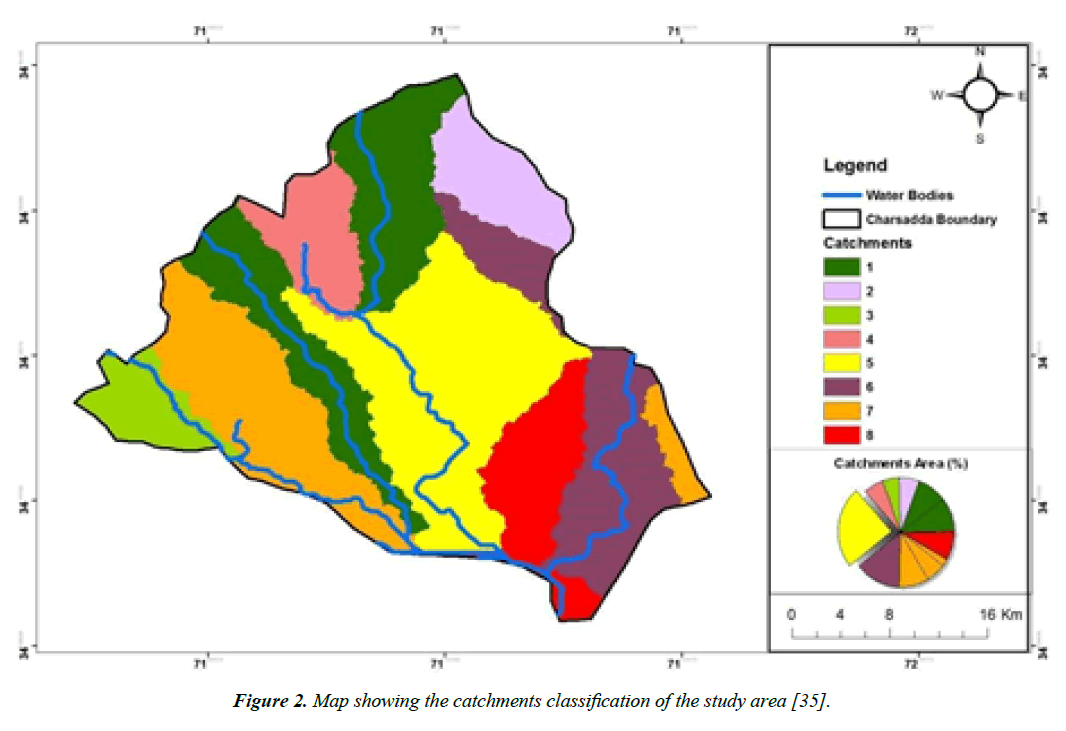
Catchment grid is produced on the basis of streams segmentations that drain the area. There are total 17 catchments in the study area. 17 catchments are then reclassified into 8 catchments. The prepared map is shown in Figure 2.
The weights are given to each class on the basis of catchment % Area (Table 1).
| Class | Area (%) | Weight |
| 1 | 19 | 7 |
| 2 | 6 | 3 |
| 3 | 5 | 2 |
| 4 | 6 | 3 |
| 5 | 24 | 8 |
| 6 | 14 | 5 |
| 7 | 17 | 6 |
| 8 | 9 | 4 |
Table 1: The weight details of catchment classification.
Geology map/soil map
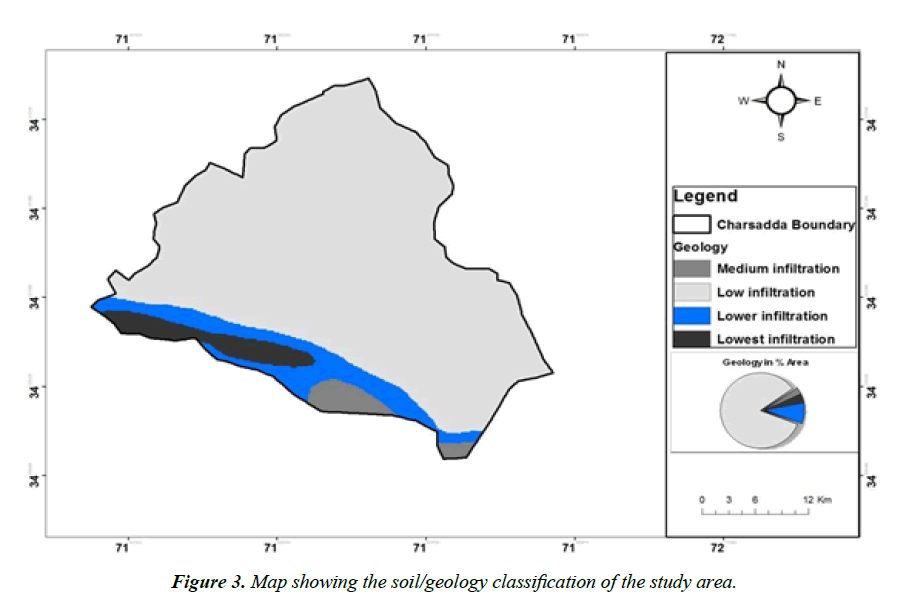
The soil plays an important role as it regularizes the quantity of water that can infiltrate into the soil, and hence the remaining quantity of water becomes flowable [37]. The structure and infiltration capacity of soils will also have an important impact on the efficiency of the soil to act as a sponge and soak up water. When the soil has lower infiltration capacity the chance of flooding increases and causes an increase in surface runoff. The geology map of the study area is shown in Figure 3. Soil map was classified on the basis of infiltration capacity. On the basis of infiltration capacity, the soil types found in the study area include medium infiltrated, low infiltrated, lower and lowest infiltrated.
The weighted soil map was prepared by assigning weights to each soil class as given in Table 2.
| Class | Soil Type | Weight |
| 1 | Medium infiltration | 2 |
| 2 | Low infiltration | 4 |
| 3 | Lower infiltration | 6 |
| 4 | Lowest infiltration | 8 |
Table 2: The geology map weight details.
Flood hazard zones
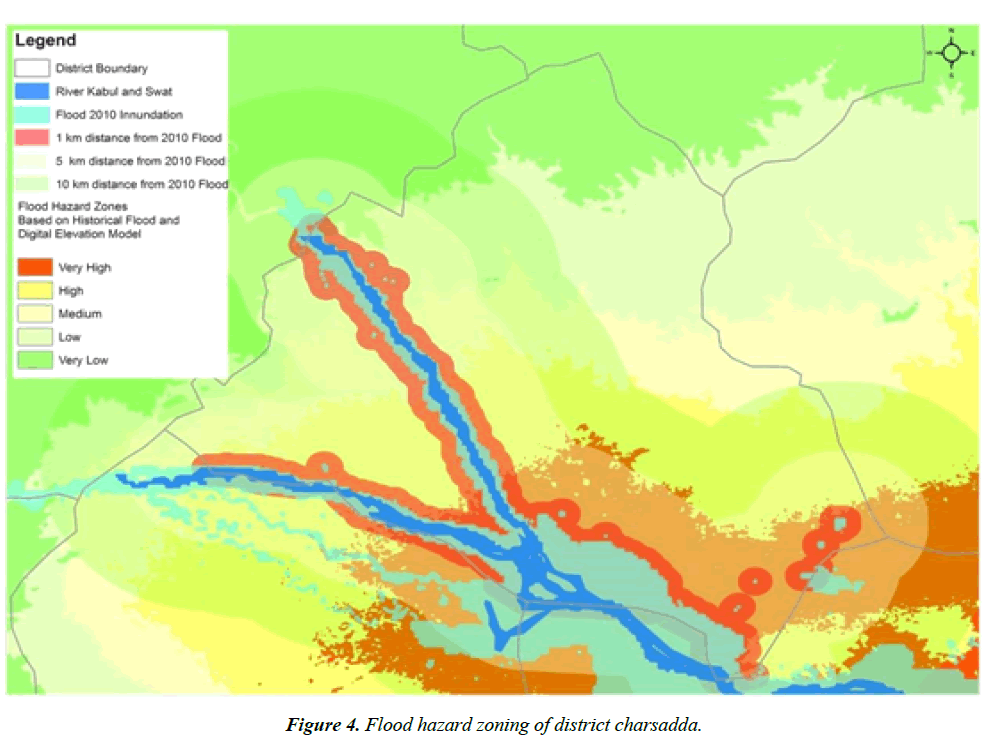
Hazard zones have been calculated using the digital elevation model and historical floods experienced by the district. Flood 2010 has been mapped and three categories have been drawn based on distance from flood inundation. The elevation of the district has been extracted from DEM and categorized accordingly. Figure 4 shows that low lying areas overlapping with the areas near to the historical flood inundations has been considered as potentially high hazard zone, others areas are categorized as high, medium, low and very low potential hazard zones.
Flood risk analysis
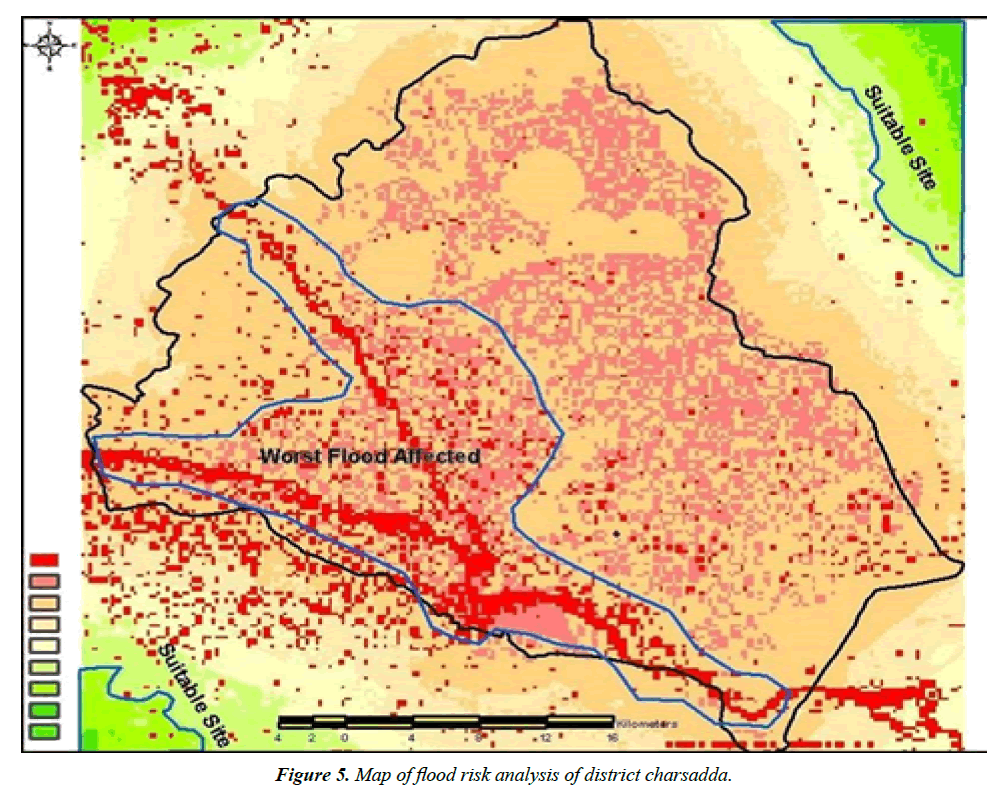
Flood risk analysis for the district Charsadda has been performed by multiplying all layers weightages. The weightages assigned to land use classes, roads, rivers, streams, and elevation of the study area has been multiplied using the raster calculator function. Flood risk analysis is performed using weightage overlay tool. The areas with dark red color as shown in Figure 5 shows high flood risk areas which can be affected severely in future flooding. Areas to north east, North West and south west are comparatively safer from flood risk and can be used as suitable places for evacuation planning.
Conclusion and Recommendations
In this research DEM along with geological data is used for flood risk assessment which suggests that GIS techniques can be effectively used to monitor and measure flood risk. The non-availability of rainfall data has been compensated by discharge data and buffer zone along the stream network. DEM can be effectively used to extract flood risk assessment parameters such as stream network, slope, flow direction, catchments etc. Pre-collision intrusive rock in the study area has very low infiltration capacity that has increased the chances of flash flooding. Intense rainfall in the monsoon season is the major cause of flooding. GIS techniques are helpful for all stakeholders for disaster management, rapid risk assessment, flood damage assessment, hazard zonation and evacuation planning. Weightage overly analysis can be successfully used for mapping flood risk zones. The research indicates that there is very high flood risk in the large catchment area and along the banks of stream network.
Better results can be obtained by having high resolution DEM. Rainfall map can give better results but there is no meteorological station in the study area. There should be at least 3 meteorological stations at different locations in the study area for flood fore-casting, reporting and measuring rainfall, and discharge data. GIS data should be made easily available for researchers.
References
- Kron W. Keynote Lecture: Flood Risk = Hazard * Exposure * Vulnerability. In: Wu B, Wang ZY, Wang G, et al.(Eds.), Flood Defense, Science Press: New York. 2002.
- Uddin K, Gurung DJ, Giriraj A, et al.Application of Remote Sensing and GIS for Flood Hazard Management: A Case Study from Sindh Province, Pakistan. American Journal of Geographic Information System. 2013;2(1):1-5.
- Adeoye NO, Ayanlade A, BabatimehinO. Climate change and menace of floods in Nigerian Cities: Socio-economic implications. Advances in Natural and Applied Sciences. 2009;3(3):369-77.
- Ahmad H, Bokhari JB, Siddiqui QTM. Flashflood risk assessment in Pakistan.Pakistan Engineering Congress, 71st Annual Session Proceedings. 2011;Paper No.707:696-708.
- Alcantara-Ayala I. Geomorphology, natural hazards, vulnerability and prevention of natural disasters in developing countries. Geomorphology. 2002;47:107-24.
- http://www.unisdr.org/eng/about_isdr/bd-lwr-2004-eng.htm
- Khan AR, Nawaz A.Analysis of 2010-flood causes, nature and magnitude in the Khyber Pakhtunkhwa, Pakistan. Natural hazards. 2013;66(2):887-904.
- RiazS. Flood Hazard Assessment during Monsoon Floods of 2010: Case Study of Charsadda and Nowshera Districts. International Poster Journal of Science and Technology. 2012;1(1):7.
- http://www.faisalenterprises.com/files/File/Charsadda_Flood_Assessment_report_Aug_01_2010.pdf.
- Brivo PA, Colombo R, Maggi M, Tomasoni R. Integration of Remote Sensing Data and GIS for Accurate Mapping of Flooded Areas. Int J Remote Sens2002;23(3):429-41.
- Islam MK, SadoK. Flood Hazard Assessment in Bangladesh Using NOAA AVHRR Data with Geographical Information System. HydrolProc2000;14:605-20.
- Islam MK, SadoK. Development of Flood Hazard Maps of Bangladesh Using NOAA-AVHRR Images with GIS. HydrologSci J 2000;45(3):337-55.
- http://www.saudigis.org/FCKFiles/File/8th_GIS_Program/Papers/31_Khaled_Kheder.pdf
- http://www.isprs.org/proceedings/XXXVIII/7-C4/203_GSEM2009.pdf
- Benz UC, Hoffmann P, WillhauckG, et al. Multiresolution, object-oriented fuzzy analysis of remote sensing data for GIS-ready information. Journal of Photogrammetry and Remote Sensing. 2004;58:239-58.
- AzazLK. Using remote sensing and GIS for damage assessment after flooding, the case of Muscat, Oman after Gonu tropical cyclone2007: Urban planning perspective. 2010;879-88.
- KhannaRK, AgrawalCK, Kumar P. Remote Sensing and GIS Applications in flood Management.
- UddinK, ShresthaB. Assessing Flood and Flood Damage Using Remote Sensing: A Case Study from Sunsari, Nepal, 4th International Conference on Water & Flood Management (ICWFM-2011). 2011;293-301.
- ForkuoEK. Digital Terrain Modelling in a GIS Environment. The International Archives of Photogrammetry. Remote Sensing and Spatial Information Sciences. 2008;37:1023-29.
- McDougall K, Liu X, Basnet B, et al. Evaluation of current DEM Accuracy for Condamine Catchment. Proceedings of the 8th International Symposium on Spatial Accuracy Assessment in Natural Resources and Environmental Sciences Shanghai. PR China, June 25-27. 2008;71-78.
- Al Saud M. Use of Remote Sensing and GIS to Analyze Drainage System in Flood Occurrence, Jeddah- Western Saudi Coast, Drainage Systems. 2012;139-64.
- Ismail M,Saanyol I. Application of Remote Sensing (RS) and Geographic Information Systems (GIS) in flood vulnerability mapping: Case study of River Kuduna. International Journal of Geomantics and Geosciences. 2013;3:618-27.
- KonaduDD, Fosu C. Digital Elevation Models and GIS for Watershed Modelling and Flood Prediction- A Case Study of Accra Ghana. Appropriate Technologies for Environmental Protection in the Developing World. 2009;325-32.
- LiqunC, Changming L, Fanghua H, et al. Macro - scale Hydrologic Simulation of the Source Regions of yellow river based on GIS. Proceedings of the 2nd International Yellow River forum on keeping healthylife of the river. 2005;3:196-201.
- Terence L,SuzanaD,MargareS. Integration of multicriteria evaluation and cellular automata methods for landslide simulation modeling. GeomaticsNatural Hazards & Risk. 2013;4(4):355-75.
- Rueda A, Noguera JM, Martinez-Cruz C. A flooding algorithm for extracting drainage networks from unprocessed digital elevation models. Computers & geosciences. 2013;59:116-23.
- Chau VN, JohnH, SueC, et al. Using GIS to map impacts upon agriculture from extreme floods in Vietnam. Applied geography. 2013;41:65-74.
- http://census.gov.pk/
- http://prr.hec.gov.pk/Chapters/1202S-3.pdf
- A Brief Profile of Charsadda, Small & Medium Enterprise Development Authority (SMEDA), Government of Pakistan. 2009.
- http://pakresponse.info/MapDataCenter/GISData.aspx
- Hewitt K, Burton I. The hazardousness of a place: A regional geology of damaging events, University of Toronto. Department of Geography Research Publication. 1971;5:154.
- http://gdem.ersdac.jspacesystems.or.jp/
- Report-Flood Forecasting Division, Pakistan.
- Nicholls N, Wong KK. Dependence of Rainfall Variability on Mean Rainfall, Latitude, and the Southern Oscillation. Journal of Climate. 1990;3:163-170.
- Lowery B, Hickey WJ, Arshad MA, et al. Soil water parameters and soil quality. In: Doran JW, Jones AJ, editors. Methods for assessing soil quality:Madison WI. 1996.143-45pp.
- http://www.gsp.gov.pk/
