Research Article - Journal of Clinical Dentistry and Oral Health (2022) Volume 6, Issue 6
evaluation and comparison of lips, nose, chin and chin-throat angle in patients with different mandibular divergences
Kamble A*KVG Dental College & Hospital Sullia, Karnataka, India
- *Corresponding Author:
- Kamble A
KVG Dental College & Hospital Sullia
Karnataka, India
E-mail: apekshadkamble19@gmail.com
Received: 01-November-2022, Manuscript No. AACDOH-22-79132; Editor assigned: 03-November-2022, PreQC No. AACDOH-22-79132 (PQ); Reviewed: 17-November-2022, QC No. AACDOH-22-79132 (QC); Revised: 21-November-2022, Manuscript No. AACDOH-22-79132 (R); Published: 28-November-2022, DOI: 10.35841/aacdoh-6.6.126
Citation: Kamble A. Evaluation and comparison of lips, nose, chin and chin-throat angle in patients with different mandibular divergences: A cephalometric study. J Clinic Dent Oral Health. 2022;6(6):126
Abstract
Introduction: In orthodontics, facial harmony is defined by the patient's soft tissue profile, which is controlled by morphologic connections and proportions of the nose, lips, and chin. Aim: To evaluate thickness of lips, nose, chin and chin-throat angle in different mandibular divergent patterns. Materials and method: Pre-treatment lateral cephalograms of patients aged 16-25 years were obtained they were determined horizontal or vertical growers on the basis of divergence of planes. The cephalometric measurements were obtained after tracing the cephalogram. Results: The intergroup contrast of all three groups were statistically significant for upper lip width (p=0.001) and lower lip width (p=0.001) the chin thickness was maximum in hypo divergent i.e. 11.07 ± 1.5. In norm divergent group 10.12 ± 1.8 and hyper divergent group 09.84 ± 2.2 Hypo divergent had the highest chin-throat angle (88.02° ± 3.01°), followed by norm divergent (86.44° ± 3.4°), and hyper divergent (78.74° ± 6.3°) Conclusion: Upper and lower lip thickness were maximum in hypo divergent and minimum in hyper divergent. Nose thickness was insignificant. Chin thickness was maximum in hypo divergent and least in hyper divergent. Chin-throat angle was maximum in hypo divergent and minimum in hyper divergent subjects.
Keywords
Mandibular divergences, Cephalograms, Throat angle, Esthetics.
Introduction
The perception or appreciation of beauty is described as esthetics. Esthetics has evolved throughout time to incorporate emotive embellishments such as beauty and attractiveness judgments, as well as the accompanying psychophysiological patterns of arousal [1]. Physical beauty has an impact on people's perceptions of others' personalities, as well as their expectations for success in many areas of adult life (occupational prestige, personal happiness) [2]. Chin-throat angle is also identified as cervico-mental angle or sub mentalcervical angle. Although severely forwardly or backwardly directed chins may have an influence on its perception, throat length or extension does not reflect the link between throat and chin The relationship between hard tissues (teeth and bone) and their interaction with surrounding soft tissues is the subject of most cephalometric investigations (chin, nose, and lips). The key to an aesthetic & pleasing facial appearance is a proportionate relationship amongst dissimilar facial structures. Such evaluations overlook the impact of the chin-throat connection on the profile &, as a result, treatment, perhaps due to the fact that this connection cannot be changed with orthodontics. Based on clinical and anthropometric normative data, chin-throat assessment is increasingly frequent in plastic surgery, and it may be done directly on patients or on photos utilizing well-defined soft tissue landmarks. The most wellknown anthropometric age-related data on face dimensions came from Farkas. The chin's relationship to the rest of the face is defined by many factors: The purpose of the study is to evaluate and compare lips, nose, chin thickness and chin throat angle in different mandibular divergence patterns, as the softtissue profile plays a crucial role in orthodontic considerations. Treatment may alter into the orthognathic and cosmetic surgery based on disassociation between the facial appearance and the underlying bony structures; hence it is important to study soft tissue thickness. To investigate the impact of diverse mandibular diverging patterns on soft tissues, researchers examined upper lip thickness, soft tissue chin, and lengthen individuals with various mandibular divergent patterns [3-16].
Aim and Objectives
Aim
To evaluate thickness of lips, nose, chin and chin-throat angle in different mandibular divergent patterns.
Objectives
To compare the thickness of lips, nose, chin and chin-throat angle in normodivergent and hypodivergent patterns.
Materials and Method
Methods of selection of study subjects
Inclusion criteria
Subjects within Age group of 16-25 yrs.
ANB angle 0-4o.
Subjects with average, horizontal, vertical growth pattern.
Full complement of teeth except third molar.
Exclusion criteria
History of trauma and facial asymmetry.
History of prior orthognathic surgery or orthodontic treatment.
History of craniofacial anomalies and medically compromised subjects.
Withdrawal criteria
Patients not willing to take part in the study.
Patients who want to leave the study at any point during the study.
Sampling technique
Using convenience sampling technique, 150 untreated subjects with different facial divergence pattern with age ranging from 16–25 years were selected from outpatient. Department of Orthodontics and Dentofacial Orthopedics. These subjects wanted to seek orthodontic treatment and also satisfied the inclusion criteria for the study. Subjects were divided into sub-groups based on Tweed’s analysis and FMA angles.
FMA angle 23o-28o=Normodivergent
<23°= Hypodivergent
>28°=Hyperdivergent
The parameters of interest were compared across 150 subjects (75 male and 75female) with different mandibular divergences stated as under:
Group 1: Normodivergent Subject (N=50)
Group 2: Hypo divergence Subject (N=50)
Group 3: Hyper divergence Subject (N=50)
Methods of measurement
Pre-treatment lateral cephalograms of patients aged 16-25 years were obtainedfor the study. Good definition of both hard and soft tissue landmarks, molars in maximum intercuspation with lips unstrained in natural head position are check listed on lateral cephalogram. They were determined horizontal or vertical growers on the basis of divergence of planes at the Department of Orthodontics & Dentofacial Orthopedics. The cephalometric measurements were obtained after tracing the cephalogram [17].
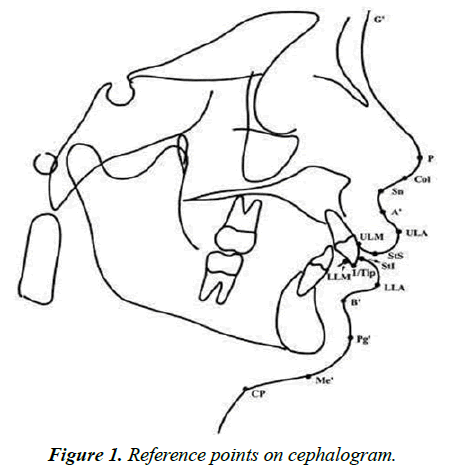
Reference points on cephalogram
LS-Labrale Superius. The upper lip's mucocutaneous boundary is indicated by a point.
SN-Sub Nasale. It is the point where the upper lip meets the columella (nasal septum) in the midsagittal plane.
POG-Pogonion. It is the anterior point on the chin.
LI-Labrale Inferius. It is the midpoint of the lower lip's lower margin.
ME-Menton. The most inferior point on the mandibular symphysis of the mandible.
ME’: It is the soft tissue Menton.
GN-Gnathion. The lowest most anterior midline point on the symphysis of the mandible.
POG-Soft tissue Pogonion.
CP-Cervical point. The innermost point between the neck and sub mental area.
GN’-Soft tissue Gnathion (Figure 1).
Results
For the present study, Patient visiting the Department of Orthodontics And Dentofacial Orthopaedics for seeking orthodontic treatment was screened as per the exclusion and inclusion criteria and 150 subjects were involved. The information regarding demographic data can be obtained in Table 1.
| Age | ||
| Range in years | Mean ± SD | Total N(%) |
| 16-25 | 20.05 ± 3.1 | 150 (100) |
| Gender | ||
| N (%) | Total N(%) | |
| Male | 75 (50) | 150 (100) |
| Female | 75 (50) | |
Table 1. Descriptive demographic.
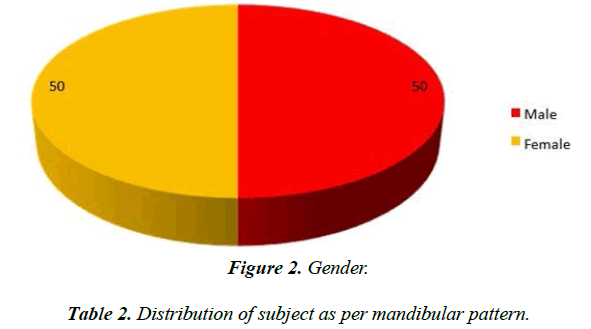
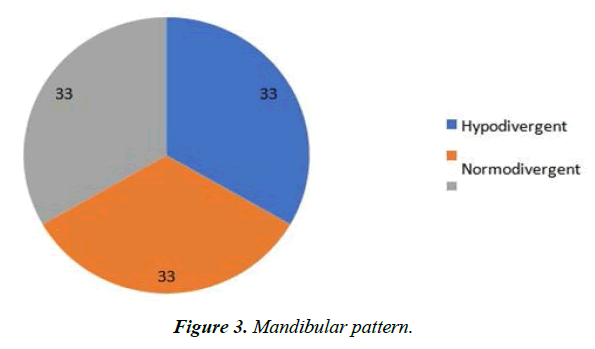
The subjects belonged to the age ranging from 16 to 25 years (20.05 ± 3.1). These 150 subjects had 1:1 male-female ratio (75 each) (Figure 2). Furthermore, 50 each were distributed for hypodivergent, normodivergent and hyperdivergent (Table 2 and Figure 3).
| N (%) | Total N(%) | |
|---|---|---|
| Hypodivergent | 50 (33) | 150 (100) |
| Normodivergent | 50 (33) | |
| Hyperdivergent | 50 (33) |
Table 2. Distribution of subject as per mandibular pattern.
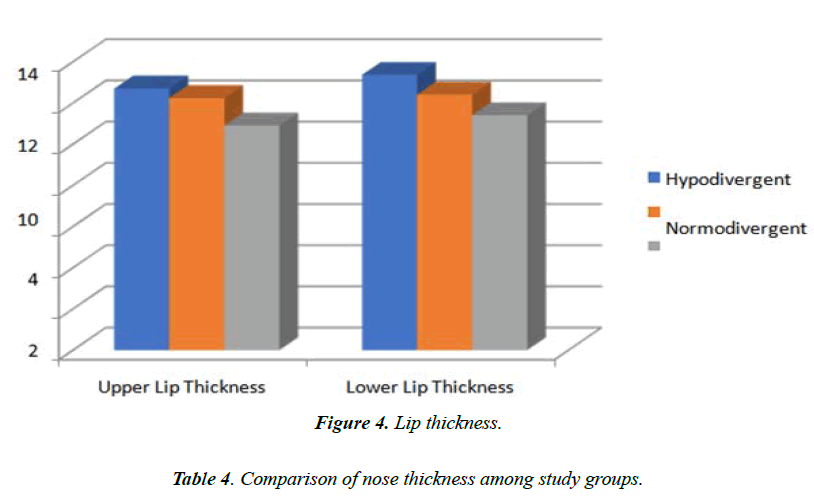
The intergroup contrast of all three groups were statistically significant for upper lip width (p=0.001) and lower lip width (p=0.001) as noted in Table 3 and Figure 4. One- way Anova test was run to evaluate this statistical significance. The hyperdivergent readings were found to be least in all groups whereas the measurements for hypodivergent were maximum comparatively.
| Mean ± SD | SE | F-value | p-value | |
|---|---|---|---|---|
| Upper lip thickness | ||||
| Hypodivergent | 12.74 ± 2.3 | 0.32 | ||
| Normodivergent | 11.49 ± 2.2 | 0.29 | ||
| Hyperdivergent | 10.92 ± 1.08 | 0.15 | 13.1 | <0.001* |
| Lower lip thickness | ||||
| Hypodivergent | 13.36 ± 1.8 | 0.3 | ||
| Normodivergent | 12.4 ± 1.5 | 0.24 | ||
| Hyperdivergent | 11.4 ± 1.4 | 0.21 | 20.01` | <0.001* |
| Test applied: One-way ANOVA | ||||
| *p<0.05: Significant | ||||
| p<0.001: Extremely significant | ||||
Table 3. Comparison of upper and lower lip among study groups.
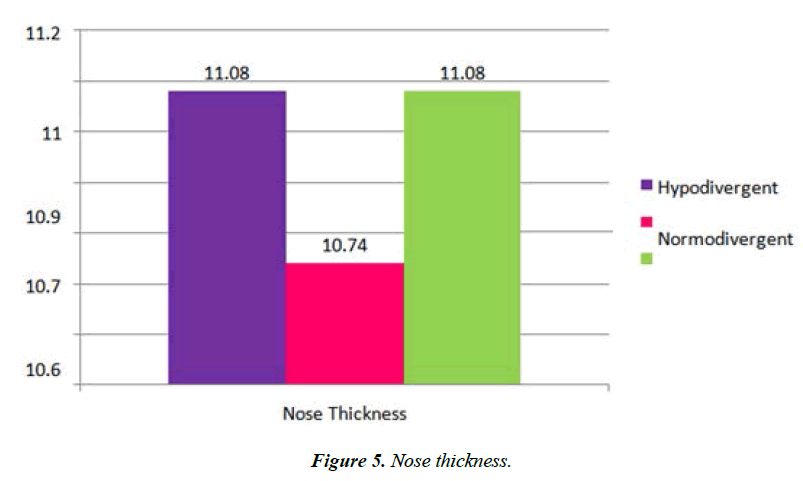
When the nose thickness of all three groups were compared, statistical nonsignificant result was obtained (p=0.31). The intergroup comparison mean of 11.08 ± 1.3 for hypodivergent mandible, 10.74 ± 1.04 for normodivert and 10.74 ± 1.04 for hyperdivergent was obtained (Table 4 and Figure 5).
| Mean ± SD | SE | F-value | p-value | |
|---|---|---|---|---|
| Nose thickness | ||||
| Hypodivergent | 11.08 ± 1.3 | 0.17 | ||
| Normodivergent | 10.74 ± 1.04 | 0.15 | ||
| Hyperdivergent | 11.08 ± 1.3 | 0.18 | 1.2 | 0.31 |
| Test applied: One-way ANOVA | ||||
| *p<0.05: Significant | ||||
| p<0.001: Extremely significant | ||||
Table 4. Comparison of nose thickness among study groups.
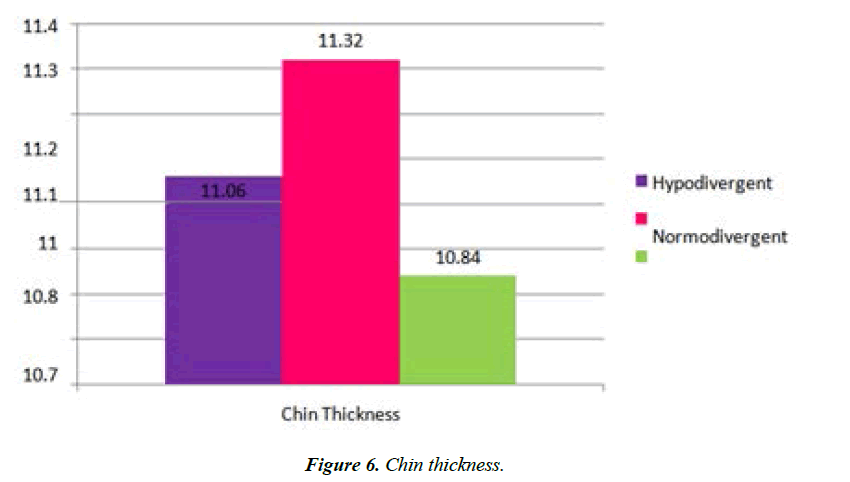
When the chin thickness of all three groups were compared, statistical significant result was obtained (p=0.05). The intergroup comparison mean of 11.07 ± 1.5 for hypodivergent mandible, 10.12 ± 1.8 for normodivert and 09.84 ± 2.2 for hyperdivergent was obtained (Table 5 and Figure 6).
| Mean ± SD | SE | F-value | p-value | |
|---|---|---|---|---|
| Chin thickness | ||||
| Hypodivergent | 11.07 ± 1.5 | 0.25 | 1.05 | 0.05* |
| Normodivergent | 10.12 ± 1.8 | 0.19 | ||
| Hyperdivergent | 09.84 ± 2.2 | 0.23 | ||
| Test applied: One-way ANOVA | ||||
| *p<0.05: Significant | ||||
| p<0.001: Extremely significant | ||||
Table 5. Comparison of chin thickness among study groups.
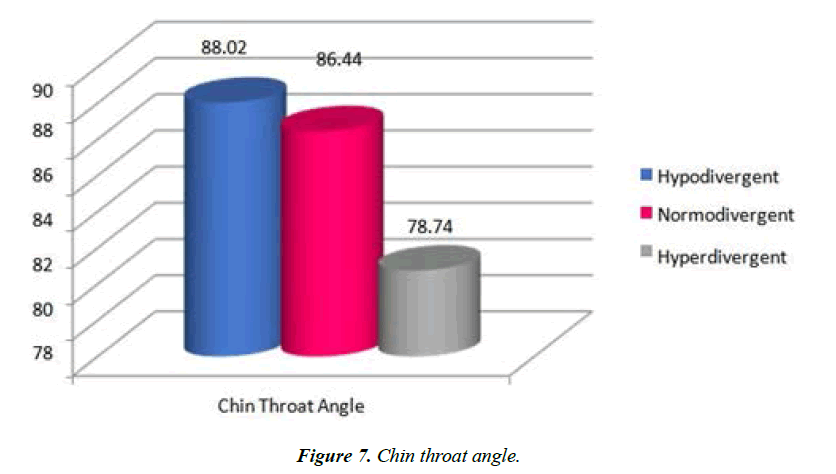
The intergroup contrast of all three groups were statistically significant for chin throat angle (p=0.001) as noted in Table 6 and Figure 7. One- way Anova test was run to evaluate this statistical significance. The hyperdivergent readings were found to be least in all groups whereas the measurements for hypodivergent were maximum comparatively.
| Mean ± SD | SE | F-value | p-value | |
|---|---|---|---|---|
| Chin throat angle | ||||
| Hypodivergent | 88.02 ± 3.01 | 0.43 | 61.5 | <0.001* |
| Normodivergent | 86.44 ± 3.4 | 0.47 | ||
| Hyperdivergent | 78.74 ± 6.31 | 1.01 | ||
| Test applied: One-way ANOVA | ||||
| *p<0.05: Significant | ||||
| p<0.001: Extremely significant | ||||
Table 6. Comparison of chin throat angle among study groups.
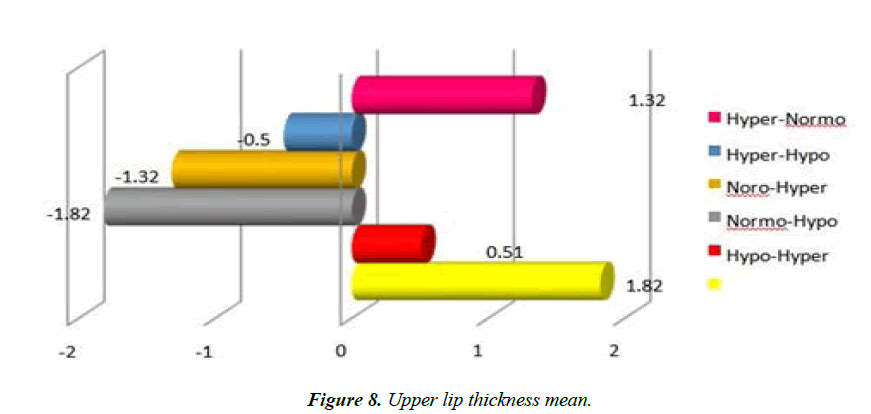
On running intergroup contrast between two groups, statistical significance was obtained in terms of upper lip thickness at various levels Table 7 and Figure 8. Both hypo and hyper divergent groups were statistically significant (p=0.001) when compared with normodivergent group running post-hoc tukey test.
| Mean Difference | SE | p-value | |
|---|---|---|---|
| Hypodivergent-Normodivergent | 1.82 | 0.41 | <0.001* |
| Hypodivergent-Hyperdivergent | 0.51 | 0.36 | |
| Normodivergent-Hypodivergent | -1.82 | 0.001* | |
| Normodivergent-Hyperdivergent | -1.32 | <0.001* | |
| Hyperdivergent-Hypodivergent | -0.5 | 0.36 | |
| Hyperdivergent-Normodivergent | 1.32 | 0.001* | |
| Test applied: Post-hoc Tukey Test | |||
| *p<0.001: Extremely significant | |||
| p<0.05: Significant | |||
Table 7. Intergroup multiple comparisons: Upper lip thickness.
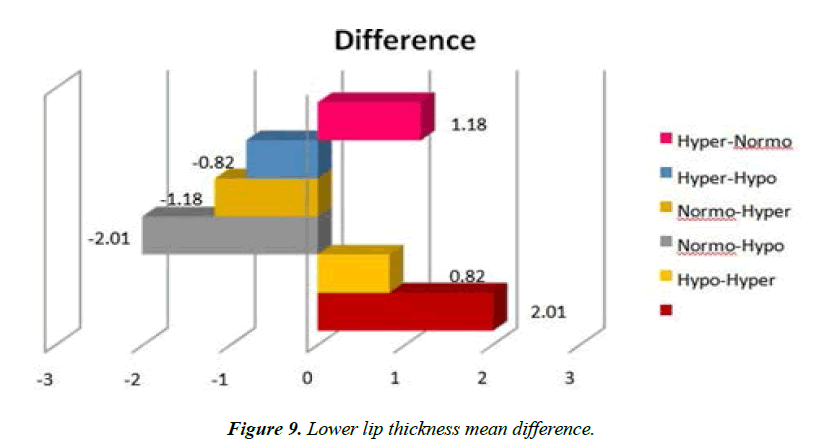
On running intergroup contrast between two groups, statistical significance was obtained in terms of lower lip thickness at various levels Table 8 and Figure 9. Both hypo and hyper divergent groups were statistically significant (p=0.001) when compared with normodivergent group running post-hoc tukey test.
| Mean Difference | SE | P-value | |
|---|---|---|---|
| Hypodivergent-Normodivergent | 2.01 | 0.32 | <0.001* |
| Hypodivergent-Hyperdivergent | 0.82 | 0.03 | |
| Normodivergent-Hypodivergent | -2.01 | <0.001* | |
| Normodivergent-Hyperdivergent | -1.18 | 0.001* | |
| Hyperdivergent-Hypodivergent | -0.82 | 0.03 | |
| Hyperdivergent-Normodivergent | 1.18 | 0.001* | |
| Test applied: Post-hoc Tukey Test | |||
| *p<0.00: Extremely significant | |||
| p<0.05: Significant | |||
Table 8. Intergroup multiple comparisons: Lower lip thickness.
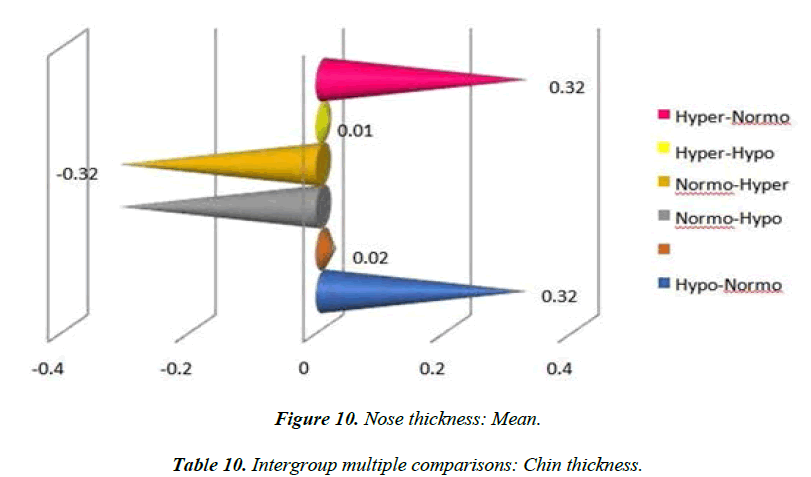
On running intergroup contrast between two groups, no statistical significance was obtained in terms of nose thickness Table 9 and Figure 10.
| Mean Difference | SE | p-value | |
|---|---|---|---|
| Hypodivergent-Normodivergent | 0.32 | 0.24 | 0.37 |
| Hypodivergent-Hyperdivergent | 0.02 | 1.01 | |
| Normodivergent-Hypodivergent | -0.32 | 0.37 | |
| Normodivergent-Hyperdivergent | -0.32 | 0.37 | |
| Hyperdivergent-Hypodivergent | 0.01 | 1.01 | |
| Hyperdivergent-Normodivergent | 0.32 | 0.38 | |
| Test applied: Post-hoc Tukey Test | |||
| *p<0.05: Significant | |||
| p<0.001: Extremely significant | |||
Table 9. Intergroup multiple comparisons: Nose thickness.
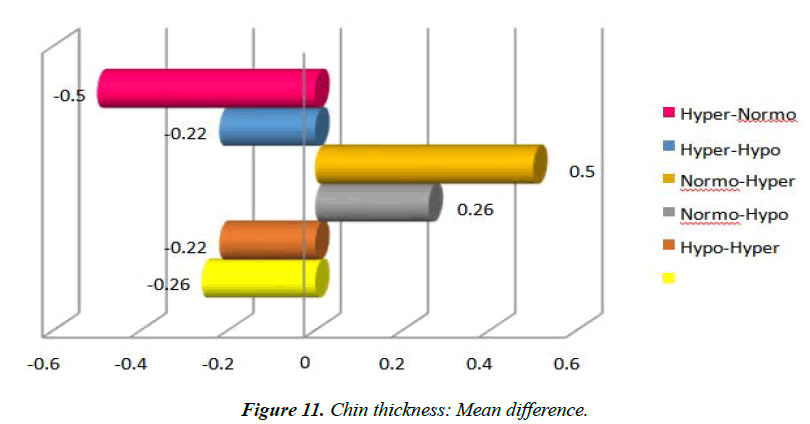
On running intergroup contrast between two groups of groups, statistical significance was obtained in terms of chin thickness at various levels Table 10 and Figure 11. In contrast to other result obtained, other than the hyper-normo divergent comparison, other groups were statistically significant (p=0.001) by running post-hoc tukey test.
| Mean Difference | SE | p-value | |
|---|---|---|---|
| Hypodivergent-Normodivergent | -0.26 | 0.33 | 0.05* |
| Hypodivergent-Hyperdivergent | -0.22 | 0.001* | |
| Normodivergent-Hypodivergent | 0.26 | 0.05* | |
| Normodivergent-Hyperdivergent | 0.5 | 0.32 | |
| Hyperdivergent-Hypodivergent | -0.22 | 0.001* | |
| Hyperdivergent-Normodivergent | -0.5 | 0.32 | |
| Test applied: Post-hoc Tukey Test | |||
| *p<0.05: Significant | |||
| p<0.001: Extremely significant | |||
Table 10. Intergroup multiple comparisons: Chin thickness.
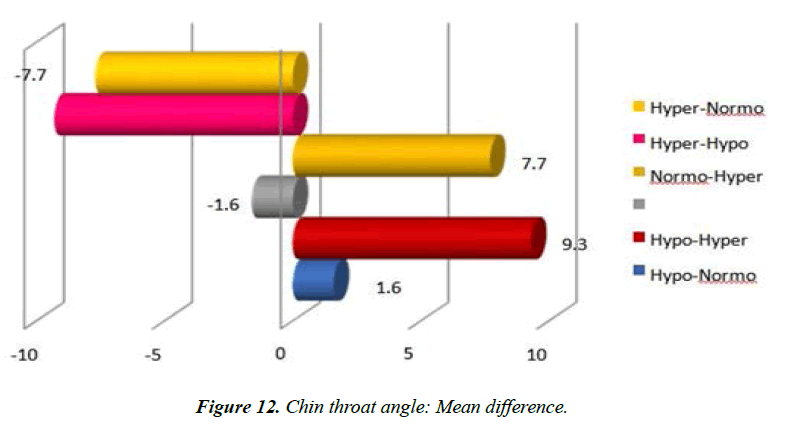
On running intergroup contrast between two groups of groups, statistical significance was obtained in terms of lower lip thickness at various levels Table 11 and Figure 12. In contrast to other result obtained, other than the hypo-normo divergent comparison, other groups were statistically significant (p=0.001) by running post-hoc tukey test.
| Mean Difference | SE | p-value | |
|---|---|---|---|
| Hypodivergent-Normodivergent | 1.6 | 0.8 | 0.18 |
| Hypodivergent-Hyperdivergent | 9.3 | <0.001* | |
| Normodivergent-Hypodivergent | -1.6 | 0.18 | |
| Normodivergent-Hyperdivergent | 7.7 | <0.001* | |
| Hyperdivergent-Hypodivergent | -9.3 | <0.001* | |
| Hyperdivergent-Normodivergent | -7.7 | <0.001* | |
| Test applied: Post-hoc Tukey Test | |||
| *p<0.001: Extremely significant | |||
| p<0.05: Significant | |||
Table 11. Multiple comparisons: Chin throat angle.
Discussion
Lip thickness
In the present study, upper lip thickness was highest in hypodivergent mandible, 12.74 ± 2.3. Likewise, lower lip thickness was 13.36 ± 1.8. The upper lip thickness was minimum in hyperdivergent group. This was true for lower lip readings recorded too11.4 ± 1.4. The findings obtained in study are in accordance with our study where hypodivergent group showed maximum thickness in upper lip. Whereas others observed women to have thicker soft tissue in lower lip in their study.
In our research, we discovered that the hypodivergent group had the thickest upper lip. This is consistent with others findings, however the lower lip thickness in their research was lower among short-face people.
However, there was no big variation in upper lip measurement across the 3 face varieties in our study. The hypodivergent group's mean values were somewhat higher than the hyperdivergent groups, the variation was statistically significant.
Nose thickness
In present study, both hypo and hyper divergent reading was 10.08 ± 1.3 whereas normodivergent reading was 11.74 ± 1.04. Male predilection over females in terms of nose thickness. Similar findings were observed previous studies.
Chin thickness
The chin thickness was maximum in hypodivergent i.e. 11.07 ± 1.5. Followed by normodivergent group 10.12 ± 1.8 and hyperdivergent group 09.84 ± 2.2. The findings obtained in earlier studies are in accordance with our study where hypodivergent group showed maximum thickness.
Chin-throat angle
In the study, the chin-throat angle ranged from 78 to 88 degrees in hypodivergent, hyperdivergent, and normodivergent participants. Hypodivergent had the highest chin- throat angle (88.02° ± 3.01°), followed by normodivergent (86.44° ± 3.4°), and hyperdivergent (78.74° ± 6.3°) in conditions of small facial angle, whereas a protrusive face had the lowest (78.74° ± 6.3°). Our findings are consistent with Stoner,66 with a bigger angle in the hypodivergent group indicating a protrusive face and a lower angle in the hyperdivergent group suggesting a retrieve face.
The hyperdivergent group had the smallest mean distance (10.84 ± 2.1 millimeter), followed by the hypodivergent group (11.06 ± 1.8), and the normodivergent group had the largest (11.32 ± 1.8). Our findings were in contrast to those of other studies who found that the values of soft tissue thickness for both women & men were lowest in high angle group. The values were statistically and substantially lower in the high angle group for women. Furthermore, the values of soft tissue thickness of low & normal angle groups were identical. When the area of therapeutic action is limited to the lower face, the chin-throat connection, together with the location of the chin relative to the nose & lips, allows practitioners to establish the chin extension in the facial profile, which is a significant step [18-30].
Conclusion
Upper and lower lip thickness was maximum in hypodivergent and minimum in hyperdivergent subjects.
Nose thickness was insignificant among the three divergences.
Chin thickness was maximum in hypodivergent and least in hyperdivergentsubjects.
Chin-throat angle was maximum in hypodivergent and minimum in hyperdivergent subjects.
References
- Valentine CW. The experimental psychology of beauty. London Methuen Ltd1962.
- Dion K, Berscheid E, Walster E. What is beautiful is good. J Pers Soc Psychol. 1972;24(3):285.
- https://www.wiley.com/enus/Stevens%27+Handbook+of+Experimental+Psychology%2C+Volume+4%2C+Methodology+in+Experimental+Psychology%2C+3rd+Edition-p-9780471378884
- Moore AW. A critique of orthodontic dogma. Angle Orthod.1969;39(2):69-82.
- Prabu NM, Kohila K, Sivaraj S, et al. Appraisal of the cephalometric norms for the upper and lower lips of the South Indian ethnic population. J Pharm Bioallied Sci. 2012;4(2):S136.
- Subtelny JD. A longitudinal study of soft tissue facial structures and their profile characteristics, defined in relation to underlying skeletal structures. Am J Orthod. 1959;45(7):481-507.
- Burstone CJ. Lip posture and its significance in treatment planning. Am J Orthod. 1967;53(4):262-284.
- Schudy FF. Vertical growth versus anteroposterior growth as related to function and treatment. Angle Orthod. 1964;34(2):75-93.
- Björk A. Prediction of mandibular growth rotation. Am J Orthod. 1969;55(6):585-599.
- Ramos AL, Sakima MT, Pinto AS, et al. Upper lip changes correlated to maxillary incisor retraction—a metallic implant study. Angle Orthod. 2005;75(4):499–505.
- Wen-Ching Ko E, Figueroa AA, Polley JW. Soft tissue profile changes after maxillary advancement with distraction osteogenesis by use of a rigid external distraction device: A 1-year follow-up. J Oral Maxillofac Surg. 2000;58(9):959– 969.
- Haddad RV, Ghafari JG. Chin-throat anatomy: Normal relations and changes following orthognathic surgery and growth modification. Angle Orthod. 2017;87(5):696-702.
- Jacobson A, Vlachos C. Soft tissue evaluation. In: Jacobson A, Jacobson RL. Radiographic cephalometry—From basics to 3-D imaging. 2nd Ed. Chicago, Ill: Quintessence Publishing Co 2006; 205–217.
- Ricketts RM. Esthetics, environment, and the law of lip relation. Am J Orthod. 1968;54(4):272–289.
- Mommaerts MY, Marxer H. A cephalometric analysis of the long-term, soft tissue profile changes which accompany the advancement of the mandible by sagittal split ramus osteotomies. J Cranio-Maxillofac Surg. 1987;15:127–131.
- Farkas LG. Anthropometry of the head and face. New York, Raven Press 1994.
- Legan HL, Burstone CJ. Soft tissue cephalometric analysis for orthognathic surgery. J Oral Surg. 1980;38(10):744–751.
- Arnett GW, Jelic JS, Kim J, et al. Soft tissue cephalometric analysis: Diagnosis and treatment planning of dentofacial deformity. Am J Orthod Dentofac Orthop. 1999;116(3):239– 253.
- Worms FW, Isaacson RJ, Speidel TM. Surgical orthodontic treatment planning: Profile analysis and mandibular surgery. Angle Orthod. 1976;46(1):1-25.
- Bergman RT. Cephalometric soft tissue facial analysis. Am J Orthod Dentofac Orthop. 1999;116(40:373–389.
- Ellenbogen R, Karlin JV. Visual criteria for success in restoring the youthful neck. Plast Reconstr Surg. 1980;66:826–837
- Moreno A, Bell WH, You ZH. Esthetic contour analysis of the submental cervical region: A study based on ideal subjects and surgical patients. J Oral Maxillofac Surg. 1994;52(7):704– 713.
- Sommerville JM, Sperry TP, BeGole EA. Morphology of the submental and neck region. Int J Adult Orthod Orthognath Surg. 1988;3:97–106.
- Naini FB, Cobourne MT, McDonald F, et al. Submental-cervical angle: Perceived attractiveness and threshold values of desire for surgery. J Oral Maxillofac Surg. 2016;15(4):469–477.
- Jeelani W, Fida M, Shaikh A. Facial soft tissue analysis among various vertical facial patterns. J Ayub Med Coll Abbottabad. 2016;28(1):29-34.
- Kamak H, Celikoglu M. Facial soft tissue thickness among skeletal malocclusions: Is there a difference?. Korean J Orthod. 2012;42(1):23-31.
- Feres MFN, Hitos SF, Paulo de Sousa HI, et al. Comparison of soft tissue size between different facial patterns. Dental Press J Orthod. 2010;15(4):84-93.
- Macari AT, Hanna AE. Comparisons of soft tissue chin thickness in adult patients with various mandibular divergence patterns. Angle Orthod. 2014;84(4):708–714.
- Celikoglu M, Buyuk SK, Ekizer A, et al. Assessment of the soft tissue thickness at the lower anterior face in adult patients with different skeletal vertical patterns using cone-beam computed tomography. Angle Orthod. 2015;85(2):211–217.
- Nanda RS, Ghosh J. Facial soft tissue harmony and growth in orthodontic treatment. Semin Ortho. 1995;1(2):67-81.
Indexed at, Google Scholar, Cross Ref
Indexed at, Google Scholar, Cross Ref
Indexed at, Google Scholar, Cross Ref
Indexed at, Google Scholar, Cross Ref
Indexed at, Google Scholar, Cross Ref
Indexed at, Google Scholar, Cross Ref
Indexed at, Google Scholar, Cross Ref
Indexed at, Google Scholar, Cross Ref
Indexed at, Google Scholar, Cross Ref
Indexed at, Google Scholar, Cross Ref
Indexed at, Google Scholar, Cross Ref
Indexed at, Google Scholar, Cross Ref
Indexed at, Google Scholar, Cross Ref
Indexed at, Google Scholar, Cross Ref
Indexed at, Google Scholar, Cross Ref
Indexed at, Google Scholar, Cross Ref
Indexed at, Google Scholar, Cross Ref
Indexed at, Google Scholar, Cross Ref
Indexed at, Google Scholar, Cross Ref
Indexed at, Google Scholar, Cross Ref
