Research Article - Environmental Risk Assessment and Remediation (2018) Volume 2, Issue 4
Causes and impacts of shankila river water pollution in Addis Ababa, Ethiopia.
Mekonnen Maschal Tarekegn*, Amsalu Zomaneh Truye
Environment and Climate Change Management (ECCM) Department, Ethiopian Civil Service University, Ethiopia
- Corresponding Author:
- Mekonnen Maschal Tarekegn
Environment and Climate Change Management
Department Ethiopian Civil Service University Ethiopia
E-mail: maschalm12@gmail.com
Accepted date: October 22, 2018
Citation: Maschal Tarekegn M, Truye AZ. Causes and impacts of shankila river water pollution in Addis Ababa, Ethiopia. Environ Risk Assess Remediat. 2018;2(4):21-30.
Abstract
Water plays a crucial role in the development and sustenance of all living things. As of previous research reports and also finding of this study river which flows through the city of Addis Ababa are being polluted mostly through human activities which have a series health implication for humans living and aquatic lives in the city and beyond. Water quality affects the economic, social and political development of society. When water becomes polluted or contaminated by unwanted or unexpected substances, it is considered as harmful for the environment in general and this water is termed as polluted. According to this study, the main causes of pollution of Shankila River were the introduction of uncontrolled solid waste, untreated sewerage effluent or channeling of raw sewage into the river, release defecation along the courses, discharge of untreated domestic effluents into the river. The main causes are induced by remote causes, namely indiscriminate dumping of refuses into the river, indiscriminate dumping of industrial wastes, scattering settlement or urbanization and others like vehicle washing effluents released into the Shankila River. The Shankila River water was subjected to physical, chemical and biological disturbance due to pollution. According to the study, the river water did not meet WHO drinking water standard as well as the surface water standard of Ethiopia. Fecal coliforms count was beyond WHO standard.Keywords
Fecal, coliforms, pollution, shankila.
Introduction
Water bodies are polluted by common anthropogenic activities like urbanization, industrialization and service sectors. Contaminations of ground and surface water are the most serious problems affecting the health of the population. The issue of surface and groundwater pollution has not been considered as a major problem in Ethiopia until recent times. The environmental quality of freshwater ecosystem has deteriorated by pollutants. Pollution of water bodies may take place due to the discharge of domestic and industrial wastewater, toxic chemicals used for agriculture and other purposes, solid waste due to garbage, and cleaning of vehicles, drainage from forms and land surface, dustfall, wastes due to recreational use and much more such activities. Pollution caused by a plethora of human activities primarily affects physicochemical characteristics of water leading to the destruction of community disrupting delicate food webs, deteriorating aquatic environment [1,2].
The water bodies might be polluted by either a point or nonpoint source of pollution. Point sources include municipal sewage treatment plant discharges, industrial plant discharges, factories, power plants, underground coal mines, specific sources such as drain pipes, ditches or sewer outfalls and oil wells and non-point sources or diffuse sources in the other hand have no specific location of sources. As stated by UNEP, 2003, pollution started when humans began to farm the land and settle in villages and towns many thousands of years ago [3]. There are numerous sources of pollutants that could deteriorate the quality of water resources. Tamiru.et.al. stated that in developing countries source of pollution from domestic, agricultural, industrial activities are unregulated [4]. Similarly, in Addis Ababa, where there is no as such environmental protection practice, there are a number of pollutant sources that continuously deteriorate the quality of surface and groundwater. According to research report organized by Tamiru and his co-researchers, the adverse impact of human population on surface and groundwater was increasing [5] indicated that the major sources of pollutants in Addis Ababa are; industrial establishment, agricultural activities, municipal wastes, fuel stations, garages, and health centers [4]. Similarly, AAWSA (2000) report showed that the source of pollution surface and groundwater in Addis Ababa are categorized as: industries and factories, government and private institutions, pit-latrines and septic tanks, poor solid waste management systems, domestic animals, sewerage lines, wastewater treatment plant effluents, and surface runoff [6]. Generally, the sources of water pollution in Addis Ababa are explained below.
According to UNESCO national water development report for Ethiopia 2004, about 90 percent of industries which are found in Addis Ababa have simply discharged their sewage into nearby water bodies, streams, open land without any form of treatment [7]. As cited by UNSECO (2004), in 1996 report ministry of health on the study of liquid waste management, out of 118 industrial establishments assessed in the city of Addis Ababa, 40 has solid waste discharges, 61 generates air pollutant discharges, while 62 generates liquid waste that was to be discharged to the surrounding environment. According to to the report of AAWSA (2000), most governmental hospitals in Addis Ababa are located far from existing sewerage lines. In addition to this other institution such as government offices, schools, and academic institutions, a large number of hotels, bars restaurants, garages, and fuel stations in Addis Ababa can pollute both ground and surface water qualities.
Shankila River is one of the surface water resources that is passing through the centre in Addis Ababa city. A preliminary site visit in this study has shown that it is surrounded by settlements, industries, and urban agriculture farms. The site visit has observed a number of pollutant sources that might adversely affect the quality of Shankila river water. As the name of the river 'shankila' meaning to 'black' has indicated, the color of shankila river at its dawn and the middle stream has been changed to black; which is an indication of pollution. Addis Ababa Environmental protection authority has reported that most industries are releasing their effluent to the river; there are visible toilet outlet releasing domestic liquid waste to the river and farmlands along the river course are also using chemical fertilizers and pesticides. However, there were no studies conducted to assess the driving forces i.e. dominant causes or sources of river pollution and its effects on the aquatic environment of the river. Hence, this study was designed to assess the pollution profile, causes and its effect on the aquatic environment.
Materials and Methods
Description of the study area
The study was carried out in Shankila River in Addis Ababa Ethiopia (Figure 1). The five sampling points of the study area were purposively selected and their coordinate numbers were mapped by GPS (Global Positioning Systems) (Table 1).

Figure 1: Map of the study area with the sample site of Shankila River, Addis Ababa, Ethiopia.
| Sample Points | Coordinate Numbers | ||
|---|---|---|---|
| X | Y | Z | |
| 1Sample | 469188 | 1002260 | 2604 |
| 2Sample | 469061 | 1000175 | 2515 |
| 3Sample | 469020 | 998422 | 2426 |
| 4Sample | 468904 | 997340 | 2379 |
| 5Sample | 469820 | 996622 | 2353 |
1Sample=upstream (Gullele); 2Sample=Marble Factory; 3Sampl =SefereSelam; 4Sample=Amanuel Condominium; 5Sample=Coca Mazoriya
Table 1. Sample point coordinates number of the Shankila River water.
Methods of data collection
Research approaches and design for laboratory analysis: The water quality parameters were analyzed using standard analytical methods [8,9]. In order to establish Shankla River pollution causes or sources, from five sample point, composite samples of water were collected by following standard sampling methods in dry seasons (February-March 2018). The sampling strategy follows the representativeness of samples enough to analyze corresponding pollutant sources and causes. The sampling stations start from the mountainous area to the end of the Shankila River. Grab samples were taken in running water, perpendicular to the flow, at a depth varying from 10- 20 cm below the water surface and as close as possible to the middle of the River. The samples were analyzed in three times for physicochemical parameters (Turbidity, pH, EC, TDS, TSS, TH, COD, BOD, Ammonia, Nitrate, Nitrite, Phosphate, and Sulphate), biological parameters (pathogenic micro-organisms). A 2100Q portable turbidity meter instrument that was made in the USA was used to measure the turbidity. A PH/MV/ Conductivity/TDS/Salt/Temp Model 99720 portable pH meter instrument that was made in Taiwan was used to measure the pH. Total Suspended Solids (TSS) was determined gravimetrically and (BOD5) was determined using Winkler’s method according to APHA.
All other measurements were carried out within 24 hours after sampling. Water quality parameters that required immediate analyses; Ortho-phosphate, Nitrogen-Ammonia, Nitrate- Nitrogen were measured with a DR/2400 Spectrophotometer using appropriate reagent pillows at the Addis Ababa Environmental Protection Authority and Ethiopian Leather Industry Development Institute Laboratory. Samples were preserved in an airtight ice chest at room temperature (~20°) before being transported to the laboratory. For assessment of Coliforms, bacteria water samples were collected using sterilized 500 mL glass bottles from 30 cm below the surface of the River water and transported on ice. The samples were processed within 6 hours of collection to avoid changes of bacterial count due to growth or die off. The Membrane Filtration Technique (MFT) as described in APHA (2002) was used for the analysis of the samples for the presence of indicator organisms. Three appropriate dilutions were made for each fecal indicator.
Sampling sites
Sampling and choice of sampling sites was a key step of pollution assessment along the Shankila River. The following criteria were used for sample site selection for the study: upper river catchment sampling site (S1); for background data (benchmarking) due to undisturbed (unpolluted) river source, concentrations of residential, industrial, commercial and related activities upstream of the river, upstream/downstream intensive land use such as urban agriculture and other socio-economic activities, accessibility of the site, junction point between riversto see the pollution load and pollution source of respective rivers and vegetable production sites-to see the pollution load of river water used for irrigation. Other criteria used to select the sampling point were purposive sampling sites also chosen for one of the following reasons: if the site is exceptionally recreational area i.e., protected area by the government or private institutions/organizations and if the site is highly polluted and morphology of the river is different. And finally, the sampling point must provide a sample that is representative of the final effluent discharged into the receiving environment.
Sample collection
A water sample from Shankila River was collected for this study following standard procedures as described by previous research [8]. Pre-washed 1000 ml sizes of PVC plastic bottle was used to collect a water sample for water quality analysis. Sample containers were labeled on the field using appropriate codes and water samples were temporarily stored in ice packed cooler and transported to the laboratory and stored in a refrigerator at about 4° prior to analysis [10]. These samples were collected on a one month period (February to March 2018). The collected water samples have been analyzed in Addis Ababa Environmental Protection authority and Ethiopian Leather Industry Development Institute Laboratory.
Analytical Procedures
Fifteen parameters were analyzed for water samples that were taken from five different points of Shankila River. The detail analytical procedures for analyzing all the parameters are described below.
Turbidity
A 2100Q portable turbidity meter instrument that was made in the USA was used to measure the turbidity. First, the instrument was calibrated by distilled water (Zero NTU) and a standard turbidity suspension of 20, 100 and 800 NTU by choosing one of them. The thoroughly shaken sample is taken in the portable instrument and the value is recorded.
pH
A PH/MV/Conductivity/TDS/Salt/Temp Model 99720 portable pH meter instrument that was made in Taiwan was used to measure the pH. First, the instrument was calibrated with two standard Buffer solutions of pH 4.0 and pH 9.0. The electrode was thoroughly rinsed with distilled water and carefully wiped with a tissue paper. The electrode was dipped into the solution swirled and waited up to one minute for steady reading. The reading appeared after the indicated value remains constant for about a minute.
Electrical conductivity (EC)
The cell was calibrated with a standard of a 0.1 N KCl solution of conductivity 1413 μS/cm at 30°C. The cell was rinsed thoroughly with distilled water and carefully wipe with tissue paper. The cell was a dip into the sample solution, swirl and wait up to one minute for steady reading. The reading was taken after the reading remained constant for about a minute.
Biological oxygen demand (BOD)
Standard Methods for the Examination of Water and Wastewater adopted by APHA was used for this study [11]. Distilled water was placed in a 5 L flask and aerated by bubbling compressed air through water. Then, about 1 ml of phosphate buffer, 1ml of magnesium sulfate, 1ml of calcium chloride and 1 ml ferric chloride solution were added for every litter. For every sample-four, BOD bottles were taken. The two bottles used for blanks and two for samples. Diluted water was filled into two bottles and the necessary amount of well-mixed sample was added in two bottles using a pipette. The other two bottles were filled with distilled water, then the bottle was stoppered and one set of the bottle (one in blank and the other with sample) were carried out with DO procedure. The other set was placed in the incubator for 5 days at 20°C. Following this, the end D.O. content was determined from the incubated bottle at the end of 5 days (120h). The BOD was calculated by Equation 1.
Calculation
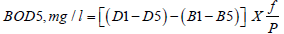 (1)
(1)
Where: D1-1st day D.O 1st-diluted sample
D5-5th day D5-5th-diluted sample
P-Decimal volumetric fraction of sample used
B1-1st day D.O of control
B5-5th day D.O of control
Chemical oxygen demand (COD)
COD reactor tubes were used to analyze the COD. The sample was diluted about a volume of 2.5 ml. Then, 1.5 ml K2Cr2O7 and 3.5 ml H2SO4 reagent were added consequently. A total volume of 7.5 ml solution containing tube was covered and close firmly, arrange in a steel rake and heat the oven for 2 hrs. at 150°. Then, the solution was cooled and titration performed. Finally, COD calculated was based on formula shown in Equation 2.
Calculations: mg/l COD=(blank value- sample value) XNXFX1000/sample taken, mL
To calculate F, F=10000/Titrant volume of blank (2)
Total suspended solids: (APHA) dried at 103-105ºC
The sample was put in the disk with a wrinkled side up into filtration apparatus. Following this, a vacuum and wash disk with three consecutive 20 ml of distilled water was used. We carried a suction to take away traces of water, turn off the vacuum and eliminate the washings. Then the washing apparatus was taken away, transfer to an inert aluminum weighing dish and dried in an oven at 103° to 105° for 1h. Then it was cooled in desiccators to equilibrium temperature and weigh. The sample was stored in desiccators until it was cooled. Then, we assembled the filtering apparatus and filtered the sample. Procedurally, the filter was wetted with the small volume of the tilled water. Then, a small amount of sample was measured by pipette onto the seated glass fiber filter. It was rinsed with 10 ml of distilled water three times, for allowing total drainage between washings and continues suction for 3 minutes after filtration. Samples with high dissolved solids may need extra washings. Then, we have removed the filter from filtration apparatus and tray apparatus and minimum weighing dish as a support. The sample on the dish was dried for at least 1 h at 103° to 105° in an oven, cooled in desiccators to balance temperature and weight. The Total Suspended Solid was calculated by Equation 3.
Calculation:
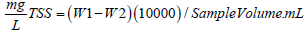 (3)
(3)
Where: W1 = weight of dried residue + filter; W2 = weight of filter.
Total dissolved solids (TDS)
A PH/MV/Conductivity/TDS/Salt/Temp Model 99720 portable TDS meter instrument that was made in Taiwan was used to measure the TDS. First, the instrument was calibrated with standard solutions of 940 mg/L. The electrode was thoroughly rinsed with distilled water and carefully wiped with a tissue paper. The electrode was dipped into the solution swirled and waited up to one minute for steady reading. The reading appeared after the indicated value remains constant for about a minute.
Total hardness (TH)
The analysis was done by complexometric titration. During the titration Calcium and Magnesium ions reacted with EDTA to form a soluble complex. The completion of reaction has indicated by the color change of a suitable indicator such as Eriochrom Black T.
In the titration, Calcium ion does not react with the indicator dye. Magnesium ions only were reacting and changing the color of the dye. Therefore, a small amount of complexometerically neutral Magnesium salt of EDTA has introduced to the titer through the addition of buffer (wine red) to obtain endpoint (blue) by the color change of the indicator. The TH was determined by equation 4.
Calculation: mg/LTH as CaCO3=(T) × 1000/V (4)
Where: T=Volume of Titrant; V=volume of the sample in mL
Sulfate test (SO4-2)
In the presence of organic matter, certain bacteria may reduce SO4-2 to S2-. To avoid this, we have stored the study samples at 42°C. Also, we filtered the sample through Whatman No.1. Then after, we adjusted the pH of a 200 ml filtered sample with HCl to pH 4.5 to 5.0; the orange color of methyl red indicator has been used. Procedurally, about 1.2 ml HCl was added. We have heated to boiling with gently stirring; then we added 5 to 10 ml barium chloride solution slowly. The precipitated samples were digested at 80°C and keep in room temperature for 1day. Finally, the filter was placed and precipitated in a weighing crucible and ignite at 850° for 30min. The SO4-2ion was determined by Equation 5.
Calculation: mg/L SO4-2=mg BaSO4-2 × 411.6 × 1000/ ml of sample (5)
411.6= factor; Factor=M wt. of SO4-2/M wt. of BaSO4-2
Nitrogen (Ammonia) NH3
A borosilicate glass flask of 500-800 ml capacity was attached to a vertical condenser so that outlet tip may be underwater below the surface of the receiving boric acid solution. Instruments like pH meter, burette, 250 ml conical flask, 1 ml pipette, Kjeldahl flask were used. The samples were shacked and put in the distillation flask or preserved the sample with 0.8 ml conc. H2SO4 and stored in an incubator at 20°. Then, about 50 ml of sample was taken into a distillation flask and diluted with 250 ml distilled water. Following this, about 10 ml borate buffer solution was added to adjust pH to 9.5 with 6 N NaOH by measuring using pH meter. Then, the Kjeldahl flask was transferred to the distillation apparatus and started distillation, collected the distillate in 250 ml conical flask containing 50 ml of indicating boric acid. Then, we have titrated the ammonia in the distillate against the standard of 0.02 NH2SO4 until the indicator turns to a pale lavender color and at the end we carried out a blank through all the steps of the procedure to take the necessary correction of the result. The NH3 was determined by Equation 6.
Calculation: mg/L NH3 (A-B) × 14 × 0.02 × 1000/ml of sample (6)
Where: A=titration value; B=blank value; 14=equivalent of ammonia; 0.02=normality of sulfuric acid.
Phosphate (PO4-3)
A 10 ml of the sample was taken in a 100 ml volumetric flask, About 6 ml of Ammonium Molybdate and 6 drops of Stannous Chloride were added and made up to the mark with distilled water. Blank (B) was prepared in the same manner with distilled water. Absorbance was measured at 690 nm and conc. Phosphate was calculated from the graph which was obtained by following the above procedure. A standard phosphate solution was taken in different concentrations; reading was taken before 20 minutes of makeup and used as a standard measurement for our sample. The PO4 -3 was determined by Equation 7.
Calculation: mg/L PO4-3=conc. from the graph × 1000/ volume of sample taken
Nitrate (NO3-)
About 50 ml of sample was taken in a porcelain dish, heated and evaporated until to get the residue. The dish was cooled and the residue was dissolved in 2 ml phenol disulphoinic acid and was transferred into 50 ml volumetric flask. Then, 6 ml of Ammonia solution was added and the yellow color was developed. The solution was made up to the mark with distilled water. Blank (B) was prepared in the same manner with distilled water. The concentration of nitrates was calculated from the graph which was obtained by following the above procedure; instead of using the standard Nitrate solution in different concentrations and the color of the sample was read at 410 nm. Finally, the NO3- concentration was determined by Equation 8.
Calculation:
mg / LNO3− = conc. from the graph×1000 / volume of sample (8)
Coliforms
Dilutions were duplicated and drained through a 0.45 μm sterile membrane filters with a vacuum pump. Filters for Total Coliforms (TC) and Escherichia coli (E. coli) were incubated on Chromo cult Coliforms Agar (ISO 6222, OXOID) at 37° for 24 hours. Typical colonies appearing pink to red and dark blue were counted as total coliforms and E. coli respectively. For all colonies forming units (CFU) counted, total numbers per 100 mL was expressed in previous studies report [11].
Total numbers (per 100 ml) = (CFU's  Dilution Volume filtered 100)
Data analysis
The researcher has collected both qualitative and quantitative data from sample analysis and respondents or key informants. Regarding make the computation precise, dependable and time-saving, the assessment of the physicochemical and microbiological condition of the water was taken into account. The interpretation was done in comparison with the WHO drinking water quality 2004 [12] standards and the Ethiopian surface water standards too. The temporal variations of water quality along the Rivers course were evaluated through IBM SPSS Statistics 21 software. All statistical analysis was done using the plates, charts and some standard tables were used to present the analysis results.
Result and Discussions
Correlation matrix of fifteen physicochemical and biological parameters of the Shankila River water was showed in (Table 2). The correlation matrix (Table 2) shows a very strong positive correlation between TSS with Turbidity, FC with Turbidity, TC with TSS and NH3 with BOD. The correlation coefficient also indicates a positive correlation between the above-listed parameters and others too. In addition, the number of TSS increases as the increasing of Turbidity. Similarly, fecal coliforms increase the result of Turbidity. On the other hand, Ammonia increases with the increasing of BOD. In this specific situation, the source of Ammonia was an untreated discharge of domestic sewerage from the toilet, kitchen and other run-off non-point sources from the city.
| Parameters | Turbidity | PH | EC | COD | TDS | TSS | TH | SO42- | NO3- | NO2- | PO43- | NH3 | BOD | FC | TC | |
|---|---|---|---|---|---|---|---|---|---|---|---|---|---|---|---|---|
| Turbidity | Pearson Correlation | 1 | ||||||||||||||
| Sig. (2-tailed) | ||||||||||||||||
| PH | Pearson Correlation | 0.731 | 1 | |||||||||||||
| Sig. (2-tailed) | 0.160 | |||||||||||||||
| EC | Pearson Correlation | 0.741 | 0.920* | 1 | ||||||||||||
| Sig. (2-tailed) | 0.152 | 0.027 | ||||||||||||||
| COD | Pearson Correlation | 0.952* | 0.848 | 0.884* | 1 | |||||||||||
| Sig. (2-tailed) | 0.012 | 0.070 | 0.047 | |||||||||||||
| TDS | Pearson Correlation | 0.855 | 0.849 | 0.965** | 0.932* | 1 | ||||||||||
| Sig. (2-tailed) | 0.065 | 0.069 | 0.008 | 0.021 | ||||||||||||
| TSS | Pearson Correlation | 0.991** | 0.749 | 0.801 | 0.974** | 0.905* | 1 | |||||||||
| Sig. (2-tailed) | 0.001 | 0.145 | 0.103 | 0.005 | 0.035 | |||||||||||
| TH | Pearson Correlation | 0.481 | 0.897* | 0.885* | 0.626 | 0.786 | 0.525 | 1 | ||||||||
| Sig. (2-tailed) | 0.412 | 0.039 | 0.046 | 0.258 | 0.115 | 0.364 | ||||||||||
| SO42- | Pearson Correlation | 0.941* | 0.796 | 0.892* | 0.957* | 0.975** | 0.970** | 0.671 | 1 | |||||||
| Sig. (2-tailed) | 0.017 | 0.107 | 0.042 | 0.011 | 0.005 | 0.006 | 0.215 | |||||||||
| NO3- | Pearson Correlation | 0.744 | 0.462 | 0.577 | 0.625 | 0.743 | 0.747 | 0.487 | 0.812 | 1 | ||||||
| Sig. (2-tailed) | 0.149 | 0.434 | 0.308 | 0.259 | 0.150 | 0.147 | 0.405 | 0.095 | ||||||||
| NO2- | Pearson Correlation | 0.762 | 0.520 | 0.750 | 0.749 | 0.882* | 0.815 | 0.538 | 0.899* | 0.900* | 1 | |||||
| Sig. (2-tailed) | 0.134 | 0.369 | 0.144 | 0.145 | 0.048 | 0.093 | 0.350 | 0.038 | 0.037 | |||||||
| PO43- | Pearson Correlation | 0.870 | 0.838 | 0.948* | 0.969** | 0.974** | 0.921* | 0.699 | 0.954* | 0.614 | 0.810 | 1 | ||||
| Sig. (2-tailed) | 0.055 | 0.076 | 0.014 | 0.007 | 0.005 | 0.026 | 0.189 | 0.012 | 0.271 | 0.096 | ||||||
| NH3 | Pearson Correlation | 0.682 | 0.943* | 0.970** | 0.806 | 0.920* | 0.727 | 0.964** | 0.841 | 0.610 | 0.697 | 0.860 | 1 | |||
| Sig. (2-tailed) | 0.205 | 0.016 | 0.006 | 0.100 | 0.027 | 0.164 | 0.008 | 0.074 | 0.275 | 0.191 | 0.061 | |||||
| BOD | Pearson Correlation | 0.659 | 0.830 | 0.979** | 0.809 | 0.952* | 0.736 | 0.870 | 0.862 | 0.607 | 0.807 | 0.915* | 0.946* | 1 | ||
| Sig. (2-tailed) | 0.226 | 0.082 | 0.004 | 0.097 | 0.012 | 0.156 | 0.055 | 0.060 | 0.277 | 0.098 | 0.029 | 0.015 | ||||
| FC | Pearson Correlation | 0.978** | 0.856 | 0.825 | 0.971** | 0.890* | 0.972** | 0.629 | 0.943* | 0.697 | 0.714 | 0.897* | 0.792 | 0.730 | 1 | |
| Sig. (2-tailed) | 0.004 | 0.064 | 0.085 | 0.006 | 0.043 | 0.006 | 0.256 | 0.016 | 0.191 | 0.176 | 0.039 | 0.110 | 0.162 | |||
| TC | Pearson Correlation | 0.977** | 0.710 | 0.764 | 0.918* | 0.893* | 0.977** | 0.542 | 0.969** | 0.866 | 0.865 | 0.864 | 0.728 | 0.717 | 0.950* | 1 |
| Sig. (2-tailed) | 0.004 | 0.179 | 0.132 | 0.028 | 0.041 | 0.004 | 0.346 | 0.007 | 0.058 | 0.058 | 0.059 | 0.164 | 0.173 | 0.013 | ||
N=5;
*. Correlation is significant at the 0.05 level (2-tailed)
**. Correlation is significant at the 0.01 level (2-tailed)
Table 2. Correlation matrix of fifteen physicochemical parameters of the Shankila River.
Sources of Shankila River Water Pollution
According to the laboratory result, solid and liquid wastes of different sources along the river course are discharged directly into the river without any treatment. The pollution source indicators that have been analyzed in the laboratory are discussed below.
Fecal pollutants
Studies investigated and reported that sources of the Fecal coliform bacteria in urban areas may come from domestic pets, such as dogs, sewer overflows, sanitary sewer overflows and failing septic systems, leakages of sewers and the discharge of untreated waste to the stream and from non-point runoff sources [13]. Materials of fecal origin that reach Shankila River water bodies during sewage discharges or introduction of dung that hasn’t been sufficiently treated. As shown in Figure 2, several households link their toilet outlet into the river course; it causes the introduction of a pollutant into the river. As it was also summarized in Table 3, the presence of fecal coliforms in the river water is the indicator of fecal pollutant source that has already been cross proved by observation.

Figure 2: Direct discharge of toilet and domestic sewage to the Shankila River.
In Table 3 the average mean value of Fecal coliforms and Total coliforms shows that Shankila River water has contained higher coliforms that is completely above the permissible limit of both the WHO and Ethiopian EPA standards. And the result indicated that the cause or source of Shankila River water pollution was fecal pollutants. In other words, fecal primarily comes from the untreated direct released domestic waste and sewerage discharges.
| Parameters counts/100 ml | Eth Std | Who Std | Sample 1 | Sample 2 | Sample 3 | Sample 4 | Sample 5 | Average means value |
|---|---|---|---|---|---|---|---|---|
| Fecal coliforms | 0 | 0 | 24 | 428 | 548 | 675 | 680 | 347 |
| Total coliforms | 0 | 0 | 1413 | 1650 | 1836 | 1824 | 2086 | 2134 |
Sample 1=upstream (Gullele); Sample 2=Marble factory; Sample 3=Sefere selam; Sample 4=Amanuel condominium; Sample 5=Coca mazoriya
Table 3. Average means the value of fecal coliforms and total coliforms.
Inorganic harmful substances
Substances constituted by typically phosphates and polyphosphates presented in fertilizers, detergents, a compound of nitrogen and phosphorous and in some industrial effluents.
These substances are the reason for eutrophication in the downstream of the river. Additionally, Nutrients (Nitrogen and Phosphorus) in excessive amounts can cause aquatic plants to grow too fast, choking waterways, causing potentially harmful algae blooms, and creating oxygen conditions that can harm fish and other aquatic life. As it summarized in Table 4, the average concentration of phosphate, ammonia, nitrate, and nitrite are 19.44, 18, 0.34 and 0.38 mg/L respectively. However, the maximum WHO permissible emission limits of these pollutants are 1, 0.2, 50 and 0.1 respectively (WHO, 2007). Also, the Ethiopian surface water standard said the maximum amount of ammonia, nitrate, and nitrite in the surface water or river is specified as 0.2, 50 and 0.1 mg/L respectively [14].
| Parameters in mg/L | Eth Std | Who Std | Sample 1 | Sample 2 | Sample 3 | Sample 4 | Sample 5 | Average means value |
|---|---|---|---|---|---|---|---|---|
| PO4-3 | - | 1 | 0.7 | 19 | 21.9 | 20 | 35.6 | 19.44 |
| NH3 | 0.2 | 0.2 | 0.02 | 26 | 11.5 | 21.5 | 31 | 18 |
| NO3- | 50 | 50 | 0.3 | 0.3 | 0.3 | 0.4 | 0.4 | 0.34 |
| NO2- | 0.1 | 0.1 | 0.012 | 0.083 | 0.176 | 0.516 | 1.12 | 0.3814 |
Table 4. Concentration amounts of Phosphate, Ammonia, Nitrate, and Nitrite.
According to Table 4, all the tested sample points for phosphate, ammonia, and nitrite are above the standard limit of both the WHO and Ethiopian standards except sample point of the upper stream of Gullele. The Nitrate (NO3-) concentrations are still at an optimum level. The average mean values of PO4-3, NH3, and NO2- were above the standard limit. Moreover, the concentration of Ammonia that was found at this level was one of the most pollution indicators of the depletion of Dissolved Oxygen in the Shankila River. In addition to this, Ammonia occurs naturally in water in trace amounts, but too much ammonia from fertilizer, sewage, and other wastes can be poisonous to fish, especially when water temperature and pH are high. Ammonia can also cause heavy plant growth, foul odors, and low oxygen levels that can interfere with use for fishing, swimming and water supplies. Because of microorganisms or bacteria’s which are found inside the river using the dissolved oxygen at a high rate to oxidized the total Ammonia (NH3) into Nitrate (NO3- ) and Nitrite (NO2- ) form. The consequence of these pollutants was not stooped at this point, after the bacteria’s decomposed the total ammonia to nitrate and nitrite form, algae’s and other unnecessary aqua plants were grown on the surface of the water body for the causes of Eutrophication in the downstream of the Shankila River. After all, the above pollutants whish was found at this level inside the river body, they were a treat for the survival of sensitive aqua biota macro invertebrate species along the river catchment of Shankila.
Free oils emulsifiers
These are insoluble, low density substances which for this reason form surface oily film layers that prevent oxygen dissolution in the Shankila River water. It’s not an unusual phenomenon and it can cause real environmental disasters. To concretize the evidence of such pollutant in the Shankila River, a number of Garages, Car washing houses, and Battery maintenance and other similar shops were founded along the Shankila River course very near to the riverside. Specially, from sample point four (Amanuel Condominium) to sample point five (Coca Mazoriya). Similarly, Oil and Grease include fuel oil, gasoline, vegetable oil, and animal fats. Oils generally enter waterways through spills, leaks, and improper disposal, and can be toxic to plants and animals even in small amounts.
Sample 1=upstream (Gullele); Sample 2=Marble factory; Sample 3=Sefere selam; Sample 4=Amanuel condominium; Sample 5=Coca mazoriya
Table 5 summarized that the Turbidity and Total Suspended Solids of Shankila River water increase from upstream to lower stream along the river course. Both results indicated that anthropogenic pollution tendency increases along the riverside. Turbidity is a measure of light transmission and indicates the presence of suspended material such as clay, silt, finely divided organic material, plankton, inorganic material, and other microorganisms. It may tell a brown or another color to water bodies and may obstruct with light penetration and photosynthetic reaction in stream and lake. Turbidity can indicate that water may be contaminated with pathogens presenting human health concerns [15]. In this study, Shankila River had a hard dark color at the specified sample points (Figure 3). This due to the releasing of pollutants from Garages, Car washing houses and Battery maintenance and other similar shops to the river directly without any further treatment. So, they had a capacity to increase the amount of Turbidity and Total Suspended Solids values and become to prevent oxygen dissolution of the river.

Figure 3: Color and field survey for in-situ measurement of pH, TDS, and EC of Shankila River.
| Parameters | Eth Std | Who Std | Sample 1 | Sample 2 | Sample 3 | Sample 4 | Sample 5 | Average means value |
|---|---|---|---|---|---|---|---|---|
| Turbidity in NTU | <5 | <5 | <0.0001 | 53.7 | 105 | 127 | 130 | 83.14 |
| TSS mg/L | 25-50 | - | 9 | 98 | 173 | 197 | 234 | 142.2 |
Table 5. Turbidity and total suspended solids.
Suspended solids
Trash consists of litter, debris, and other types of discarded solid waste. Trash can be contaminated with toxins or bacteria, and it harms fish and wildlife that eat it or become entangled in it. In areas where people swim or wade, it also poses a human health and safety threat. Creating a mixture of various kinds of substances that make Shankila River become dark brown and murky after pollution and prevent solar light from passing through. When they deposited deep on the bottom of a river water body they obstruct vegetation growth. As presented in Table 5, the amount of Total Suspended Solids was above the standard limit of Ethiopian EPA. The color of the Shankila River had highly dark in color and contains a lot of suspended materials like plastics, wood, big stones, and other similar materials was founded during the field survey (Figures 4 and 5).

Figure 4: Suspended Solids on the bottom of Shankila River.

Figure 5: Open dumping of solid domestic wastes at sample point three of Sefere Selam.
To summarize the pollution sources of Shankila River, one of the most dominant causes was domestic wastewater releases along the entire Shankila River course. Due to its geographical or demographic nature of the river, the domestic wastes (i.e. both liquid and solid) have become the major driver for the state of change. The river becomes a convenient place for the people to dump their wastes easily. Surface runoff conditions of the paved city center, lack of toilet access, the absence of sewerage line systems, poor solid waste management system, lack of awareness of people’s perception towards river pollution and the like aggravated the pollution.
Effects of Shankila River Water Pollution
The different types of pollution lead to chemical or physical alteration of Shankila River water and, the fate and states of pollutants in the river are described below.
Deoxygenating or Oxygen-depleting effects
Organic Enrichment/Oxygen Depletion (Low Oxygen) levels in water can occur naturally for short periods, but when they are extreme or long-lasting, they can sicken and even kill fish and other aquatic animals. Sewage wastewater, leaking septic tanks, farm, and feedlot runoff, and runoff from city streets contain organic materials that decompose and use up oxygen in water; higher water temperature also lowers oxygen levels. These effects were caused by the introduction of an organic pollutant from different sources. The domestic sewage and industrial wastes are dispersed into the Shankila River water. It was degraded by microorganisms, within an excessive consumption of the oxygen dissolved in the Shankila River. The reduced availability of oxygen in the river water is the causes of the deaths of animal and plant species that are unable to tolerate this lack of oxygen and, on the other hand, an invasion of those species that are not influenced by lack of oxygen. As it was also reported in Table 2 the COD and BOD concentration of Shankila River were 81.6 and 91.52 mg/L, respectively. This result is beyond the permissible limit of both WHO and Ethiopian surface water guidelines and has a cause of oxygen depletion of the river [13].
Eutrophication effects
Eutrophication is happening aggravated by compounds (mineral nitrogen and phosphorous) that favor an abnormal growth of the population of phytoplankton and algae in the downstream of the Shankila River, at the expense of the survival of other plant and animal species. Similarly, Algal Growth (Excess Algae) can occur when too many nutrients, warm water temperatures, and reduced flow trigger the overgrowth of naturally occurring algae into thick mats on or in the water. Blooms of algae can harm aquatic life by clogging fish gills, reducing oxygen levels, and smothering stream and lake beds and submerged vegetation. Some algae blooms can produce a poison that harms human health, pets, wildlife, and livestock when swallowed. The average means measured concentration level of the nitrogen and phosphate compounds of PO4-3, NH3 and NO2- ion result of 19.44 mg/L, 18.00 mg/L, 0.3814 mg/L respectively of this study indicates that, Shankila river was highly polluted by the above pollutants because these pollutants concentration was above the standard limit and they become effects of the Eutrophication of the river in the downstream.
Physical effects
The physical effects like the smell, odor, and color of the Shankila River were due to the anthropogenic effects of the unmanaged dumping of liquid and solid waste; mainly domestic wastes to the river territory. Anaerobic microorganisms were break down the organic matter of the waste for their consumptions. During the process, they released pungent smell gases like Ammonia, Hydrogen sulfide (rotten egg smell) and other similar gases which were not convenient to the people which are living in the city, especially those peoples which are settled very near to the river buffer zone due to different reasons. The presence of pollutants changed the natural river water color to completely dark and dark brown color of the Shankila River. Effect of higher pungent smell was also observed. A similar result has also been reported by another study [4-5].
Pathogenic and toxic effects
On the other hand Pathogens (Bacteria and Other Microbes) are potentially diseases causing organisms from human or animal wastes that enter waters through septic tank leaks or sewage discharges, farm and feedlot manure runoff after rain, boat discharges, and pet and wildlife waste. People can become ill by eating contaminated fish or shellfish or swimming in waters with high levels of these microbes. Shankila River pollution was caused by wastewaters discharged from the household toilet and other domestic activities with a content of suspended toxic or pathogenic materials (ammonia, detergents, mineral oils, heavy metals, hydrocarbons, solvent, etc.). Total Toxics include a large number of harmful, man-made substances such as solvents, pesticides, fungicides, dioxins, PCBs, and furans. They enter waterways through the improper application and disposal runoff, spills, auto exhaust, and burning of chemical wastes. These chemicals are toxic to animals and people. In addition to this, Toxic inorganic refers to a wide range of pollutants including metals, fire retardants, cyanide, and perchlorate (used in rocket fuel) that are poisonous to aquatic life and people. Industrial or wastewater discharges, mining, landfills, and air deposition of car exhaust and coal-fired power plant emissions can contribute to high levels of toxic inorganic chemicals in waterways. On the other hand, Toxic organics are harmful, man-made chemicals that all contain carbon. They can build up in animal and fish tissues and sediments or get into drinking water supplies, posing potential long-term health risks. The presences of different toxic pollutants in the river adversely affect aquatic animals and plants in and the surrounding environment. They typically affect the aquatic biota of macro invertebrate by disturbing the normal ecosystem balance and functioning. Moreover, as the pollution of the Shankila River continued without remediation or restoration, the environment of the city as a whole becomes unfavorable to all living things including human beings.
Conclusion
The Shankila River water was subjected to physical, chemical and biological disturbance due to pollution. According to the study, the river water did not meet WHO drinking water standard as well as the surface water standard of Ethiopia. Fecal coliforms count was beyond WHO standard and this indicated that the river was mainly polluted through anthropogenic activities. The presence of fecal and total coliforms count 347 and 1824 respectively indicate toilet and other domestic wastewater release into the river are the major source of pollution. According to this study, the main causes of pollution of Shankila River were the introduction of uncontrolled solid waste, untreated sewerage effluent or channeling of raw sewage into the river, release defecation along the courses, discharge of untreated effluents into the river. The main causes are induced by remote causes, namely indiscriminate dumping of refuses into the river, indiscriminate dumping of industrial wastes, scattering settlement or urbanization and others like vehicle washing effluents released into the Shankila River. The above listed causes or sources have increased the BOD, COD, FC and TC levels with a reduction in the D.O content of the river. The pollution of the Shankila River has reduced the quality of the river. Reduction in the quality of the river water translates into a loss of amenity such as drinking, cooking, bathing and washing; in general water, scarcity will be appeared
References
- AAWSA and UNEP. Water management for African cities, strategy and implementation plan for environmental monitoring of water resources in Addis Ababa. 2000.
- APHA. Standard methods for the examination of water and wastewater, 20th ed., American Public Health Association/American Water Works Association/Water Environment Federation, Washington DC, USA. 1998-99.
- Ara S, MA Khan, MY Zargar, et al. Physico-chemical characteristics of Dal Lake water. Aqua Environ Toxicol. 2003;12:129-134.
- Danquah L. The causes and health effects of river pollution: A case study of the Aboabo River, Kumasi. 2010.
- Gangwar RK, Khare P Singh, J Singh, et al. Assessment of physicochemical properties of water. River Ramganga at Bareilly, UP. Journal of Chemical and Pharmaceutical Research. 2012;4(9):4231-34.
- https://pubs.usgs.gov/wri/wri004139/pdf/wrir00-4139.pdf
- Khan MA. Recent bio-limnological pollution trends in Kashmir Himalayan Dal Lake ecosystem: Development of red bloom. Ecol Energy. 1996;22:41-77.
- Olson E. Grading Drinking water in U.S cities what’s on Tap? National resource defense Counsel, New York City, and Washington, D.C., Los Angeles, and San Francisco. 2004.
- Sinha SN, Biswas M. Analysis of physicochemical characteristics to study the water quality of a lake in Kalyani, West Bengal. Asian Journal of Experimental. Biological Sciences. 2011;2(1):18-22.
- Morris BL, Lawrence AR Chilton, PJC Adams, et al. Groundwater and its susceptibility to degradation: a global assessment of the problem and options for management. UNEP. 2003;3.
- Tamiru A, Tenalem A, Dagnachew L, et al. Scientific report on the groundwater vulnerability mapping of the Addis Ababa water supply aquifers Addis Ababa, Ethiopia: AAU and AAWSA. 2003.
- Tamiru A, Dagnachew L, Tenalem A. et al. Assessment of pollution status and