Research Article - Biomedical Research (2017) Volume 28, Issue 18
Using differential nonlinear gene co-expression network analysis for identification gastric cancer related genes
Hesham Abdulatef Mohammed Al-Bukhaiti, Jiawei Luo*
College of Computer Science and Electronics Engineering, Collaboration and Innovation Center for Digital Chinese Medicine of 2011 Project of Colleges and Universities in Hunan Province, Hunan University, Changsha, PR China
- *Corresponding Author:
- Jiawei Luo
College of Computer Science and Electronics Engineering
Collaboration and Innovation Center for Digital Chinese Medicine of 2011 Project of Colleges and Universities in Hunan Province
Hunan University, PR China
Accepted date: August 28, 2017
Abstract
Gastric cancer is one of the most common malignancies and ranks the second highest mortality in the world today. With this great progress, understanding of tumors is still a wide area to study. We utilized the distance correlation as the measurement of the relevance to construct the gene co-expression networks in both gastric cancer and normal tissue datasets respectively, also to define the complex interactions among genes with nonlinear property preserved and examine from the genes that have important roles in the gastric cancer formation. The genes which are extant in the module of normalassociated network but missing in the module of cancer-associated network are selected for further study and we call these genes stray genes. The results show the stray genes are enriched in up-regulation and the connectivity of all the genes appear the circumstance of loss in the gastric cancer network, especially to the stray genes. These results indicate that the activation of these stray genes may play important roles in the gastric cancer. We use PANTHER for Gene Ontology (GO) analysis and the results show that these stray genes are enriched in some biological processes, including cell cycle, chromosome segregation, DNA replication and p53 pathway and others. These results prove the effectiveness of our method for cancer-related genes identification and these cancer-related genes can be selected for further analysis.
Keywords
Gastric cancer, Distance correlation, Gene co-expression networks
Introduction
Cancer is one of the causes of death in the world and gastric cancer is one of the most common malignancies and ranks the second highest mortality [1]. Although much progress has been made to elucidate its pathogenesis so far, the understanding of tumorigenicity remains far from being complete. In the analysis of the genetic pattern in gastric cancer tissues, one of the commonly used methods is the differential expression analysis [2-6], which detects potential cancer associated genes based on the assumption that the prognostic genes may express significantly differentially in the cancer tissues compared to their normal counterparts. However, more and more evidences have revealed that the carcinogenesis is a complex process involving the gradual accumulation of genetic mutations and it can cause disease through altering the interaction patterns between genes [7,8]. Recently, gene co-expression network approaches have become an important tool to characterize gene connectivity and much useful information has been obtained [9]. The Weighted Gene Correlation Network Analysis (WGCNA) [10-13] is a well-established method designed for constructing co-expression networks from gene expression data. Most widely used gene co-expression network methods [14-16] are based on the linear dependence (Pearson correlation), which can be calculated conveniently. However, the linear relevance can only describe or approximate a fraction of the true relationship types observed in a biology system [17], the nonlinear dependence is still an extremely important part. The most popular method that applied to measure the nonlinear dependence is Mutual Information (MI), which measures how much information one random variable contributes to another. Even though MI is successfully applied in various circumstances, it still has its limitations. As the fundamental stage of the MI estimation, the accurate density estimation remains a challenging task, especially when the sample size is small. Distance Correlation (dCor) [18,19] is a new measurement of all types of dependence between two random vectors that uses the distance between observations as part of its calculation. Compared to the MI method, dCor is more powerful in most cases except the somewhat pathological high-frequency sine wave [20]. Moreover, dCor is also quite simple to compute and doesn't need any density assumptions.
In this research, we intend to analyse the nonlinear co-expression network of gastric cancer with the RNA-seq data and investigate genes that play important roles in carcinogenesis. We first construct the cancer-associated network and normal-associated network based on dCor and then identify modules in the two networks respectively. Through comparing the modules of the two networks, we select the genes which show in the module of normalassociated network but are absent in the module of cancerassociated network for further analysis. We noticed that the stray genes are significantly enriched in up-regulation and the connectivity of most genes in the gastric cancer network decreases compared to normal ones and the stray genes show more drastic decrease than other genes. This indicates that these up-regulated stray genes may play important roles in the gastric cancer formation. To verify our hypothesis, we perform GO analysis and we find that these stray genes are enriched in the biological processes (such as cell cycle, mitosis and chromosome segregation) and pathways (DNA replication and p53 pathway), that are related closely to the cancer.
Methods
Distance correlation
Distance correlation is creative measurement of nonlinear association that uses the distance between two random variables as part of its calculation. The value of distance correlation is in the range of (0, 1) and equal to zero if and only if the random variables are statistically independent. Suppose that we have an expression dataset with n samples and m genes. Let (Xi, Yi), i=1, 2,.. n be a sample from a pair of gene expression vector (X,Y). Then the distance of all pairs can be computed as:

Where ||.|| denotes the Euclidean norm. Then take all doubly centered distances matrixes 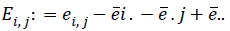 and
and 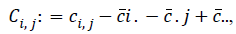 where ?ei. is the ith row mean, where ?e . j is the jth column mean, and ?e.. is the grand mean of distance matrix of X. The notation is similar for b value. The squared distance covariance of X and Y can be simply composed as:
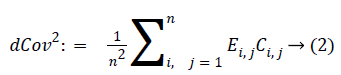
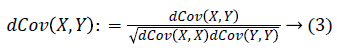
With the distance covariance, the distance correlation can be defined as:
Nonlinear weighted
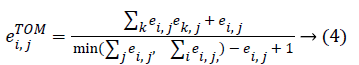
Co-expression network is a useful approach to describing the pairwise relationships between genes. Given n samples and m genes associated with a given phenotype, the expression profile can be represented by an n × m matrix. E co-expression network can be fully specified by a symmetric m × n adjacency matrix E=[ei, j], where ei, j [0,1]. For a weigh network, the adjacency matrix measures the connection strength between gene pairs. To calculate the adjacency matrix, we must define the co-expression similarity si, j first. We define the distance correlation between genes as the co-expression similarity. Following the method mentioned in WGCNA [11], we transform the co-expression similarity to the adjacency matrix with a power, ei,j=|Si,j|β. To reflect the gene-gene relative interconnectedness, we use a topological overlap matrix ETOM[eTOMi,j] to measure the association of the gene Paris. The value of eTOMi,j, can be calculated as follow:
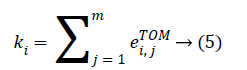
The genes composing of the nodes of the network and the weight of edges among genes are represented by the TOMbased adjacency matrix. For a complex network, the connectivity is one of the most elementary measurements, which is defined as the sum of the weights across all edges of a node. For the ith node, we denote the connectivity by ki. In terms of the TOM-based adjacent matrix, ki can be evaluated as:
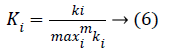
For fair comparison, we divide the connectivity of each gene by the maximum network connectivity and obtain the scaled form,
Results
The gastric cancer datasets is obtained from the TCGA project webpage [21]. Only the mRNA sequencing data available in both the tumor matched and normal matched samples, which include 29 pairs of gastric carcinoma and the matched normal samples, are selected for further analysis. To normalize the gene expression and reduce the samples bias we applied TMM (trimmed mean of M-values) method [22]. In the initial analysis, DESeq method [3] is used to identify the genes which are differentially expressed and 1880 genes are obtain with adjust p-value less than 0.01. These differential expressed genes consist of 741 up-regulated genes and 1139 down-regulated genes, which will be used to construct the cancer and normal nonlinear co-expression network, respectively. The structure of the co-expression networks are further studied through the hierarchical clustering based on average linkage and the TOM value as a distance measure. Finally a dendrogram is created. The modules in the dendrogram are detected using dynamic hybrid tree cut algorithm provided in R package WCGNA as function cutree Dynamic [23]. The parameters cut Height and min Cluster Size are set to be 0.9 and 100. Finally, we obtain only one module in both the cancer and normal co-expression network and the results are shown in Figure 1. In the Figure 1, the modules are designated by black and the gray region denotes genes outside of module. 335 genes are present in the module of cancer-associated network and 871 are in the module of normal-associated network. The number of the genes that are present in the both modules is 299 and the number of genes that is present only in the module of normal-associated network is 600. We consider these 600 genes as stray genes. Then, we analyse the gene expression pattern of the stray genes. These stray genes consist of 289 up-regulated genes and 301 down-regulated genes. A bar plot is shown in Figure 2a. With the exact binomial test, we find that the stray genes are enriched in up-regulated. To explore their biological significance, we carry out GO and pathway enrichment analyses with the online software PANTHER [24].

Figure 1: Clustering dendrogram of genes, (a) Gene co-expression modules in the gastric cancer-associated network. (b) Gene coexpression modules in the normal-associated network.

Figure 2: (a) The proportions of the up-regulated genes and the down-regulated genes in the stray genes and the total differentially expressed genes. (b) The connectivity comparison of the interested genes between the cancer-associated network and the normalassociated network.
In this study, overrepresented GO terms in biological process with Bonferroni corrected p-values less than 0.01 are considered significantly enriched. Finally, 10 terms are recognized and the top 5 significant among them are shown in Table 1, including cell cycle and chromosome segregation. Pathway enrichment analysis is also carried out with PANTHER. Significantly enriched pathways with the p-value less than 0.01 are also listed in Table 2. In this part, we will present analyse the connectivity of the genes in the module and the switching between the cancer and normal conditions. For each gene in the “black” module, we calculate its connectivity in the cancer-associated network and normal-associated network according Equation 6. We compare the connectivity of each gene in the both networks and the result is shown in Figure 2b.
| GO term | Gene number | Expected number | P value |
|---|---|---|---|
| Cell cycle | 59 | 13.9 | 4.60E-11 |
| Mitosis | 36 | 6.03 | 4.10E-30 |
| Chromosome segregation | 18 | 2.77 | 7.15E-90 |
| Cytokinesis | 16 | 3.22 | 2.56E-77 |
| Cellular process | 120 | 69.01 | 6.58E-11 |
Table 1: The GO enrichment result.
| Pathways | Genes | P value |
|---|---|---|
| DNA replication | TOP2A, RNASEH2A, DNA2, RFC3, PCNA | 3.51E-04 |
| p53 pathway | CCNB1, GTSE1, CDKN2A, PIK3R2, TRAF2, RRM2, CDC25A | 8.01E-07 |
Table 2: PANTHER pathways enrichment results.
From the Figure 2, we can also find that the connectivity of genes in the cancer- associated network is mostly less than that it in the normal-associated network, which means the loss of connectivity in the gastric cancer network and such phenomenon is also observed in [8]. Moreover, we also observe that the stray genes, which are colored by black, occupy the top-left part of the plot, which means that these genes play a role of hubs in the normal-associated network while losing their position in the cancer-associated network. In Figure 2 we can see the proportion of the interested genes in the stray genes and their connectivity switching between the cancer-associated and normal-associated networks.
Conclusions
This study is aims to analyse the difference of non-linear gene co-expression network between cancer-associated network and normal-associated network. We first introduce the TMM method to normalize the gene expression to reduce the bias of samples. Then, the significantly differentially expressed genes which are detected with the DESeq method are used to construct the co-expression network. To protect the non- linear nature of the biological system, we use the dCor, which is powerful in most cases, to measure the dependence between genes and replace the original correlation measure in WGCNA to construct the non-linear weighted gene co-expression network for both the gastric cancer and normal samples. To find interested genes in all the differentially expressed genes, we identify the modules in the two networks respectively and find only one module in each network. The genes which are in the module of normal-association but not in the module of cancer-association network are selected for further analysis and call these genes stray genes for easy reference.
Three aspects are discussed in this paper for these stray genes, which are regulation of gene expression, difference of connectivity between the two networks and the biological validation. We find that in the stray genes, the proportion of the up-regulated genes are enriched compared to the total differentially expressed genes. Through comparing the connectivity of genes between the two networks, we find that most genes display a trend of loss of connectivity in the cancer-associated network. Especially for the stray genes, they all have a lager connectivity value in the normal-associated network while the values are decreased greatly in the cancer-associated network. The discoveries of the switching of gene expression and connectivity inspire us to explore the biological implication of the activation of stray genes. We performed GO analysis to examine the biological process and the pathway enrichment for the up-regulated genes in the stray genes. The results show that these up-regulated genes are enriched in the biological process such as cell cycle, mitosis and chromosome segregation which are related closely to the cancer. The pathway enrichment test results also indicate that these up-regulated genes play important roles to the gastric cancer formation and these genes will be useful to the diagnosis of gastric cancer.
Acknowledgement
This work has been supported by the National Natural Science Foundation of China (Grant NO.61572180).
References
- Jemal A, Bray F, Melissa M Ferlay J, Ward E, Forman D. Global cancer statistics. Cancer J Clin 2011: 61: 69-90.
- Hardcastle TJ, Kelly KA. baySeq, empirical Bayesian methods for identifying differential expression in sequence count data. BMC Bioinform 2010; 11: 422.
- Anders S, Huber W. Differential expression analysis for sequence count data. Genome Biol 2010; 11.
- Robinson MD, McCarthy DJ, Smyth GK: edgeR, a bioconductor package for differential expression analysis of digital gene expression data. Bioinform 2010; 26: 139-140.
- Sipko VD, Urmo V, Adriaan van der G, Lude F, Joao PM. Gene co-expression analysis for functional classification and gene-disease predictions. Brief Bioinform 2017; 1-18.
- Junyi L, Yi XL, Yuan YL. Differential Regulatory analysis based on coexpression network in cancer research. Biomed Res Int 2016; 2016.
- de la FA. From differential expression to differential networking identification of dysfunctional regulatory networks in diseases. Trends Gene 2010; 26: 326-333.
- Anglani R, Creanza TM, Liuzzi VC, Piepoli A, Panza A, Andriulli A, Ancona N. Loss of connectivity in cancer co-expression networks. PLoS One 2014; 9: e87075.
- Ruan J, Dean AK, Zhang W. A general co- expression network-based approach to gene expression analysis. comparison and applications. BMC Sys Biol 2010; 4: 8.
- Zhang B, Horvath S. A general framework for weighted gene co-expression network analysis. Stat Appl Gene Mol Biol 2005; 4: 1128.
- Langfelder P, Horvath S. WGCNA, an R package for weighted correlation network analysis. BMC Bioinform 2008; 9: 559.
- Fuller TF, Ghazalpour A, Aten JE, Drake TA, Lusis AJ, Horvath S. Weighted gene co-expression network analysis strategies applied to mouse weight. Mammalian Genome 2007; 18: 463-472.
- Lgnacio RM, Zelmina LP. Co-expression network analysis for identifying modules and functionally enriched pathways in type 1 diabetes. PLoS One 2016; 1.
- Lu X, Deng Y, Huang L, Feng B, Liao B. A co-expression modules based gene selection for cancer recognition. J Theoret Biol 2009.
- Liu N, Liu X, Zhou N, Wu Q, Zhou L, Li Q. Gene expression profiling and bioinformatics analysis of gastric carcinoma. Exp Mol Pathol 2014.
- Barbosa FC, Arrais JP, Oliveira JL. Weighted gene co-expression network analysis applied to head and neck squamous cell carcinoma data International Conference on Health Informatics 2014; 300-303.
- Rau CD, Wisniewski N, Orozco LD, Bennett B, Weiss J, Lusis AJ. Maximal information component analysis: a novel non-linear network analysis method. Front Gene 2013; 4.
- Szekely GJ, Rizzo ML. Brownian distance covariance. Ann Appl Stat 2009; 3: 1236-1265.
- Szekely GJ, Rizzo ML, Bakirov NK. Measuring and testing dependence by correlation of distances. Ann Stat 2007; 35: 2769-2794.
- Simon N, Tibshirani R. Comment on detecting novel associations in large data sets by Reshef. Science arXiv Preprint 2014; 1401: 7645.
- http://cancergenome.nih.gov/ ,TCGA Database.
- Robinson MD, Oshlack A. A scaling normalization method for differential expression analysis of RNA-seq data. Genome Biol 2010; 11: 25.
- Langfelder P, Zhang B, Horvath S. Defining clusters from a hierarchical cluster tree: the dynamic tree cut package for R. Bioinformatics 2008; 24: 719-720.
- Mi H, Muruganujan A, Thomas PD. PANTHER in 2013: modeling the evolution of gene function, and other gene attributes, in the context of phylogenetic trees. Nucleic Acids Res 2013; 41: 377-386.