Research Paper - Journal of Clinical Dentistry and Oral Health (2018) Volume 2, Issue 1
Stress distribution and displacement of maxilla in micro-implant assisted rapid palatal expansion: A comparative three dimensional finite element analysis
Rajesh Murugan*, Gnana Shanmugham, Saravanan B, Kannan MS, Nithya MuruganSree Balaji Dental College and Hospital, Chennai, India.
- Corresponding Author:
- Rajesh Murugan
Sree Balaji Dental College and Hospital Chennai
India
Tel: 9841124950
E-mail: drrajeshmurugan@gmail.com
Accepted date: October 17th, 2017
Citation: Murugan R, Shanmugham G, Saravanan B, et al. Stress distribution and displacement of maxilla in micro-implant assisted rapid palatal expansion: A comparative three dimensional finite element analysis. J Clin Dentistry Oral He alth. 2018;2(1):13-24.
DOI: 10.35841/oral-health.2.1.13-24
Visit for more related articles at Journal of Clinical Dentistry and Oral HealthAbstract
Aims & Objective This study was to analyze and compare, stress distribution and displacement of fused maxilla and circumaxillary structures between two different micro-screw assisted rapid palatal expanders (MARPE) using Finite Element Method. Materials & Methods Two different sizes of microscrew implants were used in our study. In Type 1?2 ? 10mm (Orlus implant, Ortholution, Korea ) microscrew implants was used with expansion screw and connected to the expander via INSERTION slot. In Type 2?2 ? 12mm (Orlus implant, Ortholution, Korea) micro-screw implants used with expander. Activation were done transversely for 0.25mm. Geometric non-linear theory was applied to evaluate Von-Mises stress distribution and displacement. Results The stress and strain distribution from forces applied to the circumaxillary sutures, mainly along the suture showed Type 1 had more stress and strain distribution than Type 2. In addition, Type 2 showed more amount of displacement in the midpalatal sutural region. Conclusion In conclusion, Type 2 can offer better and further skeletal expansion with increased fracture resistance and stability than Type 1.
Keywords
Micro-screw assisted rapid palatal expanders, Finite Element Method (FEM), Stress distribution, Strain distribution, Circumaxillary sutures.
Introduction
Prevalence of maxillary transverse deficiency is most common in deciduous and mixed dentition, compared to adult orthodontic patients. Deficiency is about 8% to 23% in the deciduous and mixed dentitions and less than 10% in adult orthodontic patients [1].
Etiology for transverse deficiency is multifactorial1. One of the better ways to alleviate the deficiency is Rapid Palatal Expansion (RPE). Chaconas and Caputo stated that the major resistance to rapid palatal expansion forces was not the suture but other articulations in the maxilla, such as the zygotic and spheroidal sutures [1]. Conventionally, Surgically Assisted RPE (SARPE) has been applied to overcome the decreased elasticity of bone and increased resistance of interdigitated mid-palatal suture in adults [2-4].
Currently, Temporary Anchorage Devices (TAD) have been applied to correct this transverse deficiency in adult orthodontic patients. In recent years, a palatal expansion design has been developed with a jackscrew attached to the palatal vault by means of temporary anchorage device [5]. Lee et al. [6] reported a clinical report with miniscrews in the paramedian area for a bone-borne expander connected to teeth [7]. Lagravere et al. have assessed the effect of boneborne expansion appliance with palatal slope anchor [8]. The treatment effect of RPE have been extensively studied through various methods including analysis of photoelastic models [9], laser holography [10], and 3D finite-element (FE) models [11-16]. Treatment effect of MARPE Type 1 & 2 compared for biomechanical variables such as displacements, strains and stresses through the FE models in our study.
Materials and Methods
The FE meshed model skull was obtained from a 30 years old, male patient’s Computed Tomography (CT) data. The spiral CT scanning was performed with the following parameters: 120 kV, 360 mA, matrix size of 512 × 512, and the slice thickness of 0.300 mm and voxel 0.463×0.463×0.300.
Finite element model
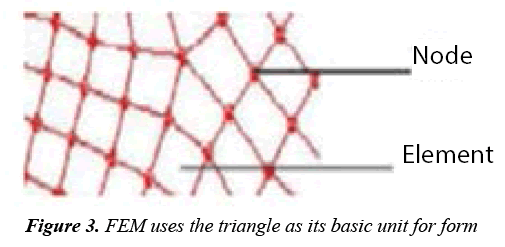
This meshed skull model excluding maxilla and dento -alveolar structures was divided into 5 mm tetrahedrons whereas maxilla including teeth and alveolar bone into 1 mm tetrahedrons. Periodontal ligament, alveolar bone and teeth were considered to be a homogenous and isotropic material.
Material properties of each component were reported earlier as shown in Table 1 [17,18].
| MATERIALS | YOUNGS'S MODULUS (MPa) | POISSON'S RATIO |
|---|---|---|
| Dipole | 1378 | 0.22 |
| Table | 10204 | 0.3 |
| Cortical Bone | 13700 | 0.3 |
| Cancellous bone | 1370 | 0.3 |
| PDL | 50 | 0.49 |
| Enamel | 80350 | 0.33 |
| Dentin | 19890 | 0.31 |
| Suture | 10 | 0.49 |
| Titanium | 113000 | 0.33 |
Table 1: Material Properties
Boundary conditions
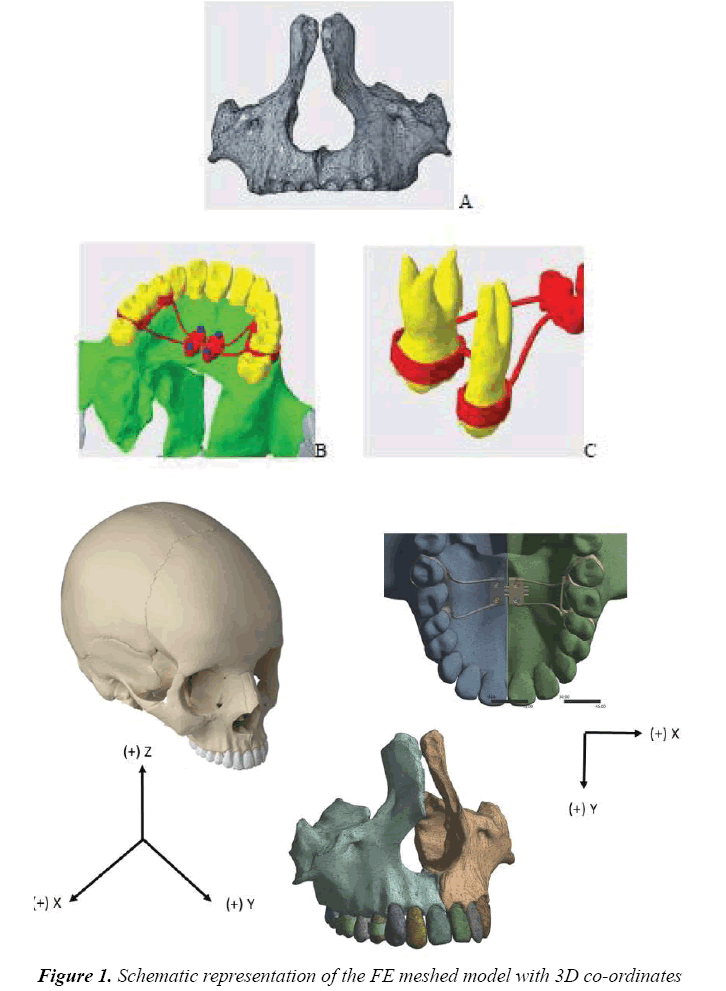
The 3D co-ordinate axis was X-transverse direction plane; Y-antero-posterior direction plane; and Z-vertical direction plane. The origin point Foramen Magnum was fixed completely, as suggested by Gautam et al. [19]. Forward, outward and upward displacements were indicated by positive values on the X, Y, and Z planes. The models were sectioned by XYZ planes and were placed to analyze stress distribution and displacement (Figure 1).
Forward, outward and upward displacements were indicated by positive values on the X, Y, and Z planes. The models were sectioned by XYZ planes and were placed to analyze stress distribution and displacement (Figure 2).
Design of the marpe appliance
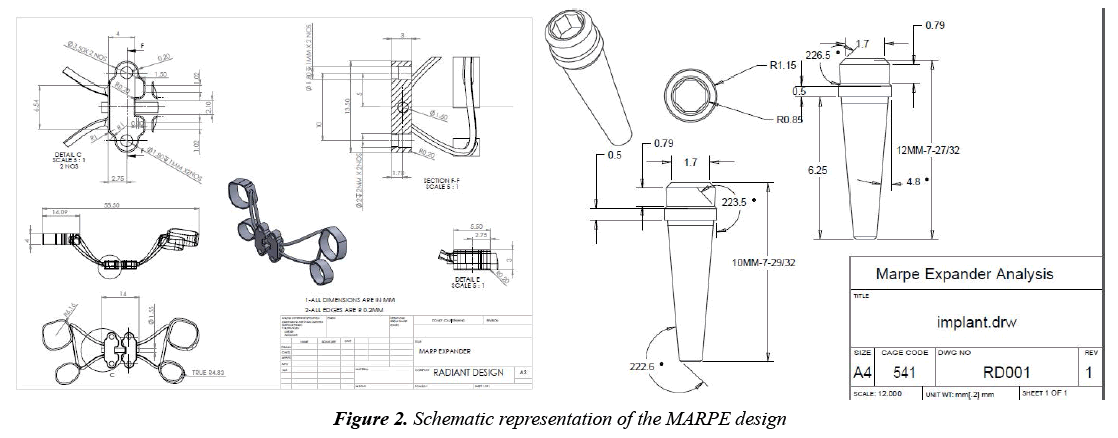
In our study, Micro-screw assisted rapid maxillary expansion device is composed of Hyrax screw with extensions attached to first premolars and first molars and insertion slots of 1.5×2 mm for micro screw implant placement (modified Dr. Won Moon’s MSE design).
The bands were (meshed using shell elements connected to teeth using tied interface) connected with 0.9 mm stainless steel wire (modeled using beam elements) on the palatal sides. Expansion screw (MARPE) of 0.25 mm expansion per turn, 10 mm pitch was selected. Two different sizes of micro screw implants were used in our study. In Type 1–2×10 mm and Type 2–2×12 mm (Orlus implant, Ortholution, Korea) micro-screw implants was used with expansion screw and connected to the expander via designed slot.
Methodology
Activations are done according to the expansion protocol proposed by Dr.Won Moon [20,21]. Expanders were activated transversely in X direction and were unfixed in Y and Z directions to prevent interference with the resultant movement. ANSYS 18.1 workbench (U.S.A) software was used for FE analysis. In FEM, activations are done by increasing the numerical value in the software. For every quarter turn i.e., 0.25 mm, stress distribution, strain energy level and displacement of maxilla were evaluated in the maxillary regions, dento-alveolar regions, implant site and expander placed region. Earlier studies reported palatal expansion for minimal turn only. In our study, we activate the MARPE till the strain limit, to find out the maximum stress, strain and displacement happening in the palate. Type 1 MARPE showed maximum stress, and strain with less displacement comparatively (Table 1 and Figure 3).
Results
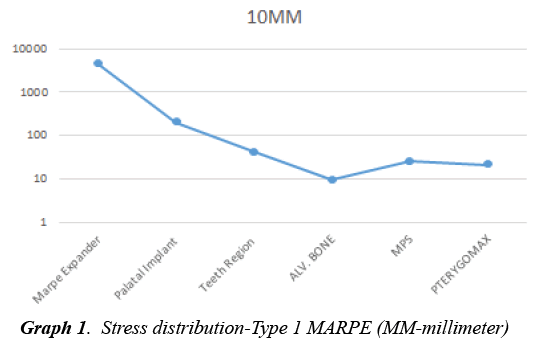
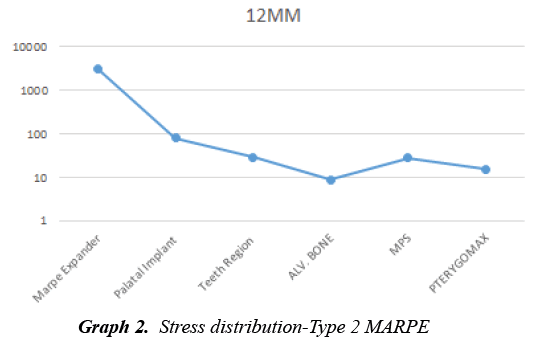
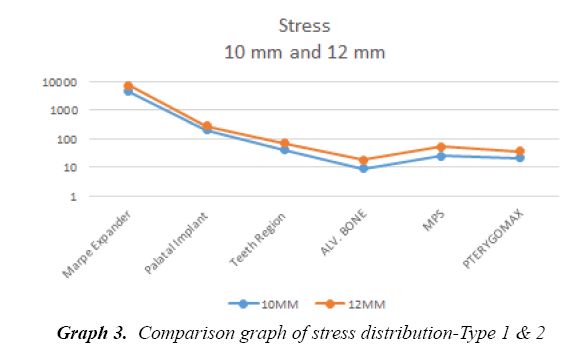
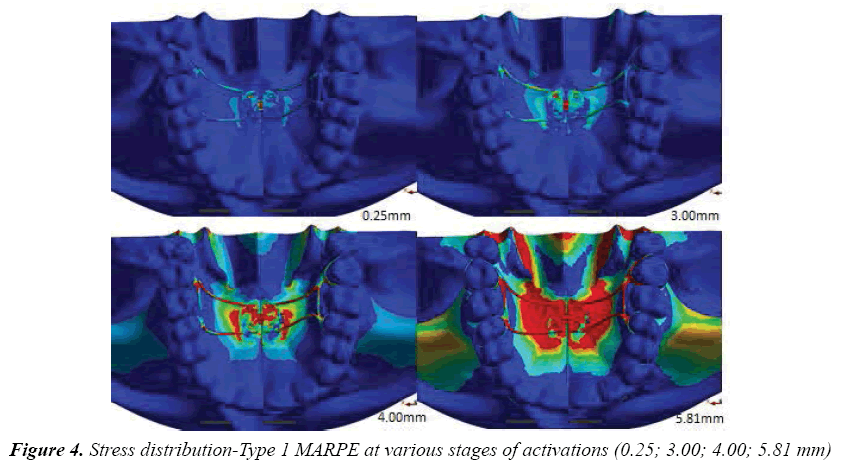
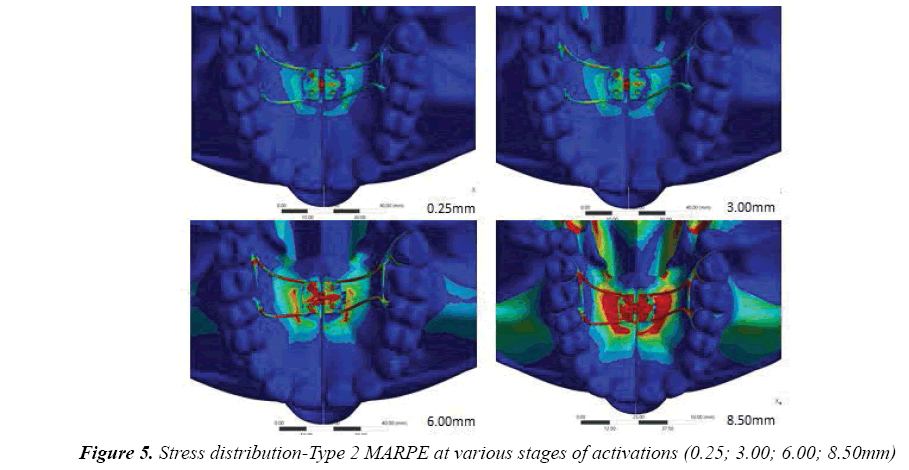
On comparing Type 1 and 2 MARPE, we found that, even though the pattern of stress distribution was same, Type 1 showed more amount of stress distribution in all measured regions. Type 1 showed high stress distribution around the MARPE expander (4464) followed by the micro screw implants (204 MPa) (Graph 1). Less stresses was found to be in the alveolar bone region (9.36 MPa) (Figure 4). Type 2 shows stress distribution more around the MARPE expander (3076.2 MPa), microsrew implants (81.63 MPa), mid palatal suture (28.14MPa) (Graph 2,3). Least amount of stress is distributed around alveolar bone (8.81 MPa), maxillary molars, posterior part of the hard palate. Stress distribution also shown more in the pterygomaxillary region (Figure 5 and Table 2-15).
| REGIONS | TYPE1 | TYPE2 |
| Marpe Expander | 4464.1 | 3076.2 |
| Palatal Implant | 204.01 | 81.63 |
| Teeth Region | 41.35 | 29.674 |
| Alevolar Bone | 9.365 | 8.8171 |
| MPS | 25.214 | 28.148 |
| PTERYGOMAX | 21.135 | 15.41 |
Table 2: Stress distribution-comparison of type 1 and 2 at maximum activation
| Marpe Expander | TYPE 2 | Marpe Expander | TYPE1 |
| 0.25 | 1435.9 | 0.25 | 1575.8 |
| 3 | 1834.8 | 3 | 2527.3 |
| 6 | 2355.3 | 5.81 | 4464.1 |
| 8.5 | 3076.2 |
Table 3: Stress distribution in marpe expander-comparison of type 1 and 2 at various stages of activations
| TEETH REGION | TYPE 2 | TEETH REGION | TYPE1 |
| 0.25 | 15.035 | 0.25 | 18.35 |
| 3 | 19.875 | 3 | 25.1 |
| 6 | 25.124 | 5.81 | 41.35 |
| 8.5 | 29.674 |
Table 4: Stress distribution in teeth region-comparation of type 1 & 2 at various stages of activations
| Palatal Implant | TYPE 2 | Palatal Implant | TYPE1 |
| 0.25 | 3.01E+01 | 0.25 | 1.20E+02 |
| 3 | 4.73E+01 | 3 | 1.51E+02 |
| 6 | 7.04E+01 | 5.81 | 2.04+02 |
| 8.5 | 8.16E+01 |
Table 5: Stress distribution in palatal implant –comparison of type 1 and 2 at various stages of activations
| Alveolar bone | TYPE 2 | Alveolar bone | TYPE1 |
| 0.25 | 6.97E+00 | 0.25 | 7.43E+00 |
| 3 | 7.32E+00 | 3 | 7.80E+00 |
| 6 | 8.23E+00 | 4 | 8.78E+00 |
| 8.5 | 8.82E+00 | 5.81 | 9.37E+00 |
Table 6: Stress distribution in alveolar bone –comparison of type 1 and 2 at various stages of activations
| MPS | TYPE2 | MPS | TYPE1 |
| 0.25 | 18.938 | 0.25 | 19.01 |
| 3 | 19.364 | 3 | 20.0652 |
| 6 | 26.542 | 5.81 | 25.214 |
| 8.5 | 28.148 |
Table 7: Stress distribution in midpalatal suture-comparison of type 1 and 2 at various stages of activations
| PTERYGOMAX | TYPE 2 | PTERYGOMAX | TYPE1 |
| 0.25 | 1.30E+01 | 0.25 | 1.70E+01 |
| 3 | 1.31E+01 | 3 | 1.77E+01 |
| 6 | 1.45E+01 | 5.81 | 2.11E+01 |
| 8.5 | 1.54E+01 |
Table 8: Stress distribution in pterygomaxillary region-comparison of type 1 & 2 at various stages of activations
| REGIONS | TYPE1 | TYPE2 |
| Marpe Expander | 0.035 | 0.0179 |
| Palatal Implant | 2.93E-04 | 3.80E-04 |
| Teeth Region | 0.0265 | 0.0135 |
| Alevolar Bone | 1.48E-03 | 6.20E-04 |
| MPS | 0.0154 | 0.0185 |
| PTERYGOMAX | 1.26E-02 | 1.53E-02 |
Table 9: Strain energy-comparison of type 1 & 2 at maximum activation
| Marpe Expander | 12 MM | Marpe Expander | 10 MM |
| 0.25 | 0.00091 | 0.25 | 0.0001 |
| 3 | 0.00132 | 3 | 0.00284 |
| 6 | 0.00546 | 5.81 | 0.03541 |
| 8.5 | 0.01791 |
Table 10: Strain energyin marpe expander-comparison of type 1 & 2 at various stages of activations
| Palatal Implant | 12 MM | Palatal Implant | 10 MM |
| 0.25 | 2.50E-05 | 0.25 | 1.26E-05 |
| 3 | 3.80E-05 | 3 | 1.48E-05 |
| 6 | 2.40E-04 | 5.81 | 2.93E-04 |
| 8.5 | 3.80E-04 |
Table 11: Strain energy in palatal implant region-comparison of type 1 & 2 at various stages of activations
| Teeth Region | 12 MM | Teeth Region | 10 MM |
| 0.25 | 0.0068 | 0.25 | 0.0181 |
| 3 | 0.0095 | 3 | 0.0195 |
| 6 | 0.0102 | 5.81 | 0.0265 |
| 8.5 | 0.0135 |
Table 12: Strain energy in teeth region-comparison of type 1 & 2 at various stages of activations
| Alveolar bone | 12 MM | Alveolar bone | 10 MM |
| 0.25 | 4.25E-05 | 0.25 | 6.26E-05 |
| 3 | 7.18E-05 | 3 | 9.48E-05 |
| 6 | 3.44E-04 | 5.81 | 1.48E-03 |
| 8.5 | 6.20E-04 |
Table 13: Strain energy in alveolar bone-comparison of type 1 and 2 at various stages of activations
| MPS | TYPE2 | MPS | TYPE1 |
| 0.25 | 0.00012 | 0.25 | 0.00267 |
| 3 | 0.0085 | 3 | 0.00518 |
| 6 | 0.0138 | 5.81 | 0.01544 |
| 8.5 | 0.0189 |
Table 14: Strain energy in midpalatal suture-comparison of type 1 & 2 at various stages of activations
| PTERYGOMAX | TYPE 2 | PTERYGOMAX | TYPE1 |
| 0.25 | 8.55E-03 | 0.25 | 7.81E-03 |
| 3 | 9.84E-03 | 3 | 8.55E-03 |
| 6 | 1.24E-02 | 5.81 | 1.26E-02 |
| 8.5 | 1.53E-02 |
Table 15: Strain energy in pterygomaxillary region-comparison of type 1 & 2 at various stages of activations
Strain energy
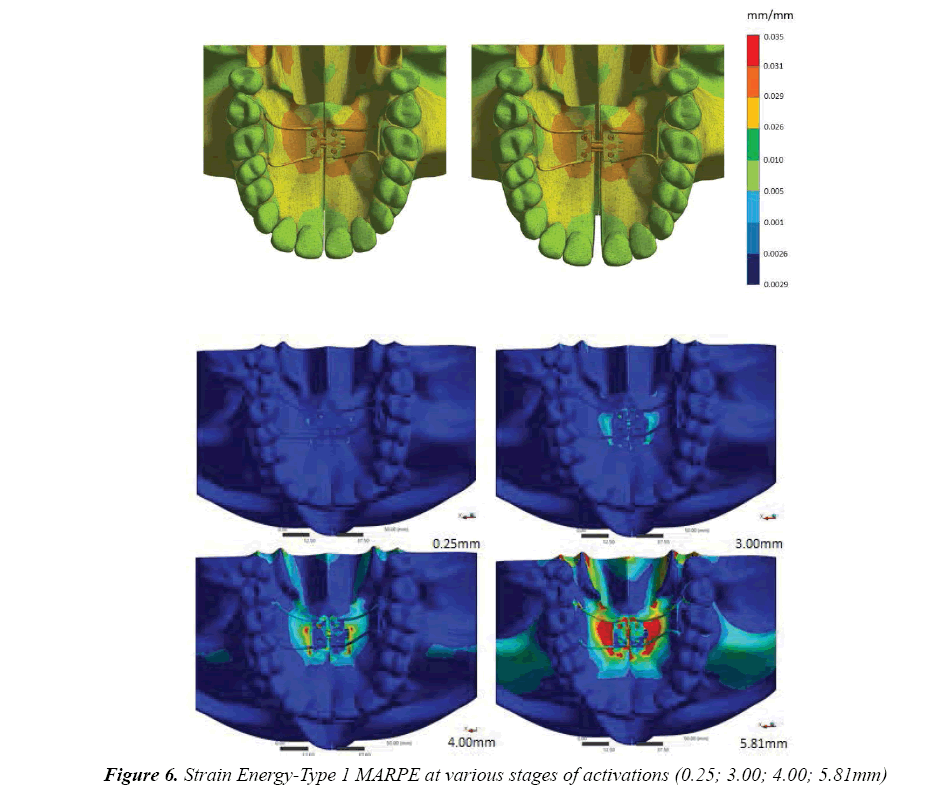
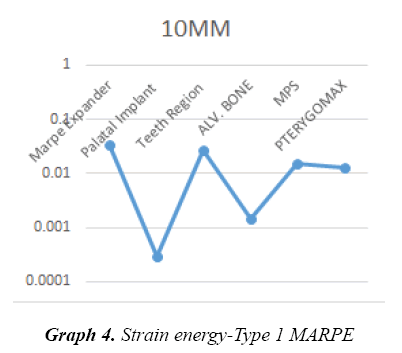
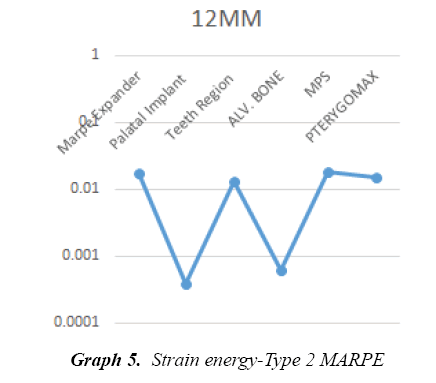
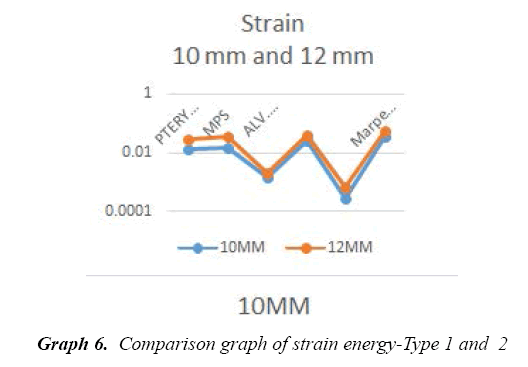
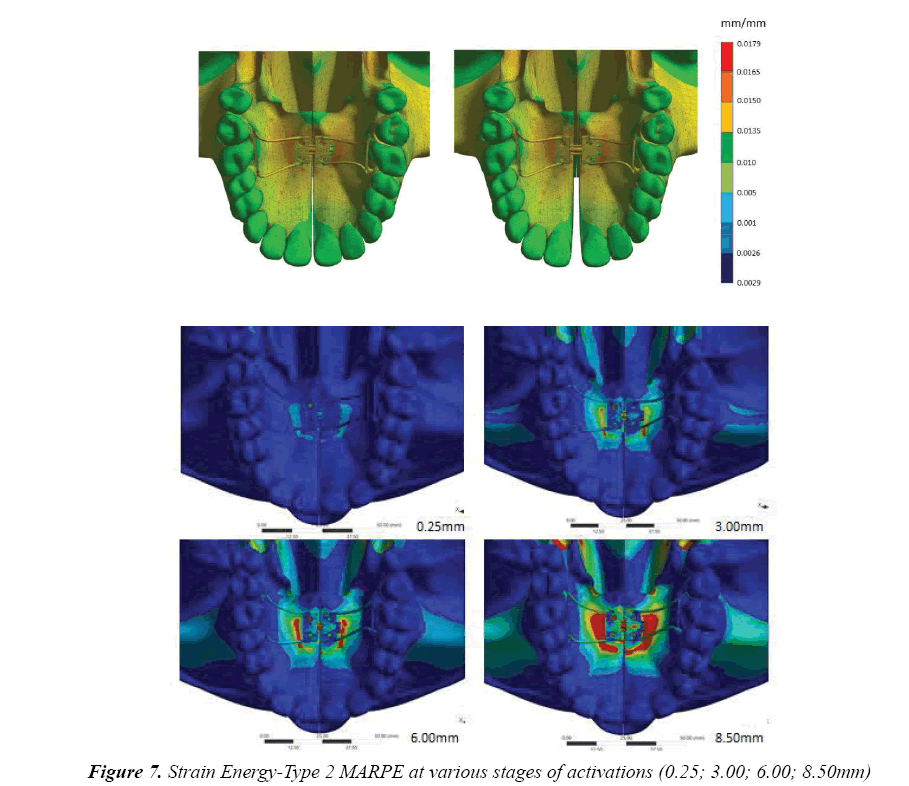
On comparing Type 1 and 2 MARPE, strain energy was more in Type 1 when compared to Type 2 except in the alveolar bone region. Type 1 showed more strain in the micro screw implant (2.93 MPa) followed by the alveolar bone (1.48e-03MPa), whereas Type 2 showed more strain energy in the alveolar bone (6.20e-04 MPa) followed by micro screws, particularly, posterior ones (Figure 6 and Graph 4-6).
The least amount of strain in and around the dento alveolar region was shown by only (Figure 7).
Displacement of the bone
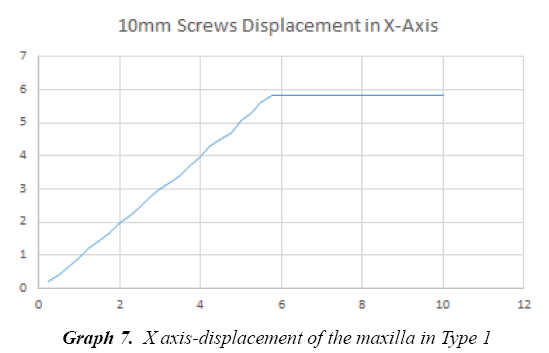
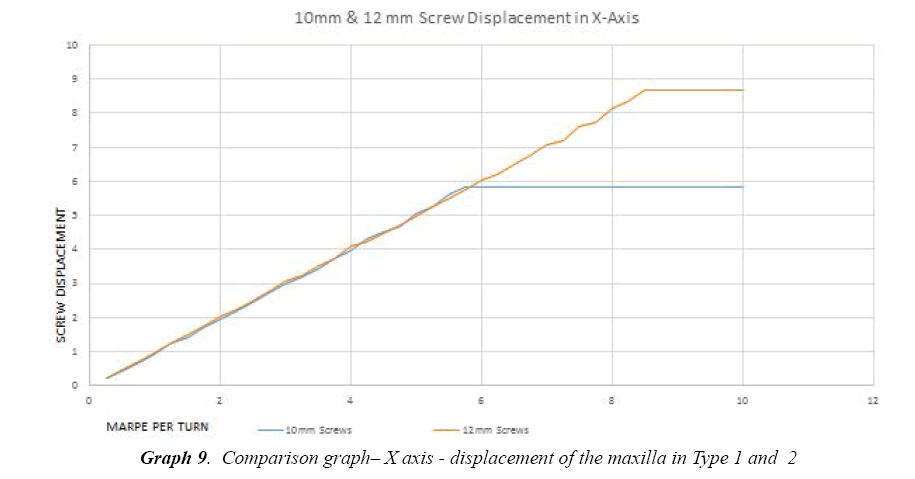
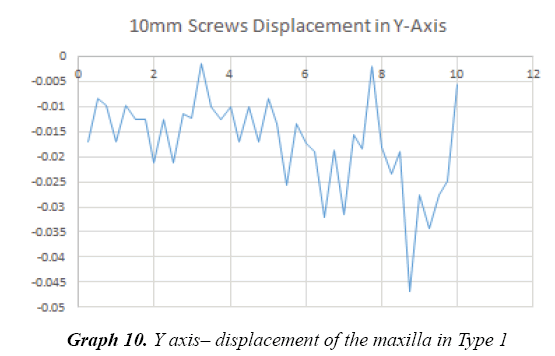
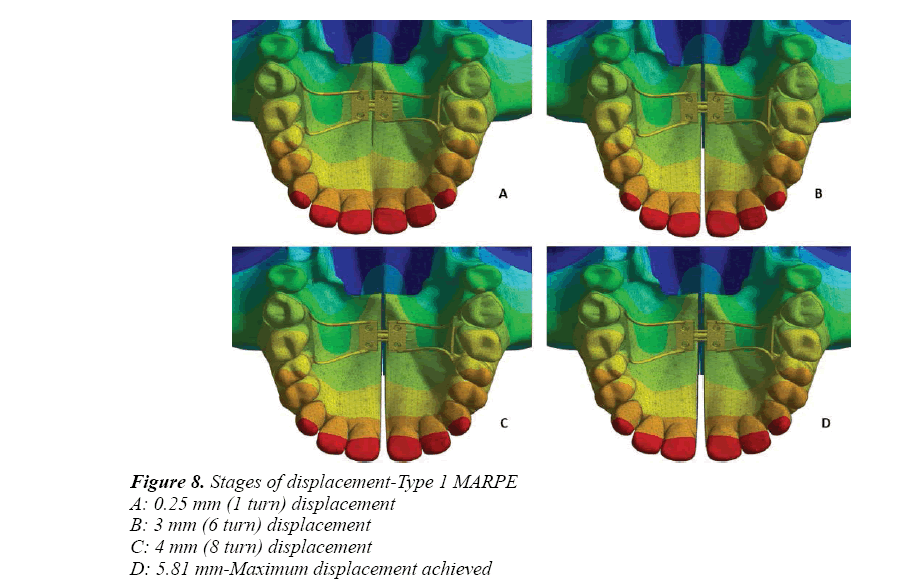
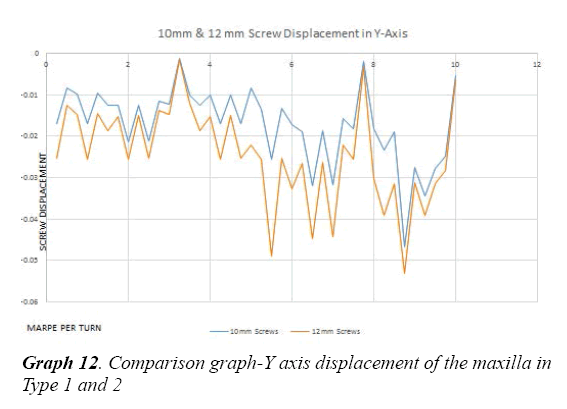
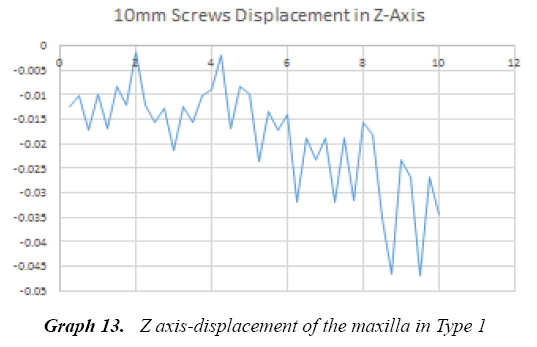
Type 1 MARPE showed displacement in the maxillary mid-palatal region of around 0.20 mm for every one turn of the expander. It showed a maximum displacement of 5.81 mm of the mid palatal suture (Graph 7,10,13). Study showed more amount of displacement in the anterior region as the expander was activated beyond 5 mm (Figure 8).
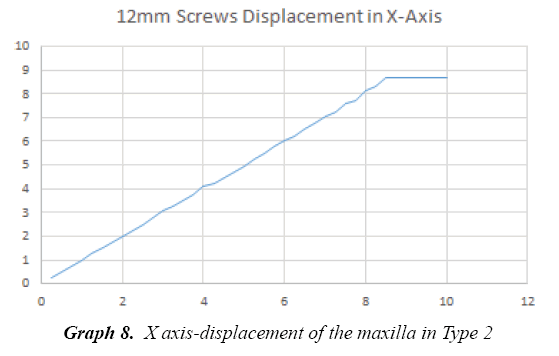
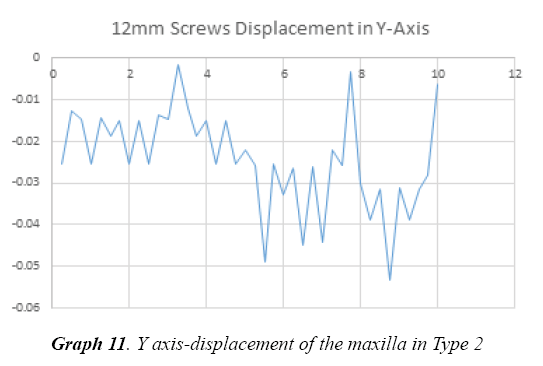
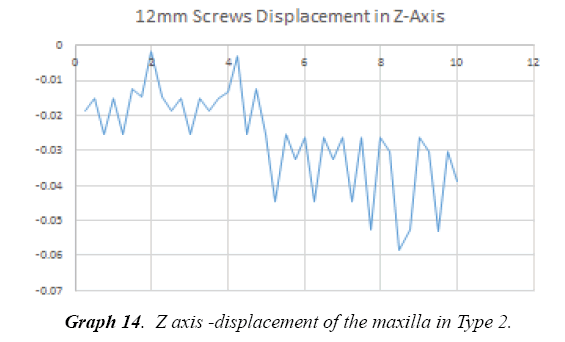
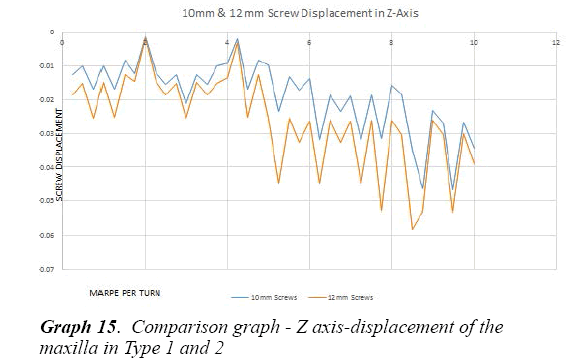
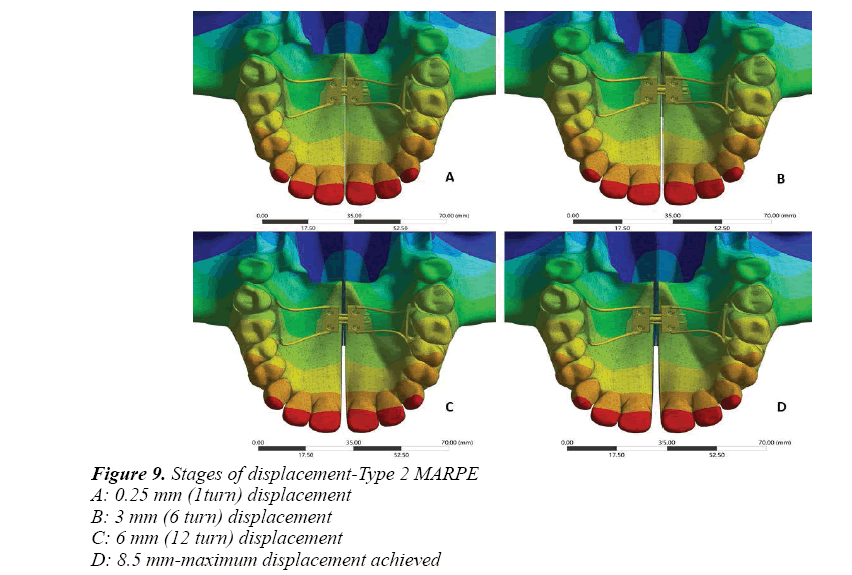
Type 2 MARPE showed displacement of around 0.22 mm which was not significantly different for every one turn of the expander (Graph 8, 9, 11, 12). But comparatively it showed a maximum displacement of the mid palatal suture by 8.68 mm (Figure 9 and Graph 14, 15). Similar to Type 1more displacement was seen in the anterior region beyond 5 mm of activation.
Discussion
The fact that the mid-palatal suture can be widened and the palate expanded by orthodontic appliances after the age of 10 years is probably more a reflexion of its special character in being only in part a tension resisting joint and in having deep, relatively flat, opposing surfaces which would appear to be adapted to resist intermittent medial pressures. It appears that at no time after the cessation of sutural growth does synostosis take place in the mid-palatal suture. Possibly the range of masticatory movements characteristic of man, causing constant slight movement of the bones, is one of the factors involved [22].
Medial Borders of the hemi-maxillae, which grow toward each other until they are mechanically interlocked, progress along the following postnatal development stages: synibrosis, broad distance between parallel borders; synarthrosis, narrower sinuous course; synostosis, complete interdigitation [23]. However, the age at full suture ossification (synostosis) has not been definitely determined in the literature.
Recent histological studies revealed that only the anterior third of the suture was ossified in human beings older than 70 years, although ossification appeared complete on radiographs. Histological studies have demonstrated that caution should be taken when defining the stage of ossification using imaging exams [24].The selected expander should have the greatest expansion capacity and at the same time should maintain ideal vertical distance from the palatal mucosa.
Since conventional rapid palatal expanders that are either tooth-borne (hyrax type) or tooth and tissue-borne (Haas type) cause questionable effects on the basal bone, a rigid element that delivers the expansion force directly to the basal bone could be a solution. For this purpose, a Miniscrew-assisted Rapid Palatal Expander (MARPE) was designed and used in an adult patient [25]. From this point of evidence MARPE gained popularity and various designs evolved for treating thereafter [5,23,26-30].
Previously reported studies about MARPE dealt with its potential efficacy for treating transverse discrepancies [28,29,31,32]. There were studies related to MARPE by comparing it with other expanders for palatal expansion which were used traditionally [1,5,27]. Also FEM studies were done to evaluate the stress distribution associated with MARPE during maxillary expansion [5,33]. Also studies were done recently on the effect of varying degrees of cortical anchorage of the implants [34,35].
Taken all these factors into consideration, our study was aimed to evaluate and compare not only the stress distribution but also the strain energy and displacement level achieved from initial to maximum activations, when screws of two different dimension were used to anchor the appliance to the palatal bone.
Position and design of marpe
In this study positioning of the MARPE was done in such a way that the body should be placed as posterior as possible, close to the junction of hard and soft palate. By this, MARPE is able to generate forces to overcome initial resistance and induce parallel opening of the mid-palatal suture [36]. MARPE used in our study is a simple modification of a conventional RPE appliance. The basic design was according to researcher [28,34] except for the anterior arm extended and soldered in the premolar region, rather than both the arms in first molar region as in Won Moon’s design. Positioning of the anchoring implants was according to Won Moon’s recommendation (3 mm lateral to the mid palatal suture) [37,38].
Dimension of implants
The stresses in cortical bone layer surrounding the miniscrew implant are affected by miniscrew implant diameter, head length, and thread size as well as the elastic modulus of cancellers bone and may therefore affect its stability [39]. The size of the implants used in MARPE for our study (10 mm and 12 mm) were chosen based on Carlson et al. [29] recommendation. According to him the length of the mini screws should be chosen considering the following factors, 2 mm height of the insertion slots, 1 to 2 mm of space between the appliance and the palatal surface, 2 mm thickness of gingiva. So for a desired 5 to 6 mm of bone engagement we need to choose a minimum length of at least 10 mm. As there is no direct literature evidence for the mini screw dimension considerations for MARPE, our study compared two mini screws of different dimensions.
FEM
Finite Element Analysis (FEA) is a numeric approximation technique that is widely used to assess biomechanical problems. FEA has been applied to study different aspects of bone -borne expanders, mainly stress distribution and displacement as well as its biomechanical effects on craniofacial sutures. However, no study has compared dimensions of microscrew implants using FEA. Finite element method is more highly dependent on the accuracy of the finite element model. The FEM modeling software (ANSYS) used in our study allows us to access sutures and palatal region more accurately and convincingly. Earlier studies [1,5,40,41] on MARPE reported that mid-palatal and pterygomaxillary sutures are the primary anatomic resistance to skeletal expansion in adult patients [42]. In our study we found that the pterygomaxillary region showed more stress next to the midpalatal suture. MARPE region showed the highest stress followed by the palatal implant region. Lee et al. [5] compared conventional RPE, SARPE and MARPE for stress concentration and found more stress in MARPE around the anchorage areas in similarity with our study. MacGinis et al. [1] compared the stress distribution between conventional RPE & MARPE and reported less stress distribution around the buttress region namely nasomaxillary, zygomaticomaxillary and pterygomaxillary region in marpe. As there is more resistance displayed in the palate posteriorly due to its anatomic constraints, more stress was found in the pterygomaxillary region.
When compare with Type 1 and 2 in there was wide stress distribution found around the mid palatal region and the assembly of MARPE Type 1. On initial activation there was mild stress in the MARPE Type 2, followed by the implant region. Later on, during maximum activation there was more stress in the implant region, mid palatal suture and the pterygomaxillary region. Robert J. Lee [34] in their study reported that variation in the depth of miniscrew penetration did not influence significantly on stress distribution at the end of maximum activation. In contrast, our study found that longer screw had more anchorage and less stress distribution at the end of maximum activation. Stress displacement was measured in our study in the MARPE region, implant region, mid palatal sutural area and the teeth region.
On maximum displacement beyond the proportional limit of the MARPE, we found there is more strain occurring in the posteriorly placed implants. More strain is observed in Type 1 implants throughout the activation cycle. At 5.81 mm of palatal expansion, Type 1 implants fractured at a strain value of 2.93e-04MPa. At the same point of expansion, Type 2 implants showed comparatively less strain value of 2.40e-04MPa. Even at increased strain value of 3.80e-04MPa at maximum expansion, Type 2 implants did not fracture. Because of this, the deformation of the posterior implants in the MARPE occurred, resulting in failure of the simulation in FEM. The point or the expansion that occurred before this deformation is calculated as the maximum expansion obtained from the respective MARPE. The trend of increased strain on posterior implants leading to fracture may be due to the proximity to more anatomical resistance. As of now, no literature evidence is available on this aspect. A clinical co-relation on implant failure may throw more light on this and help us evolve on future MARPE design which resists implant fracture.
Nonparallel displacement of the maxillary halves was reported, interestingly, with wider opening in the anterior palatal region [43]. Our study showed parallel displacement till 20 turns of the expander, over this, which it showed more displacement towards the anterior part of the palate. Displacement was calculated on every activation of MARPE and on an average; we took 4activation stages for each implant and assessed the same. Earlier studies researchers [1,25,41] reported a maximum displacement and there were no data for every activation as described in our study. MacGinis et al. [1] reported that as the expansion forces are kept closer to the maxilla’s center of resistance, less tipping occurs with a more lateral translation of the complex. Our study showed that during palatal expansion, there is clockwise rotation of the maxilla in X axis which is more in Type 2 (0.03MPa) than Type 1 (0.01MPa) with little or minimal tipping. No rotational tendency was observed in Y and Z axis, which indicates that there is parallel displacement of the maxillary halves.
Future Studies
In the present study we have evaluated the strain energy level and displacement achieved by MARPE along with stress distribution prevailing in the maxilla. Also we have studied that maximum strain is the same for both miniscrew dimensions, but the expansion achieved is variable. Further research and additional simulated studies can be done to evaluate the stress, strain and displacement using different materials for miniscrews used in MARPE i.e., by comparing the stainless steel miniscrew and titanium miniscrews. Also the penetration depth of the region should be assessed with more advanced software.
Conclusion
No concrete evidence has shown that the palatal suture is completely fused at the end of facial growth, which makes this treatment theoretically applicable at any age and phase of life.
To conclude
• In Type 1 fracture at 5.81 mm of activation while Type 2 resist fracture even at 8.51 mm of activation.
• Type 1 displayed more amount of stress concentration in all areas when compared to Type 2. But both showed similar pattern of stress distribution with maximum stress in the expander region.
• Type 1 & 2 showed parallel displacement up to 20 turns beyond which there was non-parallel displacement.
Type 2 can offer better and further skeletal expansion with increased fracture resistance and stability, when compared to Type 1.
References
- MacGinnis M, Chu H, Youssef G, et al. The effects of micro-implant assisted rapid palatal expansion (MARPE) on the nasomaxillary complex—a finite element method (FEM) analysis. Progress in Orthodontics. 2014;15:52.
- Kokich VG. Age changes in the human frontozygomatic suture from 20 to 95 years. Am J Orthod. 1976;69(4):411-30.
- Harzer W, Schneider M, Gedrange T, et al. Direct bone placement of the hyrax fixation screw for surgically assisted rapid palatal expansion (sarpe). J Oral Maxillofac Surg. 2006;64:1313–7.
- Tausche E, Hansen L, Hietschold V, et al. Three-dimensional evaluation of surgically assisted implant bone-borne rapid maxillary expansion: a pilot study. Am J Orthod Dentofacial Orthop. 2007;131:S92–9.
- Lee HK, Bayome M, Ahn CS, et al. Stress distribution and displacement by different bone -borne palatal expanders with micro-implants: a three-dimensional finite-element analysis. Eur J Orthod. 2014;36:531-40.
- Lee KJ, Park YC, Park JY, et al. Miniscrew-assisted nonsurgical palatal expansion before orthognathic surgery for a patient with severe mandibular prognathism. Am J Orthod Dentofacial Orthop. 2010;137(6):830–9.
- Petrey JS, Saunders MM, Kluemper GT, et al. Temporary anchorage device insertion variables: effects on retention. Angle Orthod. 2010; 80(4): 634-41.
- Lagravere MO, Carey J, Heo G, et al. Transverse, vertical, and anteroposterior changes from bone-anchored maxillary expansion vs traditional rapid maxillary expansion: a randomized clinical trial. Am J Orthod Dentofacial Orthop. 2010;137(3):304.e1-12.
- Lima SM Jr, de Moraes M, Asprino L. Photoelastic analysis of stress distribution of surgically assisted rapid maxillary expansion with and without separation of the pterygomaxillary suture. J Oral Maxillofac Surg. 2011;69(6):1771-5.
- Pavlin D, Vukicevic D. Mechanical reactions of facial skeleton to maxillary expansion determined by laser holography. Am J Orthod. 1984;85(6):498-507.
- Işeri H, Tekkaya AE, Oztan O, et al. Biomechanical effects of rapid maxillary expansion on the craniofacial skeleton, studied by the finite element method. Eur J Orthod. 1998;20(4):347-56.
- Jafari A, Shetty KS, Kumar M. Study of stress distribution and displacement of various craniofacial structures following application of transverse orthopedic forces–a three-dimensional FEM study. Angle Orthod. 2003;73(1):12-20.
- Yu HS, Baik HS, Sung SJ, et al. Three-dimensional finite-element analysis of maxillary protraction with and without rapid palatal expansion. Eur J Orthod. 2007;29(2):118-25.
- Han UA, Kim Y, Park JU. Three-dimensional finite element analysis of stress distribution and displacement of the maxilla following surgically assisted rapid maxillary expansion. J Craniomaxillofac Surg. 2009;37(3):145-54.
- Lee H, Ting K, Nelson M, et al. Maxillary expansion in customized finite element method models. Am J Orthod Dentofacial Orthop. 2009;136(3):367-74.
- Boryor A, Hohmann A, Wunderlich A, et al. In-vitro results of rapid maxillary expansion on adults compared with finite element simulations. J Biomech. 2010;43(7):1237-42.
- Rees JS, Jacobsen PH. Elastic modulus of the periodontal ligament. Biomaterials. 1997;18(14): 995–9.
- Mahoney E, Holt A, Swain M, et al. The hardness and modulus of elasticity of primary molar teeth: an ultra-micro-indentation study. J Dent. 2000;28(8):589-94.
- Gautam P, Valiathan A, Adhikari R. Stress and displacement patterns in the craniofacial skeleton with rapid maxillary expansion: A Finite Element Method study. Am J Orthod Dentofacial Orthop. 2007;132(1):5.e1-11.
- Machado AW, Huang G, Caldas SR. An interview with Won Moon. Dental Press Journal of Orthodontics. 2013;18(3):12-28.
- Holberg C, Winterhalder P, Rudzki-Janson I, et al. Finite element analysis of mono- and bicortical mini-implant stability. Eur J Orthod. 2014;36(5):550-6.
- RA Latham. The development, structure and growth pattern of the human mid-palatal suture. J Anat. 1971;108(Pt 1): 31–41.
- Sung-Hwan C, Kyung-Keun S, Jung-Yul C, et al. Non-surgical minscrew-assisted rapid maxillary expansion results in acceptable stability in young adults. Angle Orthod. 2016;86(5):713-20.
- N’Gu yen T, Ayr al X, Vacher C. Radiographic and microscopic anatomy of the mid-palatal suture in the elderly. Surg Radiol Anat. 2008;30(1):65-8.
- Baccetti T, Franchi L, Cameron CG, et al. Treatment timing for Rapid Maxillary Expansion. Angle Orthod. 2001;71(5):343-50.
- Handelman CS, Wang L, BeGole EA, et al. Nonsurgical rapid maxillary expansion in adults: report on 47 cases using the Haas expander. Angle Orthod. 2015;70(2):129-44.
- Lin L, Ahn HW, Kim SJ, et al. Tooth-borne vs bone-borne rapid maxillary expanders in late adolescence. Angle Orthod. 2015;85(2):253-62.
- Suzuki H, Moon W, Previdente LH, et al. Miniscrew assisted rapid palatal expander (MARPE): the quest for pure orthopedic movement. Dental Press J Orthod. 2016;23(4):17-23.
- Carlson C, Sung J, Machado AW, et al. Microimplant -assisted rapid palatal expansion appliance to orthopedically correct transverse maxillary deficiency in an adult. Am J Orthod Dentofacial Orthop. 2016;149(5):716-28.
- Cunha AC, Lee H, Nojima LI, et al. Miniscrew – assisted rapid palatal expansion arch perimeter in an adult patient. Dental Press J Orthod 2017; 22(3): 97-108.
- Kim KB, Helmkamp ME. Miniscrew implant –supported rapid maxillary expansion. J Clin Orthod. 2012;46(10):608-12
- Craig W, Jester. Palatal Expansion In Adults: Non-Surgical Skeletal Development. Journal of the American Orthodontic Society. 2014.
- Holberg C, Winterhalder P, Rudzki-Janson I, et al. Finite element analysis of mono and bicortical mini-implant stability. Eur J Orthod. 2014;36(5):550-6.
- Lee RJ, Moon W, Hong C. Effects of monocortical and bicortical mini -implant anchorage on bone-borne palatal expansion using finite element analysis. Am J Orthod Dentofacial Orthop. 2017;151(5):887-97.
- Winsauer H, Vlachojannis C, Bumann A, et al. Paramedian vertical palatal bone height for mini –implant insertion: a systematic review. Eur J Orthod. 2014;36(5):541-9.
- Brunetto DP, Sant'Anna EF, Machado AW. Non-surgical treatment of transverse deficiency in adults using Microimplant -assisted Rapid Palatal Expansion (MARPE). Dental Press J Orthod. 2017;22(1): 110-25.
- Park JJ, Park YC, Lee KJ, et al. Skeletal and dentoalveolar changes after miniscrew-assisted rapid palatal expansion in young adults: A cone-beam computed tomography study. The Korean Journal of Orthod 2017.
- Lim HM, Park YC, Lee KJ, et al. Stability of dental, alveolar, and skeletal changes after miniscrew-assisted rapid palatal expansion. Korean J Orthod. 2017;47(2):77-86.
- Duaibis R, Kusnoto B, Natarajan R, et al. Factors affecting stresses in cortical bone around miniscrew implants – A three dimensional finite element study. Angle Orthod. 2012;82(5):875-80.
- Boryor A, Hohmann A, Wunderlich A, et al. Use of a Modified Expander During Rapid Maxillary Expansion in Adults: An In Vitro and Finite Element Study. Int J Oral Maxillofac Implants. 2013;28(1):e11-6.
- Jain V, Shyagali TR, Kambalyal P, et al. Comparison and evaluation of stresses generated by rapid maxillary expansion and the implant-supported rapid maxilla
