Research Article - Journal of Clinical and Experimental Toxicology (2018) Volume 2, Issue 1
Risk assessment of heavy metals associated with food consumption in Egypt: A pilot study.
Asmaa Bayoumi Issa1, Khaled Yasin2, Naglaa Loutfy1, Mohamed Tawfic Ahmed1*
1Faculty of Agriculture, Suez Canal University, Ismailia, Egypt
2Mammalian & Aquatic Toxicology Department, Central Agricultural Pesticides Laboratory, Egypt
- *Corresponding Author:
- Mohamed Tawfic Ahmed
Department of Agriculture
Suez Canal University, Egypt
E-mail: motawfic@tedata.net.eg
Accepted date: March 13, 2018
Citation: Issa AB, Yasin K, Loutfy N, et al. Risk assessment of heavy metals associated with food onsumption in Egypt: A pilot study. J Clin Exp Tox. 2018;2(1):10-19.
Abstract
Residues of some heavy metals (HM) were monitored in vegetable, fruit and fish samples collected from local markets of Tanta and Ismailia cities, Egypt. The acidic digested samples were measured on Inductive Coupled Plasma-Optical Emission Spectroscopy (ICP-OES). Samples of vegetables and fruits collected from the vicinity of main roads had some higher levels than other samples. In case of catfish, HMs were monitored only in Tanta region since this fish species is not consumed much in Ismailia city. The mean values detected were 5.38, 0.62, 85.96, 6.41 and 55.05 mg/kg for Cu, Pb, Zn, Cd and Mn, respectively. Target hazard quotient (THQ) values were higher than unity for all metals at 50th and 90th percentile of ingestion. Meanwhile, hazard Index (HI) showed the following order: Cd?Mn?Cu?Zn?Pb. The present study indicated that the repetitive consumption of particular type fish might pose some undesirable health effects. The study also emphasized the need for regular monitoring program beside the need for awareness raising about the food contamination with heavy metals.
Keywords
Heavy metals, risk assessment, food consumption, Egypt
Introduction
In Egypt several efforts were taken by regulatory bodies to monitor residues of heavy metals and persistent organic pollutants in various environmental matrices [1]. Organic pollutants in of food increasing health risks is that worldwide nations including Egypt didn't provide safety hazardous chemical standard values in foods [2]. Contamination of heavy metals and persistent organic pollutants in food commodities are a key issue, with serious repercussion on public health [3]. Residues of these contaminants have been linked to developmental neurobehavioral problems, altered function of immune cells and possible childhood leukemia [4]. The Total Diet Study or Market Basket Survey Program initiated by Food Drug Administration (FDA) in the early 1960s and modified in 1980s in which dietary intake of selected pesticides, industrial chemicals, toxic elements and radionuclides monitored has been one of the major steps to draw attention to the health impacts of these contaminants [5-7].
Most of HMs are not biodegradable, have long biological halflives and have the potential for accumulation in the different body organs leading to undesirable side effects [8,9]. Studies have also shown that, the intake of HMs can lead to altering of `humans and animals healthiness state. In this respect there is some strong indications that relate the presence of some heavy metals residues in food and the incidence of gastrointestinal cancer [10,11] and cancer of pancreas, urinary bladder or prostate [12].
Food safety is a major public concern worldwide and food consumption has been identified as the major pathway for human exposure to contaminants. During the last decades, the increasing demand of food safety has stimulated research regarding the risk of POPs and HMs associated with food consumption [13,14]. Risks of HMs associated with vegetables, fruits and fish consumption were established in many studies. Vegetables, fruits and fish are able to accumulate higher amounts of contaminants in their tissues. Fish are also considered a good indicator for ecosystem pollution [15-17]. This is an original research paper. So kindly discuss the novelty of this. No current studies have focused on the foods HMs monitoring in Egypt. The present study aims to assess the risk of HMs associated with some vegetables, fruits and fish consumption in two main cities in Egypt, Ismailia located in the East of Egypt and Tanta located in the Centre of Nile Delta.
Materials and Methods
Samples collection
Eighty different samples were collected randomly from markets of each of the two cities. Fish samples were Nile tilapia and catfish, while vegetable samples were tomatoes, cucumber, carrots, potatoes and squash, and fruit samples were peach, orange and pineapple. These kinds of foods are the mostly consumed in these regions. The samples were placed in paper bags, labeled and transferred in ice box to laboratory, labelled and stored at -20°C until used.
Heavy metals analysis
The collected samples were washed with distilled water to remove the dust particles. Then, they were cut to small pieces using clean knife. Different parts (roots, stems and leaves) of vegetables were dried at 100°C. After drying, the samples were grinded into a fine powder using a commercial blender and stored in dissector until used for acid digestion.
Fish
The dried samples were digested with concentrated nitric acid. Ten ml of ultrapure concentrated HNO3 (Merck) were added, and heated on a hot plate for clear solution. After cooling, 10 ml of conc. HCl were added and heated until constant volume. The solution was transferred, diluted and filtered through 0.45 μm nitrocellulose membrane filter [18].
Fruits and vegetables
500 mg of dried sample was put in crucible and digested with perchloric: nitric acid (1:4 v/v) to constant volume. After cooling, the digested samples were filtered and made up to the final volume 30 ml using deionized water [19]. All reagents were of analytical reagent grade. Deionized water was used throughout the study. All the plastics and glass wares were washed in nitric acid for 15 min and rinsed with deionized water before use. Instrumental calibrations with standard solutions were done for optimum conditions.
Inductively coupled plasma optical emission spectroscopy (ICP-OES)
Five metals; Cd, Pb, Mn, Zn and Cu were analyzed through Inductively Coupled Plasma Optical Emission Spectroscopy (ICP-OES) instrument. All measurements were performed on Agilent microwave plasma model 4200 MP-AES. An auto sampler was used to deliver samples into instrumental at 3 replicates and cyclonic spray chamber (double pass cyclonic Agilent SPS 3) with mass flow controlled nebulizer gas flow as 0.65 L/min. The instrument was operated in a fast sequential mode at rinse time 30 sec with stabilization time 15 sec and featured to cooled CCD detection. Background and spectral interferences could be easily corrected and accurately using Agilent's MP Expert Software.
The limits of detection (LODs) of measured metals were calculated as double of the standard deviation of a series of measurements of a solution against the blank absorbance [20]. Working standards were used to ensure reliability of the results. A recovery experiment was carried out by spiked the blank with 50 and 100 ppm of multi-standards of desired metals and the procedures were done as described above.
Quality assurance/quality control (QA/QC)
Strict quality assurance of the analytical process was routinely observed for the instrumentation processes. All the glass and plastic wares were washed with nitric acid, afterward rinsed with deionized water. All reagents were of analytical grade and deionized water was used throughout the study. Five ranges of external standard solutions were prepared for calibration curve with good linearity (R2>0.99).
Risk estimation
The risk of contaminated fish, vegetables and fruits consumption was estimated based on guidelines of EPA [21-23], concentrations of HMs, data of surveyed questionnaire conducted on inhabitants of Ismailia and Tanta and some data of Integrated Risk Information System [24].
The chronic daily intake (CDI) (mg/kg/day) from food ingestion was estimated using the following formula:
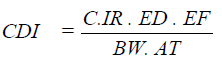
Where C is the concentration of metal expressed as mg/kg. IR is the ingestion rate (estimated under community survey). ED is the average period (estimated). EF is the exposure frequency (meal/year). BW is the body weight (estimated). AT is the averaging time (365 day/year) [25].
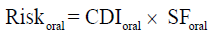
Estimation of cancer risk through ingestion route depend on the availability of cancer slope factors which are provided on USEPA web site [23,24]. In brief, cancer risk was estimated as follows:
On the other hand, non-carcinogenic risk was evaluated based on the reference doses (RfDs). Target hazard Quotient (THQ) of chemicals via ingestion route was calculated as follows:
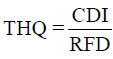
Where, RFD is the reference dose of specified substances [23,24]. Total THQ or hazard index (HI) is the sum of more than one hazard quotient for all metals.
Statistical analysis
Coefficient of variation percentage between obtained data was determined by Gomez et al. [26]. Exposure estimation data were tabulated according to differences in age between adult and children. All exposure estimations, risk and hazard calculations were performed according to probability 50th and 90th percentile of ingestion.
Results
The limits of heavy metals detection (LODs) and other working conditions are presented in Table 1. The selected instrument (ICP-OES) was calibrated on wavelengths; 213.86, 228.80, 324.75, 405.78 and 403.08 nm and adjusted for LODs as follows: 4.50, 2.10, 0.70, 3.30 and 0.2 ng/ml for Zn, Cd, Cu, Pb and Mn respectively.
| Element | Wavelength | LOD | LOQ |
|---|---|---|---|
| (nm) | (ng/ml) | (ng/ml) | |
| Zn | 213.86 | 4.5 | 15 |
| Cd | 228.8 | 2.1 | 7000 |
| Cu | 324.75 | 0.7 | 2000.33 |
| Pb | 405.78 | 3.3 | 11 |
| Mn | 403.08 | 0.2 | 667 |
Table 1: Operational conditions of ICP-OES for determination of HMs in different matrixes.
Heavy metals residue levels
Concentrations of HMs detected are presented in Table 2. The mean concentrations of Pb, Zn, Cd and Mn were 13.86, 26.02, 1.94, 33.34 and 15.29, 93.59, 1.52, 34.81 mg/kg for samples of Tanta and Ismailia regions, respectively. However, Cu ranged from 2.49 to 18.45 mg/kg in samples of Tanta and from BDL to 17.12 mg/kg in samples of Ismailia region. The mean concentrations of Cu, Pb, Zn, Cd and Mn were 4.98, 18.49, 0.34, 4.88, 20.49 and 2.10, 11.20, 0.19, 5.09, 30.39 mg/kg for samples of Tanta and Ismailia regions respectively.
| Element | Tanta | Ismailia | MRL (mg/kg) | ||
|---|---|---|---|---|---|
| range | mean ± SE | range | mean ± SE | ||
| Vegetables | |||||
| Cu | (2.49-18.45) | 9.52 ± 0.52 | (BDL-17.12) | 7.61 ± 0.15 | 10 |
| Pb | (BDL-37.01) | 13.86 ± 0.04 | (BDL-33.69) | 15.29 ± 0.36 | 2 |
| Zn | (BDL-67.55) | 26.02 ± 0.38 | (3.08-267.74) | 93.59 ± 0.18 | 5 |
| Cd | (BDL-4.45) | 1.94 ± 1.03 | (BDL-4.75) | 1.52 ± 0.37 | 0.1 |
| Mn | (20.07-44.20) | 33.34 ± 0.54 | (31.81-40.11) | 34.81 ± 0.62 | 2-9 |
| Fruits | |||||
| Cu | (BDL-8.69) | 4.89 ± 1.03 | (BDL-4.52) | 2.10 ± 2.04 | 10 |
| Pb | (2.82-34.21) | 18.49 ± 0.26 | (BDL-33.02) | 11.20 ± 1.78 | 2 |
| Zn | (BDL-0.59) | 0.34 ± 0.04 | (BDL-0.57) | 5.09 ± 0.57 | 5 |
| Cd | (3.84-6.87) | 4.88 ± 1.43 | (4.14-6.21) | 1.52 ± 0.37 | 0.1 |
| Mn | (18.67-21.92) | 20.49 ± 0.83 | (23.61-37.86) | 30.39 ± 1.39 | 2-9 |
| Tilapia fish | |||||
| Cu | (0.96-9.02) | 5.29 ± 0.01 | (2.14-11.72) | 4.59 ± 0.025 | 3 |
| Pb | (1.90-11.70) | 4.68 ± 0.05 | (5.88-14.63) | 6.34 ± 1.23 | 2 |
| Zn | (42.29-105.66) | 78.91 ± 0.001 | (24.42-100.52) | 61.41 ± 0.003 | 30 |
| Cd | (3.64-8.28) | 6.16 ± 0.33 | (4.65-5.86) | 5.20 ± 0.30 | 0.5 |
| Mn | (50.96-67.31) | 60.78 ± 0.38 | (45.03-66.30) | 59.14 ± 0.02 | 0.5 |
| Catfish | |||||
| Cu | (1.39-8.73) | 5.38 ± 0.013 | (BDL) | BDL | 3 |
| Pb | (0.95-1.54) | 0.62 ± 0.05 | (1.43-20.70) | 9.55 ± 0.018 | 2 |
| Zn | (40.67-110.63) | 85.96 ± 0.001 | (43.86-99.52) | 83.99 ± 0.002 | 30 |
| Cd | (3.43-9.90) | 6.41 ± 0.33 | (3.84-7.27) | 5.81 ± 0.48 | 0.5 |
| Mn | (51.44-90.00) | 55.02 ± 0.38 | (52.88-73.40) | 63.18 ± 0.25 | 0.5 |
Table 2: Heavy metals levels (mg/kg) measured in matrixes samples collected during 2015–2016.
Chronic daily intakes
The results of ΣCDIs of HMs associated with different matrix consumption in Tanta and Ismailia region are presented in Table 3. Regarding vegetable consumption, residents of Ismailia region had CDI values higher than those of Tanta residents, where ΣCDIs values of adults were 3.818 and 20.047 mg/kg/ day at 50th and 90th percentile of ingestion. The mean values for adults were 11.933 and 5.687 mg/kg/day in Ismailia and Tanta region, respectively. Similarly, children categories in Ismailia had higher values than those of Tanta region However, residents of Tanta had the highest value (1.849 mg/kg/day) for 15 years old group at 90th percentile and the least value (0.258 mg/kg/ day) was recorded for 6 years old group at 50th percentile. The percentages of absorbed doses of HMs are illustrated in Figure 1a. In Tanta region, picked up dose percentages for adult had the highest value (39.4%) for Mn, while the least value (2.3%) was recorded for Cd. In Ismailia region, Zn exhibited the highest picked up dose (61.3%) followed by Mn (22.8%), Pb (10.1%), Cu (4.9%) and Cd (0.9%) respectively. Regarding children categories, Mn exhibited the highest value (42.9%) followed by Zn (28.3%), Pb (15.1%), Cu (10.4%) and Cd (3.4%) respectively in Tanta region. In Ismailia region, Zn exhibited the highest value (61.0%) followed by Mn (22.7%), Pb (10.3%), Cu (5.0%) and Cd (1.0%) respectively.
| Age categories | Tanta | Ismailia | |||||
|---|---|---|---|---|---|---|---|
| vegetables | fruits | tilapia | catfish | vegetables | fruits | tilapia | |
| adult | |||||||
| 50th | 1.949 | 1.129 | 1.3 | 1.29 | 3.818 | 1.222 | 2.504 |
| 90th | 9.424 | 5.461 | 7.87 | 7.74 | 20.047 | 6.418 | 8.879 |
| mean | 5.687 | 3.295 | 4.585 | 4.515 | 11.933 | 3.82 | 5.692 |
| Children (year) | |||||||
| (6 year) 50th | 0.258 | 0.136 | 0.046 | 0.216 | 0.37 | 0.117 | 0.36 |
| 90th | 1.172 | 0.679 | 0.852 | 0.838 | 4.293 | 1.374 | 0.825 |
| (15 year) 50th | 0.995 | 0.237 | 0.362 | 0.355 | 0.888 | 0.353 | 0.8 |
| 90th | 1.849 | 1.231 | 1.51 | 1.484 | 4.65 | 1.479 | 1.895 |
| mean | 1.069 | 0.571 | 0.693 | 0.723 | 2.55 | 0.83 | 0.97 |
Table 3: Sum of chronic daily intake (ΣCDIs)(mg/kg/day) of HMs associated with different matrix consumption.

Figure 1a: The percentage of absorbed doses for HMs via vegetable consumption in Ismailia region (a) children, (b) adult, in Tanta region (c) children and (d) adult, respectively.
In case of fruits consumption, no significant differences were recorded between residents of the two cities for adult and children categories. The mean values were 3.295 and 3.820 mg/ kg/day for adults of Tanta and Ismailia region, respectively. Children categories had the highest value at 90th percentile 0.679 and 1.374 mg/kg/day for 6 years old group and 1.849 and 1.479 mg/kg/day for 15 years old group respectively. The percentages of taken doses of HMs via fruits consumption are illustrated in Figure 1b. Residents of Tanta region showed the highest value (42.0%) for Mn followed by Pb (37.7%), Cu (10.2%), Cd (10.0%) and Zn (0.5%) respectively. The percentages of picked up doses of HMs in Ismailia region were as follows: Mn?Pb?Cd?Cu?Zn with values 62.1, 22.8, 10.4, 4.3 and 0.4% respectively. Regarding children categories of Tanta, the order was as follows: Mn?Pb?Cu?Cd?Zn with values 42.0, 38.0, 10.2, 10.0 and 0.5%, respectively. However, in Ismailia region concentrations detected for Mn?Pb?Cd?Cu?Zn were as follows 61.0, 22.4, 10.2, 6.3 and 0.4% respectively.

Figure 1b: The percentage of absorbed doses for HMs via fruits consumption in Ismailia region (a) children, (b) adult, in Tanta region (c) children and (d) adult, respectively.
Regarding fish consumption, tilapia and catfish are considered the main species for residential consumption in Tanta region, but hardly consumed in Ismailia. ΣCDIs values of tilapia consumption in Ismailia were higher than those of Tanta region. The values were 2.504, 8.879 and 1.300 and 7.870 mg/kg/ day for adults at 50th and 90th percentile in Ismailia and Tanta region, respectively. Regarding children categories, the values were 0.360, 0.825, 0.800, 1.895 and 0.046, 0.852, 0.362, 1.510 mg/kg/day for Ismailia and Tanta age groups at 50th and 90th percentile, respectively. The percentages of picked up doses are illustrated in Figure 1c. In Tanta region, Zn in tilapia fish samples exhibited the highest value (50.6%) followed by Mn (39.04%), Cd (3.94%), Cu (3.38%) and Pb (3.05%) respectively for adults. Regarding Ismailia residents, HMs doses percentage were 44.93, 43.27, 4.64, 3.80 and 3.36% for Zn, Mn, Pb, Cd and Cu respectively while for children doses percentage were 50.71, 38.4, 4.33, 3.75, 3.25% and 44.95, 43.2, 4.02, 3.20, 4.64% for Zn, Mn, Cd, Cu and Pb in Tanta and Ismailia region respectively.

Figure 1c: The percentage of absorbed doses for HMs via tilapia fish consumption in Ismailia region (a) children, (b) adult, in Tanta region (c) children and (d) adult, respectively.
In case of catfish, HMs had ΣCDIs values of 1.290 and 7.740 mg/kg/day for adults of Tanta region at 50th and 90th percentile of ingestion. However, they had values of 0.216, 0.888, 0.355 and 1.484 mg/kg/day for children categories at 50th and 90th percentile. The percentages of picked up doses are illustrated in Figure 1d. The percentage values were in the following order: Zn?Mn?Cd?Cu?Pb for adults 56.04, 35.88, 4.10, 3.54 and 0.10% respectively. The order for children categories was 56.10, 35.90, 4.20, 3.50 and 0.30% respectively.

Figure 1d: The percentage of absorbed doses for HMs via catfish fish consumption in Tanta region (a) children and (b) adult, respectively.
Non-cancer risk
Target hazard quotient (THQ) values of HMs associated with vegetables consumption in Tanta and Ismailia are illustrated in Figure 2(a). In Tanta region, HI was estimated for Cu, Pb, Zn, Cd and Mn respectively at 50th and 90th percentile of ingestion. For adults, Cd had the highest values of 3898 and 18848 at 50th and 90th percentile, while Pb had the least values of 4.53 and 21.92 at the same rank of ingestion. Among children categories, HI ranged from 114.66 to 433.46 at 50th and from 522.87 to 946.25 at 90th percentile of ingestion. The positively detected HMs had the following HI values Cd?Mn?Cu?Zn?Pb respectively. In case of Ismailia region, Cd showed the highest values at 7636 and 40094 at 50th and 90th percentile, while Pb had the least values 8.88 and 46.62 at the same rank of ingestion. Among children, HI ranged from 164.18 to 395.95 at 50th and from 1914.13 to 2059.18 at 90th percentile of ingestion. The response of HI was as follows: Cd?Mn?Cu?Zn?Pb for both age groups.
THQ values of HMs associated with fruits consumption are illustrated in Figure 2(b). In Tanta region, Cd had the highest values of 2258 and 10922 at 50th and 90th, while Pb had the least values of 2.63 and 12.70 at the same rank of ingestion pathway. Regarding children categories, HI ranged from 60.07 to 105.33 at 50th and from 1325.49 to 548.57 at 90th percentile of ingestion pathway. HI values of measured HMs were in the following order Cd?Mn?Cu?Zn?Pb for both age groups. In Ismailia region, Cd showed the highest values of 2444 and 12836 at 50th and 90th while Pb recorded the least values 2.84 and 14.93. For children groups, HI ranged (52.4-156.86) and (112.92-639.44) at 50th and 90th percentile of ingestion pathway at the same minor.
THQ values of HMs associated with tilapia fish consumption are illustrated in Figure 2(c). As mentioned above, Cd had the highest values of 2600 and 15740 for adults residents of Tanta region. However, Pb recorded the least values 3.02 and 18.30 at 50th and 90th percentile of ingestion pathway. Among children categories, HI exhibited the ranges (20.30-32.13) and (75.85-134.51) at the same rank of exposure. HI was in the same minor as described above in cases of vegetables and fruits consumption. Regarding Ismailia residents, the highest values of HI for Cd were 1001.6 and 3552.0 and the least values for Pb were 1.16 and 4.13 at the same rank of exposure. HI exhibited the ranges (160.61-357.00) and (368.06-845.42). Moreover, HI for all HMs was in the same minor.
THQ values of HMs associated with catfish consumption are illustrated in Figure 2(d). Mean HI values of Cu, Pb, Zn, Cd and Mn were 112.88, 10.5, 15.05, 9030.0, 903.0 respectively, for adult at 50th and 90th. Regarding children categories, HI ranges were (18.85-31.66) and (74.73-287.54) at the same rank of exposure.

Figure 2: Estimated non cancer risk (THQ) of heavy metals associated with (a) vegetables, (b) fruits, (c) tilapia fish and (d) catfish consumption, respectively.
Discussion and Conclusion
Metals are considered the most common environmental pollutants. Their accumulation and distribution in soil and water increase to an alarming rate, causing deposition and sedimentation in water reservoirs and affecting aquatic organisms [27,28]. Rapid, unorganized urban and industrial developments have contributed to the elevated levels of HMs in the urban environment of developing countries such as Egypt [29], Iran [30], China [31] and India [32-35].On the other hand, plants contain the amount of Cu, which is inadequate for normal growth of plants. However, application of micronutrient fertilizers and copper-based fungicides may sometimes increase it to the alarming levels [29].
The information presented by Dogheim et al. [36] are in agreement with this study, where Cd slightly exceeded MPL. Many investigators are in agreement with our findings, Soliman et al. [36-39] who reported occurrence of Pb in different kinds of vegetables at similar concentration levels.
Hassan et al. [40] determined some trace metals in commercial fruit juices in Egypt. They reported moderate Cu values. However, Zn concentrations in all samples were lower than MPL, besides Cd and Pb were below MPL. Comparing with our findings, Zn and Cu also were lower than MPL. Abou-Arab et al. [41] reported that the highest levels of Pb were detected in the samples collected from industrial and areas of heavy traffic. While the least Pb value was recorded in the rural areas. Consequently, we can explain, why there are high levels of Pb in some fruit and vegetable samples in the present study. From this point, the levels of Pb in the atmosphere of Egyptian industrial and urban areas were higher than the levels in in rural areas and in some other countries [42,43].
Although, vegetable and fruit samples of Tanta region have slightly lower Mn contents than Ismailia region, levels of Mn in both regions exceeded MPLs. The reasonable explanation is mainly attributed to the heavy traffic in both Tanta and Ismailia, in addition to the presence of some industrial facilities in the country side of close proximity to areas grown with vegetables and fruits.
The selection of fish species is a critical issue in bio-monitoring studies. Nile Tilapia avoid long-term exposure to metal pollution at a particular site by activity swimming, while African catfish have a more stationary behavior and thus may be exposed to metal pollution for a long time [44]. However, the difference in sensitivity of Nile Tilapia and African catfish to metal bioaccumulation might be attributed to their feeding peculiarities' [45]. Mohamed et al. [46] reported the concentrations of Pb, Cd and Cu in the edible parts of fish samples in the following order Pb> Cd> Cu respectively. This finding is exactly in agreement with the current study regard fish samples from Ismailia region. Monitoring of HMs by Ibrahim et al. [47] showed that Zn and Cu concentrations were the highest in muscles of African catfish in the same minor for Zn levels. This is in agreement with the findings of Shakweer et al. [48], who concluded that the concentration of trace metals in various organs of fish reflects the degree of water pollution in the aquatic environments.
Non-cancer risk
In the present study, HI values resulting from vegetables, fruits and fish ingestion exceeded the threshold value (HI=1) indicating signs of possible toxicity for both age categories. Abdel-Halim et al. and Omer et al. [49-51] showed that HI values of HMs resulting from fish ingestion were greater than unity suggesting some undesirable health effects associated with high fish consumption. Abdel-Khalek et al. [52] showed that the calculated HI indicated that each metal had low HI, but the cumulative impacts of all metals represented possible threat for consumers of higher consumption rate of fish.
The toxicity of non-essential metals occur through the displacement of essential metals from their native binding sites, or through ligand interactions in the conformational structure of nucleic acid and proteins or the interference with oxidative phosphorylation and osmotic balance [53]. Higher levels of both essential and non-essential metals can damage cell membranes, alter enzyme specificity, disrupt cellular functions, bind with greater affinity to thiol-containing groups and oxygen sites than the essential metals do, and damage the structure of DNA [54]. Previous studies have shown that certain metals can cause either increasing or decreasing levels of serum protein, glucose and cholesterol, as well as changes in serum enzymes activities [55]. In toxicological studies acute exposure changes in activities of some enzymes may reflect cell damage in specific organs [56]. HMs are among the major contaminants of food supply and may considered the most important problem to environment [57]. The problem is specially developing countries because of lack of awareness [58-61].
The present study has indicated the need to monitor contamination with heavy metals in food on regular basis and at larger scale. In addition, the study emphasize the importance of raising awareness about heavy metals contamination as one important issue that include the need for through washing of fresh food before consumption in order to avoid risks posed by heavy metals contamination [62-64]. Equally important is to devise a mechanism to monitor residues of heavy metals in various matrices, with special reference to food at larger scale that would allow a more comprehensive view [65-67].
References
- Tawfic MT. Persistent organic pollutant in Egypt- AN OVERVIEW. Soil and Water Pollution Monitoring 2006;pp:3-38.
- Li Z, Jennings A. Worldwide regulations of standard values of pesticides for human health risk control: A review. Int J Environ Res Public Health 2017;14:826.
- Randhawa MA, Rehman SW, Anjum FM, et al. Pesticide Residues in Food: Health Implications for Children and Women. Practical Food Safety: Contemporary Issues and Future Directions, 1st ed. John Wiley & Sons Ltd 2014.
- Chen P, Miah MR, Aschner M. Metals and neurodegeneration 2016;5:366.
- Gunderson EL. FDA total diet study: Dietary Intakes of pesticides, selected elements, and other chemicals. J Assoc off Anal Chem 1988;71:1200.
- Gartrell MJ, Crann JC, Podrebarac OS, et al. Pesticides, selected elements, and other chemicals in adult total diet samples. J Assoc Off Anal Chem 1986;69:146.
- FDA (Food and Drug Administration): Food and Drug Administration Pesticide Program, residues in foods. J Assoc off Anal Chem 1989;73:127A.
- Jarup L. Hazards of heavy metals contamination. Br Med Bull 2003;68:167-82.
- Sathawara NG, Parikh DJ, Agarwal YK. Essential heavy metals in environmental samples from western India. Bull Environ Contam Toxicol 2004;73:756-61.
- Trichopoulos D. In: DeVita VT (editor) Cancer: principles and practice of oncology, Lippincott Company. Epidemiology of cancer 1997; pp:231-57.
- Turkdogan MK, Kilicel F, Kara K, et al. Heavy metals in soil, vegetables and fruits in the endemic upper gastrointestinal cancer region of Turkey. Environ Toxicol Pharmacol 2002;13:175-9.
- Waalkes MP, Rehm S. Cadmium and prostate cancer. J Toxicol Environ Health 1994;43:251-69.
- Fries GF. A review of the siguificance of animal food products as potential pathways of human exposure to dioxins. J Anim Sci 1995;73:1639-50.
- D ’Mello JPF. Food safety: contaminants and toxins. CABI Publishing, Wallingford/ Cambridge 2003.
- Itanna F. Metals in leafy vegetables grown in Addis Ababa and toxicological implications. Ethiopian. J Health Dev 2002;6:295-302.
- Dorea JG. Persistent, bioaccumulative and toxic substances in fish: Human health consideration. Science of the Total Environment 2008;400:93-114.
- Ahmad AK, Shuhaimi-Othman M. Heavy metal concentrations in sediments and fishes from Lake Chini, Pahang, Malaysia. Journal of Biological Science 2010;10:93-100.
- Salvo F, Ziino M, Signorino D, et al. Chemical composition on bluef in turna (Thunnus thunnus L) from the strait of Messina waters. Lariv Disci Dell Aliment 1998;pp:1-27.
- Akhar Jan F, Ishaq M, Khan S, et al. A comparative study of human health risks via consumption of food crops grown in waste water irrigated soil (Peshawar) and relatively clean water irrigated soil (lower Dir). J hazardous materials 2010; pp:612-21.
- ISO/IEC. EN5001, Guide 25, general requirements calibration and testing laboratories, Geneva, 1990.
- USEPA. Development of statistical distributions or ranges of standards factors used in exposure assessments. Office of health and environment assessment 1985.
- USEPA. Guidelines for carcinogen risk assessment. Risk assessment forum, U.S. environmental protection agency, Washington DC 1999.
- USEPA. Integrated risk information system (electronic data base). US environmental protection agency, Washington DC 2002.
- IRIS. Ingestion risk information system, US environmental protection agency, Cincinnati, OH 2005.
- USEPA. Air superfund national technical guidance services, Proposed for dispersion modeling and air monitoring for superfund air pathway analysis. Interim. Final. Office of air quality planning and standards. Research Triangle Park 1989;4.
- Gomez KA, Gomez AA. Statistical procedures for agriculture research 2nd ed John Willy and Sans. New york, USA 1984.
- Mohiuddin KM, et al. Geochemical distribution of trace metal pollutants in water and sediments of downstream of an urban river. International Journal of Environmental Science & Technology 2010;7: 17-28.
- Mohiuddin KM, et al. Heavy metals contamination in water and sediments of an urban river in a developing country. International Journal of Environmental Science & Technology 2011;8:723-36.
- Radwan MA, Salama AK. Market basket survey for some heavy metals in Egyptian fruits and vegetables. Food Chem Toxicol 2006;44:1273-8.
- Maleki A, Zarasvand MA. Heavy metals in selected edible vegetables and estimation of their daily intake in Sanandaj, Iran. The Southeast Asian Journal of Tropical Medicine and Public Health 2008;39:335-40.
- Wong CSC, Zhang Li XD, Peng G, et al. Atmospheric depositions of heavy metals in the Pearl River Delta, China. Atmospheric Environment 2003;37:767-76.
- Marshall. Enhancing food chain integrity: quality assurance mechanism for air pollution impacts on fruits and vegetables systems. Crop Post Harvest Program, Final Technical Report 2004.
- Sharma RK, Agrawal M, Marshall FM. Atmospheric depositions of heavy metals (Cd, Pb, Zn, and Cu) in Varanasi city, India. Environmental Monitoring and Assessment 2008;142:269-78.
- Sharma RK, Agrawal M, Marshall FM. Heavy metals (Cu, Cd, Zn and Pb) contamination of vegetables in Urban India: a case Study in Varanasi. Environmental Pollution 2008;154:254-63.
- Emam AMK. Microbiological Study of the River Nile in Egypt, in Botany & Microbiology Department. Al-Azhar University 2011.
- Dogheim SM, EL-Marsafy AM, Gad Alla SA, et al. Pesticides and heavy metals level in Egyptian leafy vegetables and some aromatic medicinal plants. Food Additives Contaminant 2004;21:323-30.
- Soliman KH, Abou-Arab AAK, Badawy A, et al. Heavy metal contamination levels in Egyptian vegetables, fruits and elimination by washing procedure. Bull Nutr Instit Cairo Egypt 1997;17:120-46.
- Salim A. Evaluation of heavy metal contents and organochlorine pesticides (OCPs) residues in Egyptian organically-farmed vegetables. J Agric Sci Mansoura Univ 2006;31:1601-12.
- Mansour SA, Belal MH, Abou-Arab AK, et al. Evaluation of some pollutant levels in conventionally and organically farmed potato tubers and their risks to human health. Food Chem Toxicol 2009;47:615-24.
- Hassan AS, Abd El-Rahman TA, Marzouk AS. Estimation of some Trace metals in commercial fruit Juices in Egypt. International Journal of food science and nutrition Engineering 2014;4:66-72.
- Abou-Arab AAK, Abou Donia MA, Mohamed SR, et al. Risk assessment of lead in Egyptian vegetables and fruits from different environments. International Journal of biological, bimolecular, agricultural, food and biotechnological Engineering 2015;9:335-41.
- Soliman, Borai. Seasonal variation of some heavy metals in total suspended particulate matter in Great Cairo atmosphere, The 2nd International Conference of Environmental Science and Technology, Egypt 2001.
- Shakour AA, El-Taieb NM, Hassan SK. Seasonal variation of some heavy metals in total suspended particulate matter in Great Cairo atmosphere. The 2nd International Conference of Environmental Science and Technology, Egypt 2006.
- Abouel Fadl KY, Aly W, Abd El-Reheem A, et al. Heavy metals levels in the blood of Oreochromis niloticus and Clarias gariepinus as Biomarkers of metal pollution in the River Nile. International Journal of Ecotoxicology and Ecobiology 2016;1:1-12.
- Osman A, et al. In situ evaluation of the genotoxic potential of the river Nile: I.Micronucleus and nuclear lesion tests of erythrocytes of Oreochromis niloticus and Clarias gariepinus. Toxicological & Environmental Chemistry 2011;93:1002-17.
- Mohamed MA, Morsy FA. Persistent organochlorine pollutants and metals residues in sediment and freshwater fish species cultured in a shallow lagoon, Egypt. Journal environmental technology 2011;34:2389-99.
- Ibrahim A, Th A, Omar HM. Seasonal variation of heavy metals accumulation in muscles of the African catfish Claris gariepinus and in River Nile water and sediments at Assiut Governorate, Egypt. Journal of biology and earth sciences 2013;3:B236-48.
- Shakweer LM. Concentration levels of some trace metals in Oreochromis niloticus at highly and less polluted areas of Mariut Lake. J Egypt Ger Soc Zool 1998;25:125-44.
- Abdel-Halim KY. Health risk assessment of heavy metals associated with fish consumption inEDKU region,Egypt. J Pest Cont & Environ Sci 2008;16:1-16.
- Abdel-Halim KY, Samia A, Abo-Seda, et al. Risk Assessment of Organochlorine Insecticides and Poly Chlorinated Biphenyl (PCBs) Associated with Fish Consumption by Fishermen's Families in EDKU Region, Egypt. J Agric Res 2009;87:331-46.
- Omar WA, Zaghloul KH, Abdel-Khalek AA, et al. Risk Assessment and Toxic Effects of Metal Pollution in Two Cultured and Wild Fish Species from Highly Degraded Aquatic Habitats, Arch Environ Contam Toxicol 2013;65:753-64.
- Abdel-Khalek AA, E-Elhaddad, Mamdouh S, et al. Assessment of metal pollution around Sabal Drainage in River Nile and its impacts on bioaccumulation level, metals correlation and human risk hazard using Oreochromis niloticus as bioindicator. Journal of fisheries and aquatic sciences 2016;16:227-39.
- Bruins MSK, Oehme F. Microbial resistance to metals in the environment. Ecotoxicology Environ Saf 2000;45:198-207.
- Hussein H, et al. Tolerance and uptake of heavy metals by Pseudomonads. Process Biochemistry 2005;40:955-61.
- Monteiro SM, et al. Copper induced alterations of biochemical parameters in the gill and plasma of Oreochoromis niloticus. Comp Biochem Physiol C Pharmacol 2005;141:375-83.
- Heath A. Water pollution and fish physiology. CRC Press, Boca Raton. Fla: Lewis Publs 1996.
- Zaidi MI, Asrar A, Mansoor A, et al. The heavy metal concentrations along roadside trees of Quetta and its effects on public health. J Appl Sci 2005;5:708-11.
- Beri PR, Receveur O, Chan HM, Kuhnlein HV. Dietary exposure to chemical contaminants from traditional food among adult Dene/Metis in the western Northwest Territories, Canada. Environ Res 1998;76:131-42.
- Binelli A, Provini A. POPs in edible clams from different Italian and European markets and possible human health risk. Marine Poll Bull 2003;46:879-86.
- Chourasiya S, Khillare PS, Jyethi DS. Health risk assessment of organochlorine pesticide exposure through dietary intake of vegetables grown in the periurban sites of Delhi, India. Environ Sci Pollut Res 2016;22:5793-806.
- Doughtery CP, Holtz SH, Reinert JC, et al. Dietary exposure to food contaminants across the United States. Environ Res 2000;84:170.
- Gad Alla SA, Thabet WM, Saloma EY. Monitoring and risk assessment of pesticide residues in some Egyptian vegetables. Middle East Journal of Applied Sciences 2013;3:216-30.
- So MK, Zhang X, Giesy JP, et al. Organochlorine and dioxin-like compounds in green-lipped mussels' perna virdis from Hong Kong mariculture zones. Marine Poll.Bull 2005;51:677-87.
- Tchounwou BP, Ashour BA, Ragheb DA, et al. Health Risk Assessment of Pesticide Usage in Menia El-Kamh Province of Sharkia Governorate in Egypt. International Journal of Molecular Sciences 2002;3:1082-94.
- Tricker AR, Preussmann R. Chemical food contaminants in the initiation of cancer. Proc Nutr Soc 1990;49:133-44.
- Wang NL, Yi L, Shi D, et al. Pollution level and human health risk assessment of some pesticides and polychlorinated biphenyls in Nantong of Southeast China. J Environ Sci 2012;24:1854-60.
- Zhou P, Zhao Y, Li J, et al. Dietary exposure to persistent organochlorine pesticides in 2007 Chinese total diet study. Environ Int 2012;42:152-9.