Research Article - Environmental Risk Assessment and Remediation (2018) Volume 2, Issue 4
Management of flood risk in the center of Ghardaia city with a geographic information system (SIG) after the flashflood of 1st October 2008.
Boulaghmen F*, Benouar D, Kalbaza M
Department of Civil Engineering, University of Amar Telidji Laghouat, Algeria
- *Corresponding Author:
- Farida Boulaghmen
Department of Civil Engineering
University of Amar Telidji Laghouat, Algeria
E-mail: f.boulaghmen@mail.lagh-univ.dz
Accepted date: October 16, 2018
Citation: Boulaghmen F, Benouar D, Kalbaza M. Management of flood risk in the center of Ghardaia city with a geographic information system (SIG) after the flashflood of 1st October 2008. Environ Risk Assess Remediat. 2018;2(4):14-20.
Abstract
Algeria knows a periodical risk of floods and flash floods phenomena over much of its territory. This results in a stress on the daily activities of citizens and it will be an obstacle for the economic and social development of the country. In most cases uncontrolled urbanization conducts to be the failure of a flowing evacuation and efficiency of the storm water networks. The study presented has object, the operation of the map data of flood zone in the center of Ghardaia city after the flash flood of the first October 2008. This study consists of three distinct parts, first the development of flood phenomena and how did citizens handle the case of flood risk in Algeria. With detailed study of morphometric and hydrography of the M'Zab valley, i.e. the second part, the HEC-RAS software is selected and presented as numerical calculation tools for hydraulic modeling. The basic data (hydraulic and thematic) are identified as areas threatened by potential floods in the city center of Ghardaia, particularly vulnerable area in case of high flood. The third part is devoted to the identification and mapping of flood risk in an urban environment by hydraulic modeling approach. Thus developing this very ambitious and relevant part of help tools for managing decisions. Finally, our results have included a descriptive map of the spread of the flooded area in order to improve local responsesKeywords
Flood, ghardaia, management, SIG
Introduction
Course of the last thirty years, Algeria encountered huge economic and social losses. These can be summarized in a series of violent natural phenomena that hit different regions. The last flood of Ghardaia city, on October 1st, 2008, flash floods has caused substantial economic losses. There were estimated to 250 million of euros while the flooding event of October 8th, 2001 in the other side, at El-Bayadh, caused 1, 2 millions of euros of economic losses [1]. Floods and mudflows have a higher possibility of occurrence compared to other types of natural disasters [2]. They cover a wider physical and social space; they have a stronger implication on the economy and a very long readaptation in normal social activities. Factors determining vulnerability to these particular types of natural disasters are complex and dynamic [3]. Precised those provinces experiencing rapid growth of demography and a great socio economic change like what happened in Ghardaia city. The city of Ghardaia is confronted with occupation phenomena of Wadis beds which are manifested by catastrophic situations. During huge floods which constitute a major constraint to economic and social development. These floods are due to a complex interaction of several components. It is the product of the concomitant factors geomorphological, lithological, topographical, hydrographical and climatic without forgetting the human factor which is one of the main causes [4].
A General Overview of Ghardaia
Geographic presentation
The M’Zab valley is situated in the centre of the North Algerian Sahara [5]; exactly at 632 Km South of the capital of Algeria named Algers. This landform which dates from the upper cretaceous is made of a vast brown stony and blackish. A tableland, whose altitude varies between 300 and 800 meters, covers an area of 2000 km2 which is subject to an arid climate (Figure 1).

Figure 1: Geographical representation of Ghadaia.
Through the past, it was considered as one of the most rewarding oasis in Algeria [6]. Ghardaïa city covers 300 km2 and situated at 526 m high. It is irrigated by the extension of the tableland plain which is carved by the waters named the Chebka (desertic network) [7].
Population growth
Nowadays 3,63,598 inhabitants are living in the M’Zab valley among which 237 805 live in Ghardaia city [7]. The density of the population of the city is 850 inhabitants/Km2. The valley has witnessed a fast running urbanization since 1970 due to the string demographic growth (Figure 2). The next forty years the need for additional housing will be equal to 122% of the existing houses built in the millenary [5].

Figure 2: Ghadaias population development [8].
Geological and climatic aspect
From a geological perspective, the M'Zab Valley includes three types of natural regions which are:
• The plains of Hamadian slabs, limestone's cuirasse, with an angular gravel surface
• Regions buried in the sand, part of the great Western Erg with dune particularly dense and high; this area is exclusively dedicated to the Saharan pastoralism
• The Chebka central dorsal dominated by limestone cornices continuous North-South direction
The concept of the Chebka corresponds to the result of multitransgressions and marine regressions. The marine periods have generated a soil of sediments, while sandstone was generated by continentals. During this period, the valley and its surroundings have constituted and stored the underground water. This aquifer water constitutes a part of the most important and the most famous intercalary Continental in Africa [5]. The valley network is conformed to the general topography which is ordered around North-West South-East axes. This valley is mined during the active period of hydrographical network [9]. The structure of the soil in this area is an alternation between a hard and ramified zone. It is composed of stiff valleys made of limestone arranged on flat funds. This allowed the development of a much ramified hydrographical network, constituting a maze of very close valleys (Dayates) which correspond to the characteristic of the Chebka [8].
Originally, “Wadi M’Zab begins at an altitude of 750 upstream of Ait-Belkacem (Figure 3). The minimum altitude is at 490 m; Ghardaia city is at 526 m. The watershed area is about 1575 Km2, it ends at El-Atteuf. The length of the trough is at 75 Km [5]. The upstream part of the watershed is drained by both rivers and El-Abiod, whose length is 50 to 60 Km far from Ghardaia city [10]. Their confluence gives birth to Wadi M’Zab at 7km north-west of Ghardaia city; Wadi M’Zab receives successively the contribution of watercourses which are at the right shore: Argdeine and Touzzouz, the Chaabet Ben-Lahtem and Benghanem. At the left shore, we have N’Tissa and Chaabet Inireze, followed by Azouil and Ait-M’zai [11]. The inhabited area along the river also affects the appearance of a strip which is oriented Nord-West and South-East [12]. It is crossed in the center by the national highway N°1; the river at the bridge of Bounoura and continues through the direction of South-Est. At about 20 kilometers south, a branch line on the National road (RN1) (Figure 4).

Figure 3: Overview of wadi MZAB in the chebka.

Figure 4: Geographic distribution of MZAB valley.
Hydrological Study
Temperatures
The Saharan climate is characterized by a typical variation between temperature rates of both day and night, or summer and winter. General average is by minima and maxima: 4°C and 21, 4°C, 28, 6°C and 50°C [13]. The warm period begins in May and lasts until September (Table 1).
| °C | Months | |||||
|---|---|---|---|---|---|---|
| April | May | June | July | August | September | |
| Tmax | 28,58 | 33,16 | 38,37 | 42,07 | 41,09 | 35,85 |
| Tmin | 14,88 | 18,66 | 24,34 | 27,29 | 27,49 | 22,65 |
| Tavg | 21,66 | 26,05 | 31,75 | 34,97 | 34,34 | 29,53 |
[O.N.M OF GHARDAIA, 2013]
Table 1. Averages temperature’s (°C) of ghardaia city (2003-2012).
Tmin monthly minimal’s average temperature in ºC
Tmax monthly maximal’s average temperature in ºC
Tmoye monthly average temperature in ºC
In Ghardaia city, the water of the terminal complex merges with the superficial aquifer [14]. This groundwater of Wadi M’Zab is operated by traditional wells which rarely exceed 50 meters. Their refilling is ensured through the infiltration of rainfall [15]. This is enhanced by genius devices such as the local dams that retain water during floods or those man-made ditches or restricted walls that delay the flow of water from rivers as “Wadi M’Zab”. In the past, people used a specific system of irrigation known by the Foggaras [16].
Pluviometry
The expectations are weak and irregular from 3 to 64 mm/ years; the pluviometric average is 50 mm/year [11]. It falls effectively in autumn and spring. There are many watercourses in the Chebka with a variable flow, frequently dry. These characteristics of Saharan climate cause in average an overflow every two years [8].
The rainfalls of Ghardaia are very low (Table 2). According to statistical data, on a 10-year observation period, we have a cumulative rainfall of 80.85 mm as annual average.
| P mm | Months | |||||
|---|---|---|---|---|---|---|
| J | F | M | A | M | J | |
| 2004-2013 | 11,76 | 01,79 | 03,55 | 08,75 | 01,89 | 03,23 |
| Jl | A | S | O | N | D | |
| 03,20 | 04,56 | 22,46 | 09,71 | 05,84 | 04,11 | |
[O.N.M of Ghardia 2013]
Table 2. Monthly temperatures (°C) ghardaia valley (2003-2012).
Ambrothermic diagram
The Ambrothermic diagram allows to highlight the climate characteristic, it is shown in the graph which are worn, the abscissa months and ordered the precipitation (P) and temperature (T), according to the formula P=2T [17] (Figure 5).

Figure 5: The ambrothermic diagramm of ghardaia city (2003-2012).
The dry season is between the intersections of both P and T. The curves are shown in Figure 4. The Ombrothermic diagram in the region of Ghardaia [18].
Morphometric and Hydrographic Characteristic of the Watershed of Wadi M’ZAB
The various parameters of a watershed (shape, altitude, slope, relief etc.) most often occur in combination, acting on terms of flow [19]. They offer the possibility of quantitative analysis and a comparison of the different hydrological units. Nevertheless, they must be handled with care.
Morphometry
The accuracy of the perimeter "P" of the watershed depends on the scale of the map of the density of hydrographic network better it is marked over the boundary; it is clearer for calculation and the various parameters will be more or less accurate [13]. The case of our watershed, it covers an area of 1573 square kilometers with a perimeter of 181 Km.
Shape parameters
The GRAVELIUS capacity coefficient (Kc): This coefficient can differentiate between the elongated and picked watershed.
We use the formula:
For our case we have an elongated watershed
Kc= 1,28 > 1
It is concluded that the watershed area is extended.
The equivalent rectangle
It is considered a rectangle form having the same area and the same perimeter as the length considered of the watershed L and l the width l. Ig The outlet is represented by a rectangle and overall widths of the contour lines are parallel [20].
L= 67 Km
l = 13.5 Km
We considered the watershed as a rectangle, having the same area and perimeter with length L and width l. The outfall is represented by on of the overall widths of the rectangle and the curves of level lines are considered as parallel.
The hypsometric curve of the watershed
Most hydrologic and climate phenomena are directly related to altitude. It is therefore important to know the distribution of altitudes in the watershed [21]. This is done using the representation of the hypsometric curve of the watershed of Wadi M'Zab (Figure 6).

Figure 6: The hypsometric curve of the watershed of wadi M’ZAB.
The shape of this curve implicitly gives some ideas on the slopes of the basin and their distributions in altitude and can appreciate the erosive potential of the watershed. The hypsometric curve is determined by footage plan surfaces between contour lines.
Altitude
Average altitude (Havg) is calculated from the hypsometric curve, it is defined as the average ordinate of the curve given by the following equation:
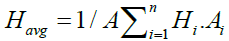
Havg = 649,77 m
Hmax = 779 m
Hmin = 445 m
Hmedian = H50%= 648 m
Hmedian corresponds to 50% of the total watershed area drawn from the hypsometric curve.
The slope index
In this part, the slope index allows us to determine runoff classes of superficial water. Our calculations have brought us to the following results (Table 3).
| Skm2 | 5 | 10 | 25 | 50 | 100 | 250 | 500 | 1000 | 1500 | 1700 | 2000 |
|---|---|---|---|---|---|---|---|---|---|---|---|
| Kc | 0.5 | 0.66 | 1 | 1.33 | 2 | 2.85 | 4 | 5.45 | 6.56 | 6.94 | 7.48 |
Table 3. Coefficient of correction kc of ig according to the area.
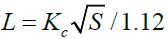
a. Overall slope index: The overall slope index is determinate by the following formulation
Ig=D/L
• D: height difference between altitudes with 5% and 95% of the watershed area drawn from the hypsometric curve, expressed in (m)
• L: the length of the equivalent rectangle (m)
D = H5%- H95% =735-545=190 m
Ig=2.84 m/km to reflect strong transversal slopes, upstream of 30 m/km to downstream Ig, a slope index corrected (Ig) is used
Igc=(I transversal+Ig)/2
In mountain areas at low longitudinal slope and at strong transversal slope; only the transversal slope is considered. The Ig index decreases as the area surface increases [11] proposes a correction Kc Ig according to the surface area S
Ig =19,3 m/km
The results are represented in the diagram bello
According to the Figure 7, we have the following:

Figure 7: The variation curve of the correction coefficient kc.
Kc=0,233 × S0,455
For the wareshed of the Wadi M’Zab for an area of S=1573 km2, Kc=6.8
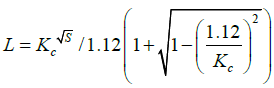
b. The ROCHE slope index: We have chosen to use the M.ROCHE formula in order to determine the average slope with the actual data of the watershed. This allows us to deduce Ip average of the square root of the measured slopes hard the equivalent rectangle and weighted by the surfaces between two contour lines Hi and Hi-1 [19].
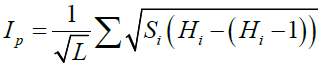
Si: partial surface (%) between two consecutive level curves Hi, Hi-1 (m).
L: the length of the equivalent rectangle (m).
a) The average slope:The average slope is calculated with the following formula:
Imoy=D/L
D: Height difference between Hmax and Hmin
D=334 m
L: The length of the equivalent rectangle
Imoy=0.4985 %=4.985 m/km.
Hydraulic Modelization of the Center of Ghardaia City
Presentation of the study area
Hydraulic modeling of the study area and the database (hydraulic and thematic) are identified according to areas threatened by flooding in the city of Ghardaia, especially in the center of the city [10]. We have a vulnerable part of the town of Ghardaia, the one that corresponds to a altitude difference which is at the center of the city. It is characterized by the presence of all social equipment directions; also, a large mass of the population are living over there.
Presentation of the numeric Model HEC-RAS
HEC-RAS is integrated software for hydraulic analysis to simulate a free surface flows [22]. It has a graphical interface to edit, modify and display input data and observing the results. The Ras-Mapper interface allows you to view the flood zones from field data extension ".flt".
Using the model (DTM TIN created in the Arc map) that is extracted topographic data needed to run the HEC-RAS software [23]. The process can take place through the HEC-Geo RAS (extension in Arc map) that automates the exportation/importation phases between the Arc Map and HEC-RAS (Figure 8).

Figure 8: Representation of the interface of HEC-RAS.
Once the MNT TIN is created (Figure 9) find that the similarity is remarkable, it can easily form the geometry for the HEC-RAS [22]. This will be done through the HEC-GeoRAS interface is an extension of GIS ArcMap designed specifically to address the geospatial data for use with the HEC-RAS system [15]. Since the HEC-GeoRAS requires a DTM represented by uneven terrain triangulated (TIN), Arc-Map, the extension of the 3D Analyst and Spatial Analysis are imposed for using HEC-GeoRAS [24].

Figure 9: Flowchart of procedure for creating of MNT-TIN.
The case study simulations allowed us a better view to the safety precautions to better manage and protect this area against flood overflows [25]. The simulation result by HEC-RAS has served us as a database for the development of the mapping that we will adopt in the following study.
Note: That the overflow moves left only in the rate proposed in this simulated situation because of leveling which plays an important role overlooked the slope.
In the Figure 10 We find that the similarity is remarkable with what was found with comparison with the digital of spread of water made by the Civil Protection Department in that time; as a report of inventory of fixtures [26].

Figure 10: Map of flooded areas around the towns of Ghardaia source: [civil protection of Ghardaia city].
The choice of using the HEC-RAS software is the use of a model of the permanent and non-permanent free surface flow in overflow channel to the active floodplain [27]. The use of the HEC-RAS program allowed us to perfectly illustrate the maximum flow rate of overflow of Wadi M'Zab in the center of Ghardaia city.
The case study simulations allowed us a better view to the safety precautions to better manage and protect this area against flood overflows [25]. The simulation result by HEC-RAS has served us as a database for the development of the mapping that we will adopt in the following study.
Mapping and Management of Flood Area Risk in Ghardaia city
Developing a map of flood areas would be a valuable tool for planners in defining areas used, the construction of protective structures and improving forecasting systems and alerts at floods [28]. For the development, establishment and use of maps, plans and other forms of digital expression, the main objective in this part is to present the tools and techniques that can be used to map flood risks in an urban environment by hydraulic modeling approach [29].
Identification of areas threatened
Areas threatened the most vulnerable of public services at the risk of flooding especially that it is considered as key institutions in case of disaster. It is stated that with the help of a representative numerical map of the city of Ghardaia we spotted the following sites (Table 4)..
• Youth House
• Bank
• Police station
• Primary school and High school
• Bus Station
• Hospital center
• Emergency establishment of civil protection
• Others state administrations
| Establishment | Coast of Establishment (m) | Coast of valley (m) | Difference (m) |
|---|---|---|---|
| Police station | 499.98 | 489.25 | 10.73 |
| Civil Portection | 499.96 | 489.25 | 10.71 |
| Hospital center | 502.02 | 489.41 | 13.61 |
| Bus Station | 493 | 489.01 | 4 |
| Primary school | 498 | 489.48 | 8.52 |
| High School | 502.55 | 489.48 | 13.07 |
| Bank | 504.2 | 488.98 | 15.22 |
| Youth House | 503.9 | 489.25 | 14.65 |
Table 4. Coast of different establishments in the Center of Ghardaia city.
Cartography of the hazards floods
When the simulation is performed, we can through the HECGeoRas (preRas), export the simulation results to the Arc-Map to delineate floodplains [30].
The following Figure 11 shows the final delimitation of the flood zone after exportation of simulation folder with a flow of 1255 m3/s. The water level has reached until 9.63 m high. It should also be noted that the selected institutions have a transversal assessment. For this, we have established a classification slip through a quiz presented to heads of institutions [31]. Their weights were allocated according to their importance rankings corresponding to amount occupants and operating strategies established by them.

Figure 11: Flood hazard map of Ghardaia center characterized by water height with a debit of 1255 m3/s.
Study of flood hazard map of the Gardaia center characterized by water height with a debit of 1255 m3/s
We note that each of the institutions; the Bus station, high school, Emergency establishment of civil protection and Police station are positioned in the critical situation at the flood hazard. Flood height is obtained for each establishment as follows:
• Youth House: H=0 m;
• Bank:
H=1.35 m;
• Police station: H=4.05 m;
• High school: H=0.96 m;
• Primary school: H=0
• Bus station: H=7.89 m;
• Hospital center: H=0 m;
• Establishment of civil protection: H=6.23 m;
• Others state Administration: 0.65<H <2.67 m.
Conclusion
For a long time, people have invested in flood risk due to favorable geographical conditions. The inhabitants of the town of Ghardaia are in duty to protect their valuable assets against flooding and to consider a policy of mitigation of floods in this part of southern Algeria. The M'Zab region, by its geographical location, is confronted to the phenomena of occupation of beds of Wadis. Floods are due to the complex interaction of several components. The traditional methods of approaches of floods risk data management (history, hydro-geomorphology) became increasingly adapted to the pace of indicator changes (soil occupation, pluviometry etc.).
To address this deficiency, the use of IT tools revealed an ambitious solution that can provide such data in modeling and mapping of the hazards. The choice of using the HEC-RAS software is the use of a modeling of the permanent state flow and non-permanent of the maximum debit of overflow of the M'Zab Wadi in the center of Ghardaia city. The program has help us in the study of case simulations and allowed us a better view to the safety precautions to be taken to better manage and protect the area against flood's overflow. The simulation result by HEC-RAS, has served us as a base data for the development of cartography. The results of this mapping are shown schematically in a simple way and allowed the various players in a flood risk management framework to use it as an aid tools in the decision.
Finally, we have included our results in a descriptive graphic representation of the flood propagation simulation in the previously less flooded area in order to improve local resilience. In this sense, this work offers to decision makers, who are not always experts, a clear and simple vision to compare different projects and development scenarios likely to be realized. It provides a database to other planners. Consequently, it is implementing a consistent methodology and validates its use in the national integrated management plan for flood risk in Algeria.
References
- A National Insurance Board, International Seminar on Natural Disasters Insurance, Special Press Review Natural Disasters, 09-14 November. 2011.
- National Project ALG / 98 / G31, Ministry of spatial planning and environment, Directorate general for the environment, Development of National Strategy and Action Plan on Climate Change, Initial National Communication, 2001.
- Merabet A. Study of the protection of the city of Sidi Bel Abbés against floods. Memory of magister. University of Sidi Bel Abbés Algeria. 2008.
- MEDD. Ministry of ecology and sustainable development france, pollution prevention and risk management directorate, major hazards prevention branch. Major natural hazards: Floods. 2004.
- Medjerab A. The catastrophic floods of October 2008 in Ghardaia, Geographia Technico, Special Issue. 2009:11-316.
- ANRH, Behlouli L. Floods and floods in Algeria. 2009.
- UNESCO Office in the Rebate, office of the maghreb cluster, climate change issues and prospects in the maghreb, climate change in Algeria: Future climate change, challenges and prospects, GEB-Environment, Morocco. 2010.
- Ministry of Water Resources, Algerian Space Agency, Technical Workshop, Use of Space Technologies for Water Resources, Algiers. 2012.
- Kouzmine Y. Thesis in geography, dynamics and territorial changes in the Algerian Sahara: Towards new approaches based on observation, University of Franche-Comté, Doctoral School `Language, Space, Time, Societies. 2007.
- Direction of planning and spatial planning, the datasheets of the communes. 2012.
- Daily Journal National Information, The Citizen of 14th April 2009 N° 1557. 6.
- Agricultural Services Directorate, establishment plan and livestock production. 2013.
- Bonnard Gardel. Hydrological study of Wadi M’Zab. Editeur : Kerbachi R, Joumard R, Boughedaoui M, Goger T. 1996.
- Ministry of internal affairs and local communities, directorate general of civil protection, prevention department, sub directorate of major hazards, office of natural risks, report on the Ghardaia Floods of 01/08/2008. 2009.
- Fread.D.L. Theoretical development of an implicit dynamic routing model. Hydrologic research laboratory. Office of hydrology. U.S. Department of Commerce, NOAA, NWS, Silver Spring, Md., presented at Dynamic Routing Seminar, Lower Mississippi River Forecast Center, Slidell, LA. 1976.
- Bonnard, Gardel . Study of sanitation and protection against flooding of the valley of the river M’Zab,Bonnard, Gardel Engineers-advisors SA. 2002.
- Stewart P. Rainfall quotient and biosphere degradation Bull. Soc. Hist. Nat. Afr. North, Algiers, 59. 1969:14.
- DBAT. Direction of the planning and the development of the territory of the wilaya of Ghardaia Attlas Of Ghardaia. 2005.
- Benaouadj Abderraouf. National superior school of hydraulic Arbaoui Abdellah, Magister Memory. Contribution of Study of floods in the M’Zab valley in the wilaya of Ghardaia. 2011.
- Roche. The M'Zab, ibadite architecture in Algeria, Manual, Arthaud. 1973.
- Ladjal Rabah. Issue of resource mobilization and preservation, Abou BekrBelkaid University Tlemcen, Option: Mobilization and protection of water resources. 2013:46.
- HEC-RAS Version 4.1.0 Laboratory Guide. 2005.
- Chachoua Abdeldjalil. Management flood of th watersheld ; Etude hydrological study, hydraulic and planning, Magister Memory-University of Tlemcen. 2009.
- Harvey F.A. Primer of fundamentalgeographic and cartographic concepts) the Guilford press New-York London. 2008:65.
- Terfous. 1st year course magister in hydraulics. Option: flow and solid transport, HEC RAS operating instructions, INSA-Strasbourg. 2011.
- http://www.protectioncivile.dz
- Deblane Khaled. Fluvial and torrential hydraulic with presentation and handling of Hec-Ras, Arc-Gis and Hec-Geo-Ras software. 2010:120.
- Diren R.A., Diren Rhone. Alpes, Flood risks in Rhone-Alpes: from knowledge to prevention" 2004 review and Outlook, Serge Alexis, Francoise Gauquelin, François Dols. 2004:27.
- Dajoz R. Precis of ecology. Ed. Dunod, Paris. 1971:434.
- Vauvert C. Commune of Vauvert. Study of the flood hazard and mapping of the flood zones on the sectors of Valat de la Reyne and Gallician. 2004.
- Rodier, Auvray. Estimation of decadal flood flows for watersheds of less than 200 km2 in West Africa. Publ. Orstom, Cieh. 1965:30.