Research Article - Insights in Nutrition and Metabolism (2018) Volume 2, Issue 1
Effect of a formulation with nopal (Opuntia ficus indica), amaranth (Amaranthus cruentus) and mushroom (Pleurotus ostreatus) in a murine model of diet-induced cardiometabolic disruptions
Alejandra Romo-Araiza, Alejandro Ríos-Hoyo, Antonio Ibarra, Marcela Hernández-Ortega, Gabriela Gutiérrez-Salmeán, Marcos Meneses-Mayo*
Centro de Investigación en Ciencias de la Salud (CICSA).Facultad de Ciencias de la Salud, Universidad Anáhuac México, Huixquilucan, Estado de México, México
- *Corresponding Author:
- Marcos Meneses-Mayo
Centro de Investigación en Ciencias de la Salud (CICSA), Facultad de Ciencias de la Salud, Universidad Anáhuac México, Huixquilucan, Estado de México, México
Tel: 00 (52) 5556270210 ext 7247
E-mail: marcos.meneses@anahuac.mx
Accepted on March 20 2018
Citation: Romo-Araiza A, Ríos-Hoyo A, Ibarra A, et al. Effect of a formulation with nopal (Opuntia ficus indica), amaranth (Amaranthus cruentus) and mushroom (Pleurotus ostreatus) in a murine model of diet-induced cardiometabolic disruptions. Insights Nutr Metabol 2018;2(1):5-13.
Abstract
Cardiovascular diseases (CVD) are the first cause of death in Mexican population. Metabolic disruptions induced by diet are, in turn, associated with CVD. Within treatment, functional foods, such as nopal, amaranth and mushrooms, may be incorporated in order to attenuate such cardio metabolic diseases. The aim of this study was to develop nutritional bars based on three foods with beneficial potential to prevent cardio metabolic diseases due to the presence of important phytochemicals: nopal, amaranth and oyster mushroom. For this purpose, two experiments were carried out. First, four formulations for nutritional bars were elaborated based on the aforementioned foods. Proximate analysis, phenolic and flavonoid content were obtained for the four formulations; subsequently, the two that exhibited higher amounts of fiber, phenolic and flavonoid content were chosen for an in vivo experiment which aimed to evaluate the effect of those formulations on lipid profile, glycemia and body weight on a murine model of diet-induced cardio metabolic disruption. After two months of treatment, both formulation ssignificantly decreased body weight and triacyglycerol levels in rats fed with the functional bars (p<0.0001). These results indicate that a mixture of nopal, amaranth and mushroom could improve cardiometaboic disruptions.
Keywords
Nopal, Amaranth, Oyster mushroom, Cardio metabolic disruption, Functional food.
Introduction
Cardio metabolic disruptions include diseases such as obesity, high blood pressure, dyslipidemia, hyperglycemia and insulin resistance. These are intimately related with the development of metabolic syndrome (MetS), which confers a 2 to 2.5-fold increase in the risk of developing cardiovascular diseases and death [1-3].
In Mexico, the prevalence of metabolic syndrome and therefore cardio metabolic disruptions, is high (27-41%) [4], whilst the prevalence of abdominal obesity is up to 73.9% [5]. The treatment requires lifestyle changes, and in most cases pharmacological treatment for each of the diseases that enclose MetS [2,6]. Pharmacological treatment has the disadvantage of producing adverse effects that may lead to poor tolerance and compliance for the long-term use [2,7]. Dietary treatment has no secondary effects and several studies have been conducted to correlate the beneficial effects of food due to the presence of diverse phytochemicals, which are food compounds that exhibit biological actions and exerts therapeutical potential [8], such as prevention and/or treatment of cardio metabolic disruptions [6].
Some examples of foods with high phytochemical content are nopal, amaranth and the oyster mushroom.
Nopal (Opuntia ficus indica) contains dietary fibers such as pectin and mucilage, as well as phytosterols [9]; which interfere with fat absorption and therefore may lower cholesterol blood levels [10].
It also contains phenolic compounds, which have antioxidant potential, and are capable to regulate gene expression and enzyme activity involved in lipid metabolism, such as 3- hydroxy-3-methylglutaryl CoA (HMG-CoA) reductase, peroxisome proliferator-activated receptor (PPAR) gamma, scavenger receptor B1 (SR-B1), low density lipoprotein cholesterol (LDL-c) receptors and nuclear liver X receptors (LXR) [11-13].
Dehydrated nopal has been administrated to rats, finding that this fruit reduced weight gain (p<0.05) and decreased in a 34% the LDL-c serum concentration. Glycemia, total cholesterol and HDL were not modified with the consumption of nopal [14].
In regard to amaranth (A. cruentus), this pseudocereal contains unsaturated fatty acids such as oleic and linoleic acids, which help to decrease LDL-cholesterol by increasing hepatic LDL-c receptors. Polyunsaturated fatty acids inhibit the expression and activity of some transcription factors such as sterol regulatory element-binding protein 1c (SREBP-1c), which in turn regulates genes involved in synthesis and metabolism of fatty acid, while activating other transcription factor called PPAR-α, that expresses proteins implicated in fatty acid oxidation [15,16]. It also contains phenolic compounds and squalene (6-8% of total lipid content). Squalene is a steroid precursor that inhibits HMG CoA reductase, therefore decreasing cholesterol biosynthesis [17,18]. Dyslipidemic Wistar rats fed for 32 days on a diet supplemented with 10% amaranth showed a reduction in total cholesterol by 25.6, LDL by 38.1 and triacyglycerol 14.8 [19].
Oyster mushroom (Pleurotus ostreatus), for its side, contains statins such as lovastatin that has proved to inhibit the HMGCoA reductase [20]. Several studies have been carried out with the genus Pleurotus. A study in normo and hypercholesterolemic rats administered with 5% of Pleurotus salmoneo stramineus powder, showed a reduction of 22.6% in total cholesterol, 51.4% in triacyglycerol, 69.23% in LDL-c, 29.67% in total lipids and 16.61% in phospholipids in rats with hypercholesterolemia, without adverse effects [21].
Due to the necessity to formulate new therapeutic strategies for diseases such as dyslipidemia, hyperglycemia, obesity and other cardio metabolic diseases, it would be important to evaluate the effect of the aforementioned foods formulated as a nutritional bar.
Materials and Methods
Diet formulations
Nopal and Pleurotusostreatus were dehydrated in a hot air dryer for 10 and 6 h, respectively, at 70°C, and further pulverized in a mill (Foss Homogeinizer 2094, USA), to obtain nopal flour (NF) and Pleurotus flour (PF). Amaranth flour (AF) was obtained in Mexicofrom a local supplier (Amaranto San Miguel®).
Rat pellets (RodentChow5001®), were ground in order to obtain a pellet flour denominated as Rat Food Flour (RFF)
All the flours were mixed into different proportions, as shown in Table 1. They were further blended with water (35 ml/100 g), egg yolk (5 g/100 g), egg white (30 g/100 g) and lard (20 g/100 g) to obtain a uniform mass t. The mixture was pelleted and oven baked for 4 h at 60°C and then dried in a forced air oven Riossa HCF-41 for 24 h at 60°C to remove excess moisture.
| Diet formulations | ||||
|---|---|---|---|---|
| F1 | F2 | F3 | F4 | |
| Ingredients | Percentages of dried weight (%) | |||
| Rat food flour (RFF) | 50 | 50 | 50 | 50 |
| Nopal flour (NF) | 16.6 | 15 | 25 | 10 |
| Amaranth flour (AF) | 16.6 | 30 | 0 | 20 |
| Pleurotus flour (PF) | 16.6 | 5 | 5 | 20 |
Experimental formulations: FI=Formulation 1 (50% RFF 16.6% NF, 16.6% AF, 16.6% PF); F2=Formulation 2 (50% RFF, 15% NF, 30% AF, 5% PF); F3=Formulation 3 (50% RFF, 25% NF, 20% AF, 5% PF); F4=Formulation 4 (50% RFF, 10% NF, 20% AF, 20% PF)
Table 1. Composition of the diet formulations.
Proximate and caloric analysis of flours, commercial pellets and diet formulation pellets
The proximate analysis of the different flours and pellets was performed following the methods reported by the AOAC (moisture, dry matter, organic matter, ash, total protein, crude fat and crude fiber) (20ed) [22], All results were reported as g/100 g in dry basis (d.s.)
Caloric content of the flours and pellets were determined using a Parr Model 6400 calorimeter and the results were express as calories (kcal).
Phenolic and flavonoid content in flours, commercial pellets and diet formulations
For the extraction of phenolic compounds and flavonoids, 1 g of sample was mixed with 10 ml of hexane in a falcon tube and centrifuged at 3500 rpm for 15 min; the supernatant was allowed to dry for 1 day at room temperature. After this, 0.4 g of dry sample was introduced into a cryotube tube and 1 ml of 80% methanol was added; the mixture was sonicated for 30 min and then centrifuged at 3000 rpm for 10 min. The supernatant was recollected to perform the different analysis. The amount of phenolic compounds was determined by the Folin-Ciocalteu method [23]. The reaction was measured on an EPOCH spectrophotometer BioTek® at 765 nm, using Gallic acid as standard. The results were expressed as μg of gallic acid equivalents (GAE)/g.
A colorimetric assay was used for the quantification of flavonoids. 3 μl of 5% sodium nitrite were added to 10 μl of sample. After 5 min, 3 μl of 10% aluminum chloride was added and the mixture was allowed to stand for 6 min. Finally, 20 μl of 1 M sodium hydroxide were added and the absorbance was measured immediately at 510 nm.
Experimental animals
Eighteen two month-old male Wistar rats of 300 ± 20 g body weight were used. They were housed in acryliccages under controlled conditions of 22 ± 2°C and 12 h light-dark cycle. Throughout all the study the welfare of the animals was kept.
To induce the obesity by diet, all rats were fed ad libitum during 15 weeks with commercial pellets (RodentChow5001®), which were previously treated by immersion in lard at a ratio of (1:0.7) for 6 h at 60°C. In order to increase the amount of calorie intake in the animals, a 30% sucrose solution was used as drinking water. Consumption of food and water was recorded daily, and body weight was measured once a week.
In vivo intervention with the diet formulations
After 15 weeks of diet induction, the 18 rats were randomly divided into 3 groups (n=6 each): a control group which remained being fed the obesogenic diet, and two experimental groups which were fed with different diet (F1 and F2 formulations) for 9 weeks. All groups continued with the highfat and sugar addition to their diet (sucrose and lard).
Serum collection and biochemical analysis
At 15 and 24 weeks of treatment, blood samples from rats were obtained by cardiac puncture with a pre-heparinized syringe, after isoflurane anesthesia and with a 12 h fasting. Blood samples were centrifuged at 3500 rpm for 15 min at 4°C and the plasma was separated and stored at -80°C until analysis. Glucose, total cholesterol, triacyglycerol, LDL-c and HDL-c analyzes were performed using the commercial kits (RANDOX LABORATORIES LTD. 55 Diamond Road, Crumin, Country Antrim. BT29 4QY United Kingdom).
Data analysis
Data were expressed as mean ± standard deviation (SD) of triplicate analysis. Data obtained from the flours and diets formulations were analyzed by means of One-way ANOVA followed by the post-hoc Tukey test. Data on weight, lipid profile and glucose were analyzed by Kruskal-Wallis (intergroup comparison) followed by the post-hocDunn's test. In the case of intra-group comparison, we used the Wilcoxon test. A value of p<0.05 was considered as significant. All analyzes were done in triplicate and the GraphPadPrism 5 program was used for statistical analysis. Data are expressed as mean ± standard deviation (SD).
Results
Proximate analysis, phenolic and flavonoid content of nopal, Amaranth and Pleurotus flours
Table 2 resumes the results of the evaluation of the different flours. As it can be observed, Pleurotus flour (PF) presented the highest crude fiber content compared with the other flours (p<0.0001).
| Nutrient Content (% DM) | Study Flours | ||
|---|---|---|---|
| NF | AF | PF | |
| Dry matter | 93.22 ± 0.20a | 96.92 ± 0.46b | 93.31 ± 0.26a |
| Moisture | 6.64 ± 0.20a | 3.08 ± 0.46b | 6.69 ± 0.26a |
| Organic matter | 84.34 ± 0.08a | 96.79 ± 0.3b | 92.01 ± 0.03c |
| Ashes | 15.61 ± 0.16a | 4.16 ± 1.06b | 7.97 ± 0.06c |
| Protein | 5.49 ± 0.34a | 15.73 ± 0.08b | 22.38 ± 0.51c |
| Ethereal extract | 0.69 ± 0.13a | 1.70 ± 0.23b | 0.77 ± 0.08a |
| Crude fiber | 3.70 ± 0.13a | 3.11 ± 0.03b | 8.08 ± 0.15c |
| Calories (kcal/g) | 3.58 ± 0.00a | 4.65 ± 0.00b | 4.37 ± 0.02c |
| Phenolic acids (µg GAE/g) | 971.1 ± 1.41a | 66.47 ± 2.81b | 596.1 ± 2.79c |
| Flavonoids (µg/g) | 449.10 ± 24.90a | 44.02 ± 0.0b | 298.00 ± 0.00c |
NF: Nopal Flour; AF: Amaranth Flour; PF: Pleurotus Flour. On each line, different letters means significance difference (p<0.0001). Data showed as mean ± SD of triplicate samples. Data analyzed by One-way ANOVA followed by Tukey´s post-hoc test
Table 2. Proximate analysis and phenolic and flavonoid of nopal, amaranth and Pleurotus flours.
Regard the phenolic and flavonoid content, nopal flour (NF) had the highest amount of these phytochemicals (p<0.05) followed by Pleurotus flour (PF).
Proximate analysis, phenolic and flavonoid content of commercial pellets and diet formulated pellets
Table 3 shows the results of the proximate analysis and phytochemical content of the commercial pellets and experimental formulations pellets.
| Nutrient Content (% DM) | Experimental Formulations | Control | |||
|---|---|---|---|---|---|
| F1 | F2 | F3 | F4 | LP | |
| Dry matter | 95.75 ± 0.62a | 97.42 ± 0.05b | 96.50 ± 0.09ac | 96.92 ± 0.02bc | 95.80 ± 0.11a |
| Moisture | 4.25 ± 0.62a | 2.58 ± 0.05b | 3.50 ± 0.09ac | 3.08 ± 0.02bc | 4.20 ± 0.11a |
| Organic matter | 91.78 ± 0.22a | 91.78 ± 0.27a | 90.42 ± 0.12b | 92.61 ± 0.10c | 93.89 ± 0.11d |
| Ashes | 8.379 ± 0.44a | 8.115 ± 0.54a | 9.578 ± 0.24b | 7.34 ± 0.20c | 6.11 ± 0.10d |
| Protein | 21.42 ± 0.29a | 21.98 ± 0.13ab | 21.22 ± 0.49a | 22.77 ± 0.34b | 21.84 ± 1.34ab |
| Ethereal extract | 19.24 ± 0.15a | 19.25 ± 0.61a | 19.39 ± 0.64a | 19.10 ± 0.42a | 21.02 ± 0.12b |
| Crude fiber | 13.81 ± 0.46a | 4.60 ± 0.16b | 4.67 ± 0.06b | 3.81 ± 0.16b | 1.79 ± 0.08c |
| Calories (kcal/g) | 5.26 ± 0.80ab | 5.27 ± 0.09 | 5.26 ± 0.02 | 5.27 ± 0.02 | 5.46 ± 0.11d |
| Phenolic acids (µg GAE/g) | 60.70 ± 0.07a | 63.82 ± 0.14b | 57.95±0.14c | 57.97±0.14c | 26.37 ± 0.21d |
| Flavonoids (µg/g) | 27.30 ± 2.49a | 41.32 ± 2.49b | 16.64 ± 2.47c | 11.45 ± 0.00c | 20.14 ± 2.47ac |
Experimental formulations: FI=Formulation 1 (50% CF, 16.6% NF, 16.6% AF, 16.6% PF); F2=Formulation 2 (50% CF, 15% NF, 30% AF, 5% PF); F3=Formulation 3 (50% CF, 25% NF, 20% AF, 5% PF); F4=Formulation 4 (50% CF, 10% NF, 20% AF, 20% PF); LP=commercial pellets immerse in lard. NF: Nopal FLOUR; AF: Amaranth Flour; PF: Pleurotus Flour. All pellet experimental formulations were immersed in lard. Data shown as means ± SD of triplicate sample. Data analyzed by One-way ANOVA followed by Tukey´s post-hoc test. On each line, different letters means significance difference (p<0.01) by triplicate
Table 3. Proximate analysis, phenolic and flavonoid content of commercial pellets and experimental formulated pellets.
In this respect, the formulation F1 showed the highest content of crude fiber (p<0.0001) among all formulations. In the phenolic content, the formulations F1 and F2 showed higher content, being statistically different (p<0.01) to the formulations F3 and F4; the commercial pellets added with lard had the lowest concentration of phenolic compounds. The flavonoid content, the F2 formulation had the highest content (p=0.0003).
Because diet formulations F1 and F2 had the highest content of phenolic compounds and crude fiber, they were selected for the in vivo experiment.
Body weight reduction and lipid-lowering effect of diet formulation in Wistar rats
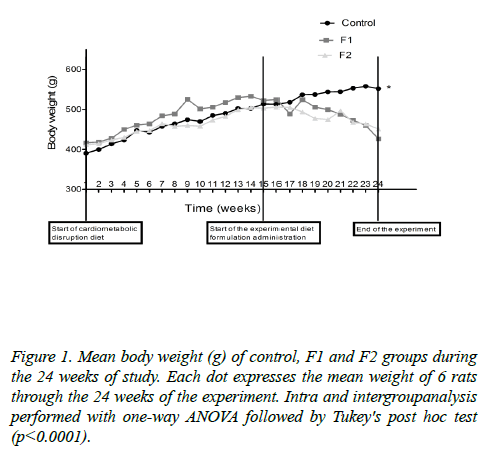
Body weight and energy consumption: All rats started with a similar weight (p>0.05). A very similar weight gain was observed up to week 15 (period of cardio metabolic disruption).
The rats fed with F1 or F2 formulations, presented a period of stabilization after 15 weeks of follow up, due to the diet change. Afterwards, from week 19 (one month after the diet change), they began to lose weight until the end of the study, as opposed to the control group (Figure 1).
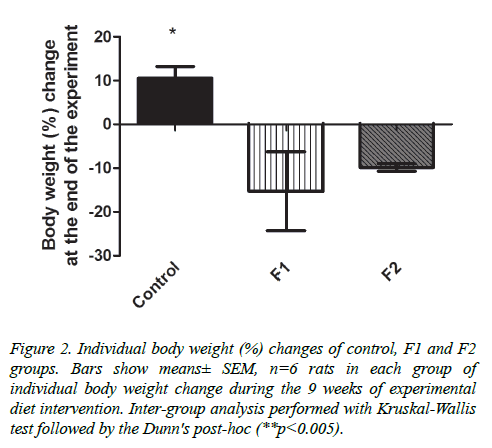
Individual body weight change from week 19 until the end of the experiment was also measured; control group increased their weight, while both treated groups rats decreased weight, showing a significant different between control and F1 group (p<0.005) (Figure 2).
Figure 2. Individual body weight (%) changes of control, F1 and F2 groups. Bars show means± SEM, n=6 rats in each group of individual body weight change during the 9 weeks of experimental diet intervention. Inter-group analysis performed with Kruskal-Wallis test followed by the Dunn's post-hoc (**p<0.005).
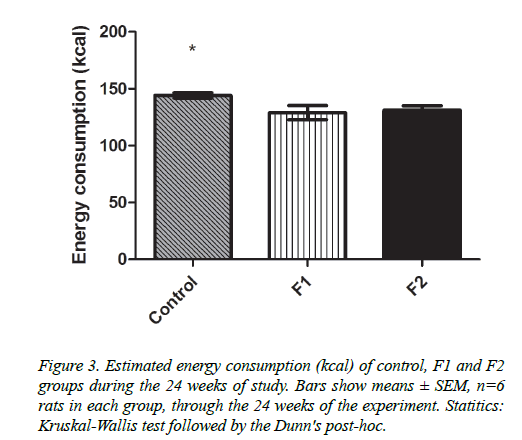
Regarding the consumption of total kilocalories in the three groups, it was shown that the rats to which the formulation F1 was administered consumed 118.1+58.91 kcal/day, F2 consumed 128.2+35.97 kcal/day and the control group consumed 142+21.73 kcal/day; showing a significant difference (p<0.00019) between the control group and the other two study groups (Figure 3).
Serum lipid profile and glucose levels analysis
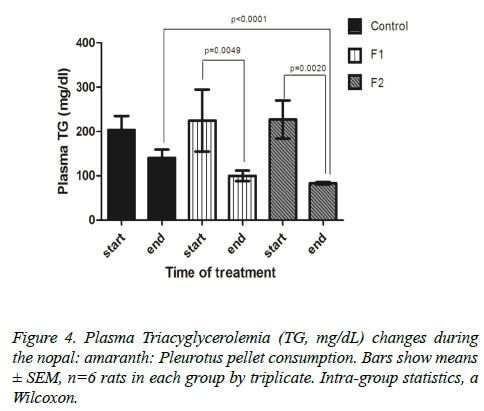
Lipid profile (triacyglycerols, total cholesterol, LDL-c and HDL-c): Figure 2 show that the F1 and F2 groups presented a significant reduction on plasma triacyglycerol levels after 9 weeks of treatment. F1 formulations reduced the triacyglycerols from 225 ± 252.3 mg/dl to 99.86 ± 39.14 mg/dl (55.6 ± 17.8%), while the F2 started with 227.1 ± 150.4 mg / dl and decreased to 83.27 ± 9.08 Mg/dl (63.3 ± 4.14%). In this respect, only the F2 group showed a significant difference (p<0.0001) against the control group at the end of the study (Figure 4).
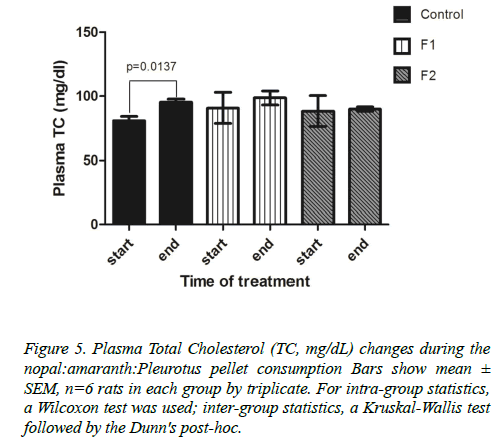
As for total-cholesterol level, all groups increased their plasma levels, but only the control group showed a significant increase, from 81.08 ± 6.25 mg/dl to 95.15 ± 8.81 mg/dl (p=0.0137) (Figure 5).
Figure 5. Plasma Total Cholesterol (TC, mg/dL) changes during the nopal:amaranth:Pleurotus pellet consumption Bars show mean± SEM, n=6 rats in each group by triplicate. For intra-group statistics, a Wilcoxon test was used; inter-group statistics, a Kruskal-Wallis test followed by the Dunn's post-hoc.
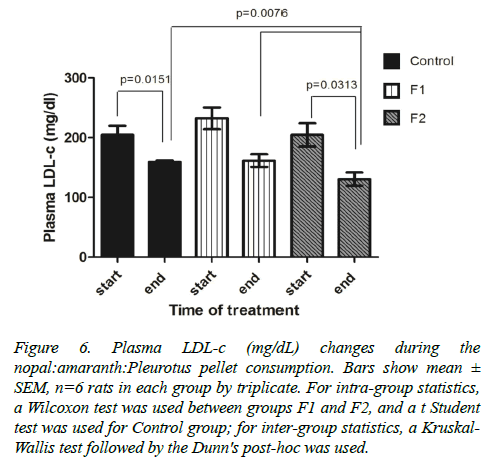
However, LDL-c levels decreased significantly in the control group and in the F2 group (Figure 6). When comparing the three experimental groups for the period of cardio metabolic disruption (15 weeks), these showed different ranges of LDL-c reduction: F1: 232.5 ± 51.25 to 161.7±26.06 mg/dl, F2: 204.9 ± 55.02 to 130.7 ± 27.58 mg/dl and controls: 204.9 ± 42.45 to 159.1 ± 9.48 mg/dl). Only the group of rats given the formulation F2 showed a significant difference against the control group (p=0.0076).
Figure 6. Plasma LDL-c (mg/dL) changes during the nopal:amaranth:Pleurotus pellet consumption. Bars show mean ± SEM, n=6 rats in each group by triplicate. For intra-group statistics, a Wilcoxon test was used between groups F1 and F2, and a t Student test was used for Control group; for inter-group statistics, a Kruskal- Wallis test followed by the Dunn's post-hoc was used.
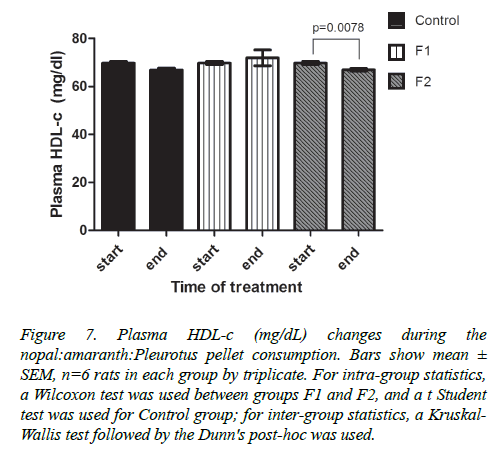
HDL-c levels showed no significant difference between the three experimental groups after 9 weeks of treatment. However, the F2 group significantly decreased HDL-c concentration (p=0.0078) when compared from the cardio metabolic disruption period to the end of the treatment; concentrations ranged from 69.79 ± 2.68 to 67 ± 1.99 mg/dl, respectively. Control group also decreased HDL-c concentration from 69.79± 2.68 to 66.91 ± 3.62 mg/dl (Figure 7).
Figure 7. Plasma HDL-c (mg/dL) changes during the nopal:amaranth:Pleurotus pellet consumption. Bars show mean± SEM, n=6 rats in each group by triplicate. For intra-group statistics, a Wilcoxon test was used between groups F1 and F2, and a t Student test was used for Control group; for inter-group statistics, a Kruskal- Wallis test followed by the Dunn's post-hoc was used.
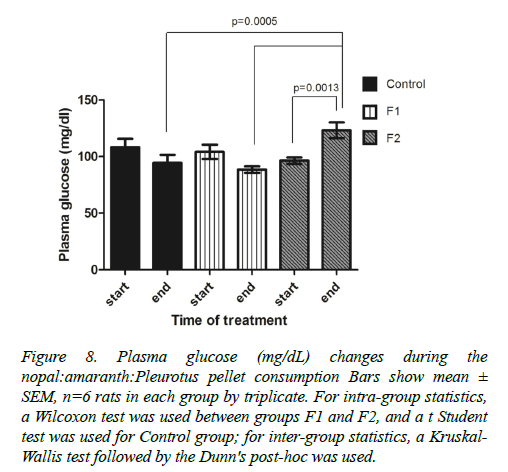
Blood glucose: A significant increase in glycemia was observed in the group of rats given the F2 formulation, increased from 96.4 ± 2.93 mg/dl to 123.2 ± 6.93 mg/dl (Figure 8).
Figure 8. Plasma glucose (mg/dL) changes during the nopal:amaranth:Pleurotus pellet consumption Bars show mean± SEM, n=6 rats in each group by triplicate. For intra-group statistics, a Wilcoxon test was used between groups F1 and F2, and a t Student test was used for Control group; for inter-group statistics, a Kruskal- Wallis test followed by the Dunn's post-hoc was used.
Discussion
In this study, we provide a possible therapeutic strategy to decrease triacyglycerolemia and other cardio metabolic disruptions. The results can initiate lines of research in this type of pathologies so that at some point clinical studies can be planned.
At the present study we can observe that F1 formulation has the highest percentage of raw fiber. This could be correlated to the decrease in glycemia observed in this group of rats.
On the other hand, F2 formulation had the highest content of phenolic compounds and flavonoids, although it was high in amaranth content, which itself is the food that contains the least amount of these compounds. The mixture and processing (as in baking) the food used for this formulation, may changes the proportion of phenolic compounds and flavonoids, as these processes may favor the release of these compounds.
Phenolic compounds and flavonoids are present primarily in fruits, vegetables and grains; some of these foods may have to be processed before eating. For long time it was thought that its process would have deleterious effects on the health benefits of foods, but recent research has established that it may improve these benefits [24].
As this processing may benefit the health properties of food, it may in some cases affect it, as we observed in F3 formulation, which had a lower content of phenolic acids and flavonoids than F2 formulation, although it was the nutritional formulation with the highest amount of nopal. Dehydrated nopal was the food that contained the highest amount of these compounds. This alteration could be due to long baking times that could cause loss of phenolic compounds.
On the other hand, F4 formulation has the lowest content of phenolic acids, flavonoids and fiber. This formulation had the lowest content nopal, which makes us suppose that the nopal is important for the contribution of these compounds in a functional food, and it is better that it is present in a proportion of at least 15%.
Once all formulations were analyzed, F1 and F2 were chosen for an in vitro experiment on a murine model of diet-induced cardiometabolic disruption.
We found that mixtures elaborated with the F1 and F2 formulation exerted a significant reduction in triacyglycerol levels (44.16 ± 15.27 and 57.09 + 17.41%, respectively); even though immersion (lard) and sugar (30%) continued to be administrated in the food and drinking water, respectively. A similar decrease was observed in a study that fed 4% of Opuntia ficus indica to obese Zucker rats for 7 weeks, showing a reduction around 50% of hepatic triacyglycerol levels as compared to controls [11]. Another study in rats fed with a high-cholesterol diet added with 2.5% amaranth (A. mantegazzianus protein concentrate) demonstrated a decreased in triacyglycerol by 47% [18].
As we cared about evaluating cardio metabolic disruptions, mainly focusing in dyslipidemia, we also measured total cholesterol levels. Contrary to triacylglycerol, total cholesterol increased in all the studied groups (Control: 17.35%, FI: 8.48% and F2: 1.96%); however, this increase was only significant in the control group. This can be attributed to the fact that consumption of the high fat diet and sugar in water was not suspended during the 9 weeks of treatment.
The failure to decrease total cholesterol levels could also be due to the heat treatment applied in the preparation of the experimental formulated pellets, as this may not have been effective enough to break the fibrous cell wall matrix of the study foods. In many cases the phenolic compounds and flavonoids are within the cell membrane, and this must be broken to allow the release of the compounds and increase their accessibility. In this respect, the phenolic compounds that are within the vacuoles of the cell wall will therefore have a low availability (about 0.6%), while when released the availability can increase up to 60% [25,26]. Thus, to achieve an increase in bioavailability food must be subjected to culinary preparations such as heating to break the cell membrane and release phenolic compounds [25]. Ingestion of soluble fiber and its presence in the gut can also decrease the absorption of compounds such as polyphenols and flavonoids by entrapping them as it does with sugars and fats [27].
Anyway, total cholesterol might not give us a precise idea of dyslipidemia and its health issues, as it is important to determine how much of it is "harmful" as in LDL-c levels and how much is "beneficial" as in HDL-c levels. For this purpose, we also measured these two types of cholesterol. In this study, LDL-c levels were significantly lower in rats receiving the F2 formulation (36.21% decrease), which may be related to the higher phenolic acid content of this diet formulation.
Regarding the control group, LDL-c levels also decreased significantly (22.35%), but total cholesterol significantly increased 17.35%. To get a better view of the implication of these results we also measured HDL-c.
In this regard, a decrease in HDL-c levels was observed in the Control and F2 groups. The results correlate with other studies in which there has not been found a significant change in HDL-c levels after consumption of nopal, amaranth or Pleurotus alone; such as the study by BetimCazarin et al. [28] in which the supplementation with 35% amaranth (A. cruentus) for 20 days showed a decrease in total cholesterol levels of 50%, without affecting HDL levels in rats.
A reduction in HDL-c, whilst total cholesterol increased in the control group, may mean that non-HDL-c, such as very low density lipoprotein (VLDL) increased, which is also an atherogenic lipoprotein [29].
Body weight was measured and energy consumption was estimated in three groups: control, F1 and F2.
In this work, we found an important weight loss on the two groups consuming the experimental diets, while the control group gained weight, regardless that all three groups ate a high sucrose and fat diet.
As energy consumption is also important for weight loss, we also estimated the rats caloric intake. Control group ate 16.8 and 9.7% more calories than F1 and F2 groups, respectively; the difference in caloric intake may be related to body weight changes, as control group did gain weight (10.58 ± 6.37%) whereas F1 and F2 groups decreased weight (15.27 ± 17.99 and 9.85 ± 1.94%, respectively). F1 group was the one that decreased the most weight and the one that consumed fewer calories per day, so a relationship between these two parameters can be assumed.
However, there seems to be no relationship between calorie consumption and lipid profile, as F2 group, which consume more calories than F1 group, had lower triacylglycerol, cholesterol and LDL-c concentrations, as well as higher HDL-c concentrations, leading to a much better lipid profile than control and F1 groups. This may be related to the nutraceutical diet components, as F2 diet had the highest phenol and flavonoids content.
Another important component of MetS that correlates with cardio metabolic disruptions is hyperglycaemia, which may also lead to diabetes. High sucrose diet may cause an increase in glucose levels, for this reason we measured glycemia. The dyslipidemic diet did not lead to an increase in glucose levels in any of the experimental groups; however, after the 15 weeks of treatment with our formulations, we observed an increase of glycemia in the group of rats to which the formulation F2 was administered. This elevation of glucose can be attributable to the high content of amaranth flour. Previous studies by Pasko et al. [30] carried out in rats have shown increases in glycaemia and insulin resistance by amaranth consumption.
Studies of in vitro digestion processes of amaranth have shown that when it is processed, the seed increases their glycemic index (GI). The GI of toasted amaranth seeds is higher than that of white bread (105.81+0.16 vs. 94.61+0.00 GI) [31].
The F2 treatment group decreased triacyglycerol levels efficiently; however it also showed unfavourable effects, such as a decrease in HDL-c levels and an increase in glucose levels. Due to these effects, it is recommended to offer the F1 diet formulation treatment for later studies.
Conclusion
Vegetables and grains are great sources of antioxidants and nutraceuticals, making them a great option for the prevention and treatment of several chronicle diseases such as dyslipidemia. The formulation of different mixture of different foods may serve as an innovative way to obtain the benefits that confers the consumption of several of these foods.
In our study we formulated different mixtures of nopal, amaranth and mushroom flours. Both F1 (50% conventional flour, 16.6% nopal flour, 16.6% amaranth flour and 16.6% mushroom flour) and F2 (50% conventional flour, 15% nopal flour, 30% amaranth flour and 5% mushroom flour) formulations had the highest crude fiber, phenolic and flavonoids content. Diet formulations decreased body weight and triacyglycerol after 2 months of treatment in Wistar rats with cardio metabolic disruptions, but F2 significantly increased glycemia, therefore it is suggested that formulation F1 (equal amount of each flour) could be considered a better option for the control of cardio metabolic disruptions [32].
Ethical Approval
All experimental animals were monitored according to the technical specifications for the production, care and use of laboratory animals provided for in Mexican Official Norm (NOM-062-ZOO-1999).
The project was evaluated and accepted by the local Ethics Committee of our Institution (Universidad Anáhuac México campus Norte).
Acknowledgement
This research was supported by funding from Anahuac Mexico University, (Centro de InvestigaciónenCiencias de la Salud (CICSA)).
Alejandra Romo-Araiza designed the study. Gabriela Gutiérrez-Salméan helped with the design and analysis of the study. AlejandraRomo-Araiza and Alejandro Ríos-Hoyo carried on the proximal and nutraceutical analysis of flours and experimental formulations, as well as the blood analysis. Marcela Hernández-Ortega was in charge of assembling the techniques for the phenolic and flavonoid analysis of the foods. Drs. Antonio Ibarra and Marcos Meneses-Mayo co-senior this study and paper.
References
- Gutiérrez-Salmeán G, Meaney E, Lanaspa MA, et al. A randomized, placebo-controlled, double-blind study on the effects of (−)-epicatechin on the triglyceride/HDLc ratio and cardiometabolic profile of subjects with hypertriglyceridemia: Unique in vitro effects. Int J Cardiol. 2016;223:500-6.
- Kaur J. A comprehensive review on metabolic syndrome. Cardiol Res Pract. 2014;2014.
- O'neill S, O'driscoll L. Metabolic syndrome: a closer look at the growing epidemic and its associated pathologies. Obes Rev. 2015;16:1-12.
- Heiss G, Snyder ML, Teng Y, et al. Prevalence of metabolic syndrome among Hispanics/Latinos of diverse background: The Hispanic community health study/study of latinos. Diabetes Care. 2014;37:2391-9.
- Gutierrez JP, Rivera-Dommarco J, Shamah-Levy T, et al. Encuesta nacional de salud y nutrición 2012. Resultados Nacionales Cuernavaca, México: Instituto Nacional de Salud Pública. 2012:108-12.
- Massaro M, Scoditti E, Carluccio MA, De Caterina R. Nutraceuticals and Prevention of Atherosclerosis: Focus on ω‐3 Polyunsaturated Fatty Acids and Mediterranean Diet Polyphenols. Cardiovasc Ther. 2010;28(4):e13-e9.
- Anderson TJ, Grégoire J, Hegele RA, et al. 2012 update of the Canadian Cardiovascular Society guidelines for the diagnosis and treatment of dyslipidemia for the prevention of cardiovascular disease in the adult. Can J Cardiol. 2013;29(2):151-67.
- Magrone T, Perez de Heredia F, Jirillo E, et al. Functional foods and nutraceuticals as therapeutic tools for the treatment of diet-related diseases 1. Can J Physiol Pharmacol. 2013;91:387-96.
- López-Palacios C, Peña-Valdivia C, Rodríguez-Hernández A, et al. Rheological flow behavior of structural polysaccharides from edible tender cladodes of wild, semi-domesticated and cultivated ‘nopal’ (Opuntia) of Mexican highlands. Plant Foods Hum Nutr. 2016;71:388-95.
- Ríos-Hoyo A, Romo-Araiza A, Meneses-Mayo M, et al. Prehispanic functional foods and nutraceuticals in the treatment of dyslipidemia associated to cardiovascular disease: A mini-review. Int J Vitam Nutr Res. 2017;1:1-14.
- El-Mostafa K, El Kharrassi Y, Badreddine A, et al. Nopal cactus (Opuntia ficus indica) as a source of bioactive compounds for nutrition, health and disease. Molecules. 2014;19:14879-901.
- Lavecchia T, Rea G, Antonacci A, et al. Healthy and adverse effects of plant-derived functional metabolites: the need of revealing their content and bioactivity in a complex food matrix. Crit Rev Food Sci Nutr. 2013;53:198-213.
- Zanotti I, Dall'Asta M, Mena P, et al. Atheroprotective effects of (poly) phenols: A focus on cell cholesterol metabolism. Food Funct. 2015;6:13-31.
- Corte Osorio L, Martínez Flores H, Ortiz Alvarado R. Efecto del consumo de la fibra dietética en la expresión cuantitativa del receptor de butirato GPR43 en colon de ratas. Nutrición Hospitalaria. 2011;26:1052-8.
- Calder PC. Functional roles of fatty acids and their effects on human health. JPEN J Parenter Enteral Nutr. 2015:0148607115595980.
- Tapia G, Valenzuela R, Espinosa A, et al. N‐3 long‐chain PUFA supplementation prevents high fat diet induced mouse liver steatosis and inflammation in relation to PPAR‐α upregulation and NF‐κB DNA binding abrogation. Mol Nutr Food Res. 2014;58:1333-41.
- Shin D, Heo H, Lee Y, et al. Amaranth squalene reduces serum and liver lipid levels in rats fed a cholesterol diet. J Biomed Sci. 2004;61:11-4.
- Lado MB, Burini J, Rinaldi G, et al. Effects of the dietary addition of amaranth (Amaranthus mantegazzianus) protein isolate on antioxidant status, lipid profiles and blood pressure of rats. Plant Foods Hum Nutr. 2015;70:371-9.
- Czerwiński J, Bartnikowska E, Leontowicz H, et al. Oat (Avena sativa L.) and amaranth (Amaranthus hypochondriacus) meals positively affect plasma lipid profile in rats fed cholesterol-containing diets. J Nutr Biochem 2004;15:622-9.
- Arango CS, Nieto IJ. Cultivo biotecnológico de macrohongos comestibles: Una alternativa en la obtención de nutracéuticos. Revista Iberoamericana de Micología. 2013;30:1-8.
- Yoon KN, Alam N, Shim MJ, et al. Hypolipidemic and antiatherogenesis effect of culinary-medicinal pink oyster mushroom, Pleurotus salmoneostramineus L. Vass. (higher Basidiomycetes), in hypercholesterolemic rats. Int J Med Mushrooms. 2012;14.
- Latimer GW. Official methods of analysis of AOAC International. 20th edn. USA. 2016.
- Singleton V, Rossi JA. Colorimetry of total phenolics with phosphomolybdic-phospho tungstic acid reagents. Am J Enol Vitic. 1965;16:144-58.
- Nayak B, Liu RH, Tang J. Effect of processing on phenolic antioxidants of fruits, vegetables and grains - A review. Crit Rev Food Sci Nutr. 2015;55:887-918.
- Parada J, Aguilera J. Food microstructure affects the bioavailability of several nutrients. J Food Sci. 2007;72(2):R21-32.
- Anson NM, van den Berg R, Havenaar R, et al. Bioavailability of ferulic acid is determined by its bioaccessibility. J Cereal Sci. 2009;49:296-300.
- Palafox‐Carlos H, Ayala‐Zavala JF, González‐Aguilar GA. The role of dietary fiber in the bioaccessibility and bioavailability of fruit and vegetable antioxidants. J Food Sci. 2011;76:R6-R15.
- Cazarin CBB, Chang YK, Depieri M, et al. Amaranth grain brings health benefits to young normolipidemic rats. Food and Public Health. 2012;2:178-83.
- OLOFSSON SO, Boren J. Apolipoprotein B: A clinically important apolipoprotein which assembles atherogenic lipoproteins and promotes the development of atherosclerosis. J Intern Med. 2005;258:395-410.
- Paśko P, Bartoń H, Zagrodzki P, Gorinstein S. Effect of amaranth seeds (Amaranthus cruentus) in the diet on some biochemical parameters and essential trace elements in blood of high fructose-fed rats. Nat Prod Res. 2011;25:844-9.
- Capriles V, Coelho K, Guerra‐Matias A, et al. Effects of processing methods on amaranth starch digestibility and predicted glycemic index. J Food Sci. 2008;73:H160-H4.
- Norma-Oficial-Mexicana-NOM-062-ZOO-1999. Especificaciones técnicas para la producción, cuidado y uso de los animales de laboratorio. Diario Oficial de la Federación. 2001.
