Research Article - Biomedical Research (2016) Computational Life Sciences and Smarter Technological Advancement
Early detection of breast cancer using signal calibration neural network (SCNN) technique
S Yuvarani1* and Jothi Venkateswaran21Department of Computer Application, Thanthai Hans Roever College, Perambalur, India
2Department of Computer Science, Presidency College, Chennai, India
- *Corresponding Author:
- S Yuvarani
Department of Computer Application
Thanthai Hans Roever College
India
Accepted date: August 19, 2016
Abstract
In this work, a wearable clinical prototype with patient interface for microwave breast cancer detection is designed. It operates in the 2-4 GHz range and contains 16 wideband sensors embedded in a hemispherical dielectric radome. The cancer cell of size below 5 mm are detected and measured from breast phantom. The subsequent scan acts as a calibration signal and the skin reflections will be suppressed if the skin contour remains consistent throughout the rotation. However, the scattering response from within the breast also becomes distorted in the process as twin targets are often reconstructed from single scatterers and significant targets located near the axis of rotation are often eliminated. The proposed work designed to perform multistatic signal calibration with minimal distortion of internal breast scatterers; The proposed work offers superior tumor identification, accurate localization, and strong artifact resistance over existing wavelet algorithms. In this paper we investigate how signal processing can be accelerated for diagnosis by using NN. The various scenarios: homogenous and heterogeneous breast models with varied densities, combining both ideal and practical signal analysis methods were taken. Extensive simulations and analyses using backscattered signals received from wearable breast models were conducted to validate the performance of the proposed algorithm. From the results, we can measure the cell with 95.6% in accuracy.
Keywords
Signal calibration neural network (SCNN), Brest cancer, Wearable prototype.
Introduction
Microwave imaging techniques have been proposed as a complementary modality to the standard X-ray mammography for breast cancer screening and detection. Based on an inherent contrast in the dielectric properties of healthy and malignant breast tissues, microwave methods have the potential to discriminate between cancerous growths and healthy or benign tissues. Unlike mammography, microwave techniques do not use ionizing radiation and thus breast scans can safely be performed frequently, making them excellent candidates for diagnostic breast screening. Microwave techniques are typically categorized into two subtypes: microwave radar and microwave tomography. These techniques can be performed with physical measurements in either the time or the frequency domain. Time-domain recordings allow collection of data over a wide frequency band with one pulse, allowing for potentially faster recordings; however, they suffer from poorer signal to noise ratios (SNR) than frequency domain methods. In recent research on microwave breast cancer detection, multiple experimental systems have evolved to the stage of clinical measurements. Such studies involve performing breast scans on women, either healthy volunteers or those who have been diagnosed with breast cancer. In our work, we use a time-domain radar system for breast health monitoring. The longterm aim of the research is a device for breast monitoring as an early warning indicator for cancer that uses several metrics to assess breast health. Such an application would be of particular use with patients who are at high risk of developing breast cancer.
Related Works
In previous studies, we have presented an initial clinical prototype for feasibility tests [1-3], This table-based prototype was composed of a radome with embedded antennas. During a scan, patients lay on the table in the prone position with their breast in the radome. Using the table-based prototype, we performed breast scans on a volunteer daily over the course of one month [4,5]. This study helped identify avenues towards an improved prototype. Namely, we now aim to develop a prototype that does not require the table setup, thus making it more portable and compact. A more cost effective solution is also beneficial, in order to enable wider accessibility. The dielectric properties of the skin can be significantly higher than the internal breast tissues [6-8], generating unwanted reflections and multipath effects. These skin reflections need to be sufficiently suppressed in both monostatic and multistatic radar data in order to correctly image targets from within the breast. The scattering effects of the skin are commonly filtered using a calibration signal, often approximated by number of recorded signals which experience similar skin propagation as well as exhibiting sufficiently varying internal breast scattering [9,10].
Previous skin calibration methods have filtered the skin reflection via a time window [11-18]. The skin can be temporally isolated from the target within monostatic signals but this is not the case in a multistatic measurement system, as the tumour scattering can be masked by reflections from the skin and inter-antenna coupling [19]. Monostatic transducers can be freely repositioned around the breast to generate sufficient similar skin channels to aid in the calibration process [20]. Within a multistatic array, however, the number of TX-RX channels which undergo similar skin propagation and inter-element coupling effects are often limited since the array density is dictated by the size of the antenna elements. This limitation has prompted the use of differential offset imaging with multistatic scenarios in the literature; two scans of the same breast are performed where the array is rotated between scans [10,19].
Proposed Methodology
A description of the new, wearable prototype is provided. The system operates based on the multi static radar principle. A short-duration pulse (with frequency content in the 2-4 GHz range) is generated on each clock cycle. It is then amplified and transmitted, through a switching matrix, to a transmitting antenna. The system is composed of a 16-element wideband antenna array, which surrounds the breast under test. The wave propagates through the breast tissues, scattering at each interface of different tissue types. The resulting scattered wave is collected at each of the 16 receiving antennas in turn. An equivalent-time sampling oscilloscope (‘picoscope’) is used to record the data, which is stored digitally. The switching matrix then changes the transmitting antenna, and the recording process is repeated until all possibilities have been cycled through. A schematic of the measurement setup and its proposed methodology overview is provided in Figure 1.

Figure 1: Methodology block diagram of cancer cell detection.
In this work, a wearable prototype is fabricated using the monopole antennas. In particular, the wearable prototype is composed of a 16-element antenna array, embedded in model. The antennas are distributed asymmetrically around the bra surface, to reduce imaging artifacts that can be induced by a symmetric array. The antennas are located such that they are on the inside of the model and will thus contact the skin. The signal can be acquired by Efficient DR-DAQ system. This arrangement removes any uncertainty regarding the breast position relative to the array.
Signal Calibration Using Neural Network Technique (SCNN)
The proposed signal processing technique is outlined in Figure 2. Multiple scans are performed on the same breast where the entire M element array is repositioned via rotation between scans. Now there are N(M × (M-1))/2 recorded channels available for beam forming, where N is the number of scans. The recorded data for a particular array position scan n is denoted by Xn, whose columns Xijn contain the recorded scattering at RX j when the breast is illuminated by TX i. In this section we open by describing the NN based signal calibration technique to isolate the scattering response from inside the breast.
Signal reflections and mutual coupling must be suppressed in each multiple signal path X(i,j,n) to extract the scattering response from the internal breast tissue. At each repositioning of the fixed-element array, we assume that the geometrical arrangement results in consistent antenna coupling effects and skin propagation among corresponding TX-RX signals, i.e. between X(i,j,1), X(i,j,2),........ X(i,j,N). Other TX-RX signals from intra-scan data may experience similar coupling and skin scattering, particularly if they are geometrically similar to another stable signal arrangement in the array, e.g. a pair of stable signal paths whose antennas exhibit similar relative polarizations and phase centres are equidistant. These intrascan signals and the corresponding signal pairs present in the other N-1 scan positions are collated into a group,that correspond to the grouping stage in Figure 2. The goal of group based signal processing, which directly operates on the acquired reflected signal and the actual transmitted signal on breast model. The signal processing sequence, Called Grouped Filtering is applied in order to improve the signal strength of the reflected signals. First, we correlate the reflected raw signal Araw with the Grouped Filter signal GF. The GF is the frequency based waveform to be expected at the DR-DAQ receivers. The applied GF correlation has a length of few samples and by a time reversal of the GF samples which converts the correlation into a convolution.
AGF=GF*ARAW

Figure 2: Proposed SSNN technique.
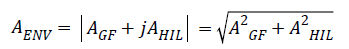
In the second step, we generate the signal envelope AENV of the Group filtered signal AGF by taking the absolute value of the complex analytic signal.
AENV=|AGF+jAHIL|
Therefore, we convolute the input signal AGF with a special set of HIL coefficients, in order to generate the approximated Hilbert Transform.
AHIL=HIL*AGF
Per definition, the result AHIL is then taken as the imaginary part and AGF as the real part of the analytic signal. The absolute value of this signal is a good approximation of the envelope signal AENV.
In the next step, we reduce the envelope signal AENV to its local maxima APEAK by comparing each sample value with its adjacent signal values. Here, the signal values at peaks are retained and all other samples are set to zero.
APEAK=localmax(AENV)
Finally, we convolute with an Optimal Pulse OP in order to produce the output signal AOP. The final convolution shapes the output signal optimally for the subsequent NN signal calibration.
AOP=OP*APEAK
Our goal is to develop an automatic NN classification algorithm that mimics the tumor cell analysis decision whether a tumour is benign or malignant based only on the transmitted and reflected a training image set with the corresponding biopsy decisions. The standard procedure to train a classifier is based on a given set of training data with corresponding true labels. The classifier learning procedure finds a classifier whose class predictions are most similar to the correct labels that are provided along with the training data. The main difficulty in our training algorithm is that we do not have direct access to the signal-level decisions. We approach the benign/ malignant decision task, based on the two views, as a EM two step procedure.
SCNN procedure
Input: pairs of feature vector (x1,cc, x1,mlo), …, (xn,cc, xn,mlo) with corresponding binary labels z1, …, zn.
Output: model parameters wcc, wmlo and θ.
The EM Algorithm iterates between the two steps:
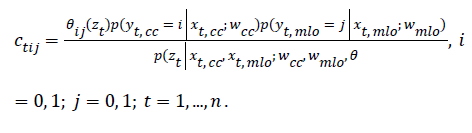
E-step: For every mammography-pair data (xt,cc, xt,cc) compute:
M-step:
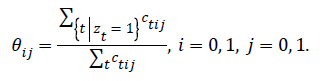
Update the view fusion parameter θ:
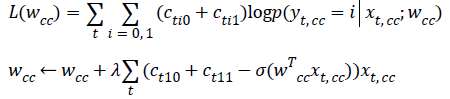
Apply gradient ascent to find wcc that maximizes:
Apply gradient ascent to find wmlo that maximizes:
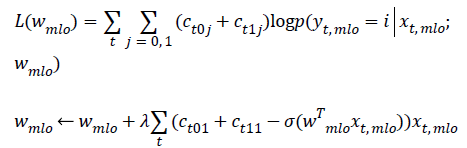
In this work, we use a month-long measurement period as the basis for our investigation. We perform daily measurements on a healthy volunteer over the course of one menstrual cycle in order to verify the repeatability of measurements and to quantify the level of variation that the microwave system records in response to healthy tissue fluctuations. We conducted daily measurements on the volunteer with the SSNN-based wearable prototype.
Results and Discussion
In this section, the data is examined directly based on the collected signals. First, we compare the received signal amplitudes from all transmit-receive antenna pairs of the table-based prototype and the wearable prototype. The data sets are obtained from breast scans of the right breast of the same volunteer. For all scans with both prototypes, the signal amplitude fed into the transmit antenna was constant.
From the plots in Figure 3, we see that the signal trends are similar for each visit. In order to explore the removal of the direct pulse, surface wave, and skin reflection, Figure 3 also plots two difference signals. The difference between the signal from the given antenna pair for two volunteer scans (S2 and S1) is shown, along with the difference between S2 and the ultrasound signal scan (US). In both cases, the early-time signal is significantly reduced. The two difference signals are also closely matched in amplitude. Similar results are found for the other antenna pairs. The monitoring application by its design involves system calibration using patient scans. However, at the onset of the screening history, in the absence of earlier scans, calibration with ultrasound gel scans can remove the majority of unwanted signal content.

Figure 3: Sample plots of aligned collected signals for each of the six visit.
A summary chart is presented in Table 1, where the number of antenna pairs that result in collected signals above three threshold values (250 mV, 200 mV, and 100 mV) is listed. These particular threshold values are chosen arbitrarily as an example. High-amplitude signals can be used as an indicator of the system performance: with the same input signal, higher outputs represent lower overall path losses (due to any or all of: less attenuation, fewer interfaces for scattering, improved matching, better antenna efficiency, etc.). As can be seen from Table 1, the wearable prototype leads to more antenna pairs with high amplitude signals for all three thresholds.
| >250 mV | >200 mV | >100 mV | ≤ Noise | |
|---|---|---|---|---|
| Table-Based | 6 | 16 | 48 | 16 |
| Wearable | 8 | 23 | 51 | 0 |
Table 1: Comparison of the number of antenna pairs recording high amplitude signals and antenna pairs with amplitude at or below noise level.
To evaluate the effectiveness of the proposed algorithm is written in MATLAB to generate the results of different materials used in our experiment as tumour. Figure 4 shows the measurements of the received signal response when the antenna subjected in the normalized signal.

Figure 4: Skin propagation characteristics.
We evaluated the algorithm performance using Receiver Operator Characteristic (ROC) curves, calculating area under the curve (AUC) and using the classification accuracy, sensitivity and specificity measures. We examined our classifier performance on the rotation invariant Curvelet features. Due to differences in nature of the two types of breast tissue (Fatty/Dense), different network architecture was required for each type, and therefore each breast tissue category was evaluated separately. Figure 5 shows the ROC curves of the five classifiers we compared using the rotation invariant Curvelet features on one train-test split from the fatty tissue. The Table 2 shows how cancer cells size evaluated from existing and proposed signal (SSNN) to the actual size of the cells. The SSNN methods applied to the collected data to avoid the shortcomings of classical methods.
| Cancer Cell | Existing Accuracy Values | Proposed Accuracy values |
|---|---|---|
| 1 mm | 2.063 | 4.927 |
| 2 mm | 3.136 | 5.917 |
| 3 mm | 4.5215 | 7.927 |
| 4 mm | 5.274 | 8.17 |
| 5 mm | 5.921 | 8.913 |
Table 2: Statistical values of existing and proposed algorithm based signal for different size of cells.

Figure 5: Measured sensitivity parameters.
Conclusion
This work has introduced a clinical prototype for NN based microwave breast cancer detection. The prototype has a wearable interface, i.e., a bra that contains the antenna array. The wearable prototype is worn with the antennas directly contacting the skin, eliminating the need for a noisy medium, and giving precise knowledge of the position and size of the breast surface relative to the array. The system breast interface of the wearable prototype is highly cost effective compared to existing systems. We have performed signal processing with the SSNN technique based wearable prototype and showed the results for various categories. Future work, along the direction of system improvement, includes integration of other hardware components, a model with a wider coverage area and reduced scanning time. Further, we will expand clinical testing to a wider range of healthy volunteers (with varying breast size and density) as well as breast cancer patients.
References
- Bray F, McCarron P, Parkin DM. The changing global patterns of female breast cancer incidence and mortality. Brest Cancer Res 2004; 6: 229-239.
- Jemal A, Bray F, Center MM, Ferlay J, Ward E, Forman D. Global cancer statistics. CA Cancer J Clin 2011; 61: 69-90.
- Speirs V, Shaaban AM. The rising incidence of male breast cancer. Breast Cancer Res Treat 2009; 115: 429-430.
- Schreer I, Luttges J. Breast cancer: Early detection. In: Radiologic- Pathologic Correlations from Head to Toe, 2005, Springer, Berlin.
- Bleyer A, Welch HG. Effect of three decades of screening mammography on breast-cancer incidence. N Engl J Med 2012; 367: 1998-2005.
- Cheng HD. Automated breast cancer detection and classification using ultrasound images: A survey. Pattern Recog 2010; 43: 299-317.
- Morrow M, Waters J, Morris E. MRI for breast cancer screening, diagnosis, and treatment. Lancet 2011; 378: 1804-1811.
- Elmore JG, Armstrong K, Lehman CD, Fletcher SW. Screening for breast cancer. JAMA 2005; 293: 1245-1256.
- Saslow D, Boetes C, Burke W, Harms S, Leach MO. American Cancer Society guidelines for breast screening with MRI as an adjunct to mammography. CA Cancer J Clin 2007; 57: 75-89.
- Elmore JG, Barton MB, Moceri VM, Polk S, Arena PJ. Ten-year risk of false positive screening mammograms and clinical breast examinations. N Engl J Med 1998; 338: 1089-1096.
- Paramkusham S, Rao KMM, Prabhakar Rao BVVSN. Early stage detection of breast cancer using novel image processing techniques, Matlab and Lab view implementation. 15th International Conference on Advanced Computing Technologies (ICACT), 2013.
- Ganesan K, Acharya UR, Chua CK, Min LC, Abraham KT, Ng KH. Computer-Aided Breast Cancer Detection Using Mammograms: A Review. IEEE Rev Biomed Eng 2013.
- Azeemi MA, Zafar N, Zafar MF, Naqvi SA. Early Stage Breast Cancer Detection through Mammographic Feature Analysis. 5th International Conference on Bioinformatics and Biomedical Engineering, (iCBBE), 2011.
- Shareef SR. Breast Cancer Detection Based on Watershed Transformation. IJCSI Int J Comput Sci Issues 2014.
- Basha SS, Prasa KS. Automatic detection of breast cancer mass in mammograms using morphological operators and fuzzy c -means clustering. J Theor Appl Inform Technol 2005.
- Lo SC, Li H, Wang Y, Kinnard L, Freedman MT. A multiple circular path convolution neural network system for detection of mammographic masses. IEEE Trans Med Imaging 2002; 21: 150-158.
- Zheng L, Chan AK. An artificial intelligent algorithm for tumor detection in screening mammogram. IEEE Trans Med Imaging 2001; 20: 559-567.
- Patel VK, Uvaid S, Suthar AC. Mammogram of Breast Cancer detection Based using Image Enhancement Algorithm. Int J Emerg Technol Adv Eng 2012.
- Abbosh AM, Bialkowski ME, Crozier S. Investigations into optimum characteristics for the coupling medium in UWB breast cancer imaging systems. Antennas Propagat Soc Int Symposium 2008.
- Heine JJ, Deans SR, Cullers DK, Stauduhar R, Clarke LP. Multiresolution statistical analysis of high-resolution digital mammograms. IEEE Trans Med Imaging 1997; 16: 503-515.