Research Article - Environmental Risk Assessment and Remediation (2021) Volume 5, Issue 7
Vulnerability assessment of traditional fish-cum paddy cultivation of the Apatani tribe of Arunachal Pradesh, India.
Pritom Saikia1, Kesar Chand1*, Jagdish Chandra Kuniyal2 and Mahendra Singh Lodhi1
1GB Pant National Institute of Himalayan Environment, North East Regional Centre, Itanagar, Arunachal Pradesh, India
2GB Pant National Institute of Himalayan Environment, Kosi-Katarmal Almora, Uttarakhand, India
- Corresponding Author:
- Kesar Chand
G.B Pant National Institute of Himalayan Environment India
Telephone: 09418552648
E-mail: kesar1982@gmail.com
Accepted date: September 21, 2021
Citation: Saikia P, Chand K, Kuniyal JC, Lodhi MS. Vulnerability assessment of traditional fish-cum paddy cultivation of the Apatani tribe of Arunachal Pradesh, India. Environ Risk Assess Remediat. 2021;5(7):1-7.
Abstract
Climate change is affecting human lives in many ways including food security. This study investigated the vulnerability of the traditional paddy cum fish cultivation of Ziro valley of Arunachal Pradesh to climate change and land use pattern. Rainfall and Land Surface Temperature (LST) trends in the past three decades along with land use patterns were evaluated to assess vulnerability. The results revealed a decrease in the rainfall amount and the number of rainy days and a significant increase in LST. Moreover, land use patterns in the region were unplanned and degraded the paddy cum fish cultivated lands. Capacity building, awareness programmes, and smart adaptive measures can be implemented to make the community climate smart.
Keywords
Climate Change, Vulnerability, Cultivation, Rainfall, Temperature.
Introduction
The Earth’s climatic condition is undergoing significant alterations because of increasing population, pollution, deforestation, and land use changes, thus considerably affecting world food security. Climate change is expected to substantially hit the agricultural sector in South Asia [1]. An increase of 1°C in average temperature may reduce the yield of cereal crops in South Asia by 4%-10% [2]. The Intergovernmental Panel on Climate Change (IPCC) projected that the temperature in South East Asia would increase between 0.5 and 3°C by the end of the 21st century. This increase in temperature would significantly increase the risk of food security in developing nations. The wide variation in spatiotemporal rainfall patterns negatively affects the agricultural sector throughout the world. Crop growth, development, water use, and yield are largely determined by weather parameters, such as rainfall and temperature. Minor deviations from the normal weather severely impairs the efficiency of agricultural production. These changes are more evident at hilly areas where changes in altitudes result in variations in biodiversity and agriculture lands and shallow soils are limited [3].
Agriculture is the primary source of livelihood in India, employing more than 50% of the Indian workforce. Climate change and extreme events have become major concerns for the Indian agricultural sector. Several studies have revealed that India is demonstrating an increasing trend in Land Surface Temperature (LST) and an increasing or decreasing trend in rainfall at regional scales [4-8]. Climatic conditions are more inconsistent in the Himalayan region where land use patterns are changing more markedly because of increased population, urbanisation, and developmental activities. Climate changeinduced disasters, such as landslides, flood, flash floods, and droughts, adversely affect the Indian agricultural system.
According to the fourth assessment report published by the IPCC, climate change-induced disasters have imposed significant stress on habitat and agriculture [9].
The Indian Himalayan Region (IHR) is a global biodiversity hotspot and responsible for regulating climate in the entire south Asian region [10]. The Himalayan ecosystem is sensitive to climate change, and these changes threaten the livelihood of the indigenous population [11]. Agriculture in the IHR is mainly dependent on monsoonal rainfall. The decrease in agricultural production and other natural resources caused by climate change can significantly affect the IHR, particularly the eastern state of Arunachal Pradesh because the majority of the mountainous population depends on agriculture and forest resources for their livelihood [12]. Arunachal Pradesh is highly vulnerable to climate change owing to the high use of natural resources, low crop insurance, and dependency on rain-fed agriculture in this state.
The Apatani group of people in the Eastern Himalayan region are known for the sustainability of their wet rice cultivation and land use management through well-designed traditional institutions. The Apatani people engage in age-old valley rice farming and are thus often considered as one of the advanced tribal communities in the north-eastern region of India. The Apatanis are known for their rich economy for decades and favourable understanding of land, forest, and water management [13]. The eco-friendly techniques of Apatani agro ecosystems differ from shifting cultivation practiced in northeast India [14]. Traditional forestbased natural resource management and conservation practiced by the Apatani community is unique in upland India [15]. They have significant knowledge regarding land and water resource management. The indigenous integration of pisciculture in valley rice cultivation is a distinct characteristic of the Apatani agro ecosystem, which is unique in itself.
The Apatani tribe mainly depends on wet rice cultivation, unlike the other tribes of Arunachal Pradesh who traditionally depend on forest resources. Wet rice cultivation is practiced in small terraces throughout the flat valley land in and around Ziro and Hapoli in the upper course of Kiile River. Soils in the valley are considerably fertile due to the deposition of nutrients washed out from the surrounding hill slope. Apart from rice, they also grow millets and maize along with many locally available vegetables. A total of 16 varieties of rice are cultivated by the Apatani community [16]. These agricultural lands are irrigated by trapping water in the foothills of the valley and channelling the trapped water to fields through a main canal. Water is then distributed through small canals such that every plot of land receives an adequate supply of irrigated water for paddy cultivation and fish farming. Surplus water is drained back to the main canal without any loss of soil nutrients. To prevent soil erosion from the main canal, bamboo fencing and plantations are installed to limit the flow of water. The availability of surplus water has benefited fish cultivation within paddy fields in a unique manner. This approach has led to double cropping (i.e. fish cum paddy simultaneously) in the same land without any additional requirements.
Climate change coupled with increased population and rapid urbanisation has led to the degradation of age-old traditional practices. The increase in air and land temperature along with irregular rainfall patterns has made the traditional fish cum paddy cultivation vulnerable. Moreover, increased population and urbanisation has resulted in significant changes in land use patterns. Crop production is expected to decrease by 10%-40% in India during 2008-2100 due to climate change [17].
This study primarily aimed to examine the trends of climatic parameters and, evaluate land use patterns in Ziro valley and vulnerability of old age practice of fish cum paddy cultivation.
The Study Region
The Ziro Valley is located in northeast India between 93.76°E and 94.00°E and between 27.42°N and 27.65°N of the Lower Subansiri district in the central western part of Arunachal Pradesh Shown in given (Figure 1). The Ziro valley, also known as Apatani valley, lies at an altitude of 1524 m-2738 m above sea level. The study area is demarcated using the Survey of India (2011) topographical map number 83 E/14, and the total study area is 132 km2. The valley has a humid subtropical to temperate type of climate and receives 235 cm of annual rainfall. Its temperature ranges from 6.3°C to 28.1°C during summer and from 1.9°C to 18.4°C during winter. In 2011, 2012, and 2013, the minimum temperature fell down to -3°C, -4°C, and -9°C respectively. The soils of the valley are humid black and reddish in colour and developed from gneiss and schist overlaid on a wide area with older alluvial deposits. Geologically, the valley falls under the Lesser Himalayan part, and the rocks in the region belong to Hapoli formation and are considered to represent lacustrine deposits in inland basins [18]. The valley comprises gneiss, schist, phyllites, and quartzite.

Figure 1: Location map of the study area.
The Ziro valley is a focal point of attraction because of its unique land use pattern, resource management, and conservation culture [14]. It is the district headquarters of Lower Subansiri and is popularly called as the ‘Rice Bowl of Arunachal Pradesh’. The valley is well known for its unique and intensive fish-paddy cultivation in the hill agrosystem [19], which is a low input and eco-friendly practice [20]. This valley has a unique water management system where they develop a temporary aquatic system for fish and rice production simultaneously [21,22]. The availability of water plays a crucial role in the production of both rice and fish [23,24]. However, in the present scenario of climate change, the alarmingly rising global temperature with frequent extreme weather events are adversely affecting the agricultural sector globally. This study examined the effects of climate change and changing land use patterns on traditional fish-paddy cultivation in Ziro valley.
Data Source and Methodology
Land use and land cover mapping
Land use mapping was performed using a semiautomatic approach with QGIS software. The semiautomatic classification plugin is an open-source plugin for QGIS that allows the supervised classification of satellite images [25].
To obtain required information from satellite images, we systematically performed pre-processing and interpretation. The cloud-free Landsat scene was obtained from the USGS Earth Explorer of the year 2021. The image was classified into five land use/land cover classes: water body, forest cover, builtup area, agricultural land, and barren land (Table 1).
| LULC Types | Description |
|---|---|
| Water body | Areas covered with water bodies such as lakes and rivers |
| Forest Cover | Areas covered with trees growing close together |
| Builtup Area | Areas that have been populated with human settlements |
| Agricultural Land | Areas covered with crops |
| Barren Land | Areas exposed with rocks, soil, or sand. |
Table 1. Description of land use/land cover classes identified in the study area.
Raw downloaded images were initially pre-processed before classification. Dark-object subtraction atmospheric correction was applied. Subsequently, the image was converted into surface reflectance. Training sites were identified using the visual interpretation and semiautomatic approach. Once the training sites were identified, the maximum likelihood classification was utilised. The post interpretation phase included the preparation of land use maps and the calculation of land use statistics.
Trend analysis of climatic parameters
Secondary data regarding different climatic variables were collected from various available sources. Historical rainfall data over a period of 30 years (1990-2020) were collected from Climate Hazards Group Infrared Precipitation with Station (CHIRPS) data. The CHIRPS is a 30+ year quasi-global rainfall dataset. CHIRPS incorporates 0.05° resolution satellite imagery with in-situ station data to create gridded rainfall time series for trend analysis and seasonal drought monitoring.
LST data were downloaded from Climate Engine for the past 30 years (1990-2020). Climate Engine is a web-based application that enables users to process, visualise, download, and share climate and remote sensing datasets with a simple web connection, thereby overcoming common big data barriers [26]. Climate Engine provides LST datasets derived from Landsat satellites with 30 m spatial resolution.
Trends in the data were identified using the widely used parametric and nonparametric methods. Nonparametric methods do not require the normality of time series and are less sensitive to outliers and missing values. Moreover, nonparametric methods are widely used to analyse trends in several hydrologic series (e.g. rainfall and temperature) [27-30]. In our study, the nonparametric Mann-Kendall (MK) method was used for identifying trends in rainfall days and LST [31]. The MK test is one of the most widely used nonparametric methods and is based on the test statistics S, which is defined as follows:
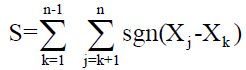
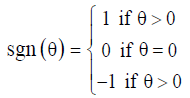
where n is the number of observations and xj is the jth observation and sgn(-) is the sign function that can be defined as follows:
Under the assumption that data are independent and identically distributed, the mean and variance of the S statistic are given by the following expressions:
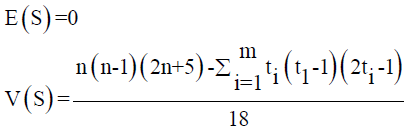
where m is the number of groups tied ranks, each with ti tied observations.
The MK statistic, designated by Z, can be computed as follows:
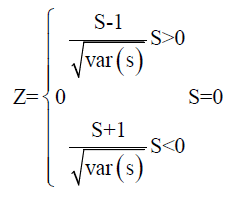
Positive Z values indicate increasing trends, whereas negative Z values indicate decreasing trends in the time series. When |Z| > Z 1-α/2, the null hypothesis is rejected and a significant trend exists in the time series. Z 1-α/2 is the critical value of Z from the standard normal table, and a 5% significant level of Z 1-α/2 is 1.96.
Results
Land use and land cover
Land cover is defined as physical features observed on the Earth’s surface. When a human intervention is added to land cover, it becomes land use (Figure 2). In the present study, we used the multispectral images of the Landsat-8 satellite for the year 2021 for land use and land cover mapping. The five classes, namely water body, forest land, agriculture land, built-up area, and barren land, were mapped using the visual interpretation technique (Table 2).

Figure 2: Land use/land cover map of Ziro Valley.
| Serial No | Landuse type | Area in km2 | Percentage |
|---|---|---|---|
| 1 | Water body | 0.74 | 0.56 |
| 2 | Forest land | 102.99 | 78.02 |
| 3 | Agriculture land | 17.8 | 13.48 |
| 4 | Builtup area | 4.37 | 3.31 |
| 5 | Barren land | 6.09 | 4.61 |
Table 2. Land use statistics of Ziro valley in 2021.
The land use classification showed that 78.02% of the total area is covered by the forest area, followed by agricultural land (13.48%), barren land (4.61%), and built-up area (3.31%). The area contains the least proportion of water bodies (0.56%). Table 2 provides the details of land use statistics.
Trend in rainfall
The daily rainfall data obtained from the CHIRPS were used to compute seasonal and annual trends and variations in rainfall days. The statistical parameters of the total seasonal rainfall and number of rainy days (i.e. mean (M), standard deviation (S), and coefficient of variation (Cv) were calculated to describe the characteristics of rainfall over the study area. The average annual rainfall and the number of rainy days were 1821 mm and 93 days, respectively, for the period from 1990 to 2020. The average number of rainfall days in the monsoon season was 53 days. Data from the past 30 years revealed that the premonsoon and monsoon rainfall contributed approximately 23% and 67%, respectively, to the total annual rainfall. The Cv of annual rainfall days was 12.01%, and the Cv of rainy days in the monsoon season was 17.32%. Furthermore, the Cv of the total annual rainfall and monsoon rainfall were 10.54% and 14.83%, respectively. The variability in both rainy days and the amount of rainfall was relatively higher during the monsoon season (Figure 3).

Figure 3: Anomaly in monsoon rainfall in Ziro valley during the past three decades. No significant anomaly was observed in the annual number of rainy days during the past 30 years. Only one year (2010) had an excess number of rainy days and two years (2013 and 2014) had a lower number of rainy days.
The anomaly in monsoon rainfall and annual rainy days were examined using the CHIRPS rainfall data for three decades (Figure 4). An anomaly was observed when the increase or decrease in the percentage exceeded by 19% from the average value [32]. During the considered period, the Ziro valley experienced six deficient (1992, 1996, 1997, 2005, 2016, and 2020) monsoon and one excess (1990) monsoon (Figure 5). These findings indicated that both excess and deficient rainy days were experienced during the past 30 years. However, the number of years with deficient rainy days was higher than that with excess rainy days.

Figure 4: Anomaly in annual rainy days in Ziro valley during the past three decades. The trends in rainfall during the past 30 years at Ziro valley were calculated using the MK test. The Z-statistic was obtained for annual rainfall, seasonal rainfall, and the number of rainy days.

Figure 5: Trends of rainfall at Ziro valley during 1990-2020; (a): the graph shows premonsoon, monsoon, and annual rainfall; (b): winter and post monsoon rainfall, and (c) the total number of annual rainy days.
As shown in (Table 3), decreasing trends in rainfall were observed using the MK test. A significant decrease in the annual rainfall amount was observed with the lowest Z value of -1.84. The negative Z values in all the seasons indicated a decrease in seasonal rainfall. The winter rainfall at Ziro valley showed a decreasing trend with a Z value of -1.43. The analysis revealed a decreasing trend in premonsoon, monsoon, and post monsoon rainfall at Ziro valley. The respective Z values of premonsoon, monsoon, and postmonsoon rainfall were -0.41, -1.39, and 1.05. The decreasing trend for premonsoon was lower than that for two other seasons and annual rainfall.
| Annual Rainy Days | Total Annual Rainfall | Winter | Pre Monsoon | Monsoon | Post Monsoon |
|---|---|---|---|---|---|
| -0.51 | -1.84 | -1.43 | -0.41 | -1.39 | -1.05 |
Table 3. Z values obtained using the MK test for the annual number of rainy days, total annual rainfall and seasonal rainfall.
Trend in LST
The mean LST in Ziro valley determined from Landsat satellites was utilised in the present study. The trend in LST was analysed using the MK test. Data from the past three decades showed a positive trend with a Z value of 0.68. A significant increase in LST was observed during the past three decades (Figure 6). The average LST recorded during the considered period was 13.34°C, and the years 2014 and 2015 had the highest LST. The mean LST in 2014 and 2015 was higher by 1.6°C than the average of three decades. As depicted in Figure 5, a significant increase in LST was noted between 1990 and 2020 (R2=0.405).

Figure 6: Trend in mean land surface temperature in Ziro valley during 1990-2020.
Discussions and Conclusions
Mapping of LULC using satellite data and the semiautomatic approach is an efficient method for determining land use patterns. In the present study, forest land was found to be the most dominant LULC category comprising 78.02% of the area. By contrast, the study area had only 0.74 km2 of water bodies. The deficiency in water bodies has made the traditional paddy cum fish cultivation in Ziro valley vulnerable. Moreover, the area has only a small river (i.e. Kille river) flowing through it; this river is the only source of water for paddy fields. The construction of an artificial lake named Sikhe lake in the area is an adaptive measure that has proven to be beneficial because of its water storage capacity. The lake has been storing water from springs in surrounding hills and maintaining the water demand in the region. However, additional water conservation techniques should be adopted by the people of the region to tackle the future scarcity of water.
Rice cultivation is the primary agriculture of the people in the region. The study area is covered by 17.8 km2 of agricultural land, accounting for 13.48% of the total area. Apart from rice, kiwi, millets, maize, and seasonal vegetables are major crops grown in the region.
LULC mapping indicated the presence of a significant barren land in the region. Barren land occupies 6.09 km2 of the total area, which is relatively high in the region. These barren lands are mostly identified in hills used for shifting cultivation and mining activities. The built-up area was observed between agricultural lands that is vulnerable for traditional paddy cum fish cultivation. Human settlements and other activities, such as mining, are occupying the existing paddy fields, leading to the degradation of the paddy cum fish cultivation.
The analysis of climatic parameters indicated an impending threat to the paddy cum fish cultivation. The decrease in annual rainy days and rainfall amount in all the seasons has made the region vulnerable to climate change. Because agriculture is the major source of livelihood of people in Ziro valley, the decreasing trend in rainfall poses a major threat to people. Smart adaptive measures such as water conservation and sustainable resource utilisation must be adopted by people to cope with the decreasing rainfall. Rainwater harvesting and spring water utilisation must be promoted in the region.
The LST in the region showed an increasing trend in the past three decades. The increase in the LST leads to the loss of soil moisture, thus reducing the crop yield. An increase in settlements and human activities and a decreasing trend in rainfall have caused an increase in LST.
To sustain the traditional paddy cum fish cultivation, a strategic plan should be introduced for the Apatani community. Communities should be made aware regarding coping with the changing climate and land use planning. Active community participation and strategic planning can make the community resilient to climate change through the implementation of smart adaptive measures.
References
- Field CB, Barros VR. Climate Change 2014-Impacts, adaptation and vulnerability: Regional aspects. Cambridge University Press. 2014.
- Aryal JP, Sapkota TB, Khurana R, et al. Climate change and agriculture in South Asia: adaptation options in smallholder production systems. Environ Dev Sustain 2020; 22: 5045-75 .
- Isaac RK, Isaac M. Vulnerability of Indian Agriculture to Climate Change: A Study of the Himalayan Region State. Int J Agric Biol . 2017;11:236-42.
- Srivastava HN. Decadal trends in climate over India. Mausam. 1992; 43:1
- Kumar RK, Kumar KK, Pant GB. Diurnal asymmetry of surface temperature trends over India. Geophys. Res. Lett. 1994; 21: 677-80
- De US, Mukhopadhyay RK. Severe heat wave over the Indian subcontinent in 1998, in perspective of global climate. Curr. Sci. 1998; 75: 1308-11.
- Pant GB, Kumar RK. Borgaonkar HP. Climate and its long-term variability over the western Himalaya during the past two centuries. The Hima. Environ . 1999; 171-84.
- Singh N, Sontakke NA. On climatic fluctuations and environmental changes of the Indo-Gangetic plains, India. Clim. Chang . 2002; 52:287-13.
- Parry M. Climate change 2007-impacts, adaptation and vulnerability: Working group II contribution to the fourth assessment report of the IPCC (4). Cambridge University Press. 2007.
- Maikhuri RK, Community response and adaptation to climate change in Central Himalaya, Uttarakhand, India. In Tropical Ecosystems: Structure, Functions and Challenges in the Face of Global Change . Springer, Singapore. 2019; pp. 213-31.
- Bui Y, Lodhi MS, Chand K, et al. Public Awareness, Concerns and Perceptions about Anthropogenic Impacts and Climate Change in Ranganadi River Basin, Arunachal Pradesh, India. IJESNR. 2020; 26: 148-54.
- Ramakrishnan PS, Scientific basis of traditional wet rce cultivation by North-East India hills tribes. Trends in Agrarian Structure in the Hills of North_East India, Commonwealth Pulblishers, New Delhi. 1997; 233-47.
- Choudhuri RG. Rice based farming of Aptani-an efficient indigenous system of hill farming. Indian J. Hill Farming. 1993; 6:1-18.
- Kumar A, Ramakrishnan PS. Energy flow through an Apatani village ecosystem of Arunachal Pradesh in northeast India. Hum. Ecolo. 1990; 18:315-36.
- Sundriyal RC. Dollo M. Apatani cultural landscape: integrated natural resource management and community development-towards local asset-building and transformations. In 9th International Congress on Ethnobiology, Social Change and Displacement. 2004. (Vol. 13).
- Kala CP, Dollo M, Farooquee NA, et al. Land-Use Management and Wet-Rice Cultivation (JebiAji) by the Apatani People in Arunachal Pradesh, India: Traditional Knowledge and Practices. Outlook Agric. 2008; 37: 125-29.
- Aggarwal PK. Global climate change and Indian agriculture: impacts, adaptation and mitigation. Indian J Agric Sci. 2008; 78: 911.
- Saikia SK. Das DN. ‘Ajignuiassonii’-a practice of organic hill farming among the Apatani tribe of Eastern Himalaya. Int J Sustain Dev World Ecol. 2004; 11:211-17.
- Noorhosseini-Niyaki SA, Bagherzadeh LF. Ecological and biological effects of fish farming in rice fields. In Regional Congress of Sustainable Management Science-based in Agriculture and Natural Resources. Gorgan University of Agricultural Sciences and Natural Resources, Iran. 2013; pp. 21-22.
- Al-Shami SA, Che SMR, Siti AMN, et al. The influence of routine agricultural activities on the quality of water in a tropical rice field ecosystem. Appl Ecol Environ Res. 2009; 8: 11-18.
- Bahaar SWN, Bhat GA. Aquatic biodiversity in the paddy fields of Kashmir valley (J and K) India. Asian J Agric Res. 2011; 5: 269-76.
- Bambaradeniya C, Edirisinghe JP, Silva DND, et al. Biodiversity associated with an irrigated rice agro-ecosystem in Sri Lanka. Biodivers. Conserv. 2004; 13:1715-53.
- Saikia SK, Das DN. Rice-fish culture and its potential in rural development: A lesson from Apatani farmers, Arunachal Pradesh, India. J Agr Rural Dev. 2008; 6:125-31.
- Congedo L. Semi-automatic classification plugin documentation Release. 2016; 4: 29.
- Huntington JL, Hegewisch KC, Daudert B, et al. Climate engine: Cloud computing and visualization of climate and remote sensing data for advanced natural resource monitoring and process understanding. Bull Am Meteorol Soc. 2017; 98:2397-410.
- Chattopadhyay S, Jhajharia D, Chattopadhyay G. Univariate modelling of monthly maximum temperature time series over northeast India: neural network versus Yule-Walker equation based approach. Meteorol Appl. 2011;18:70-82.
- Dinpashoh Y, Jhajharia D, Fard AF, et al. Trends in reference evapotranspiration over Iran. J Hydrol. 2011; 399:422-33.
- Fu GS, Chen C, et al. Hydro-climatic trends of the Yellow River basin for the last 50 years Clim Chan. 2004; 65:149-78.
- Yu YS, Zou S, Whittemore D. Non-parametric trend analysis of water quality data of rivers in Kansas. Jour of Hydro. 1993;150:61-80.
- Mann HB, Non-parametric tests against trend. Econometrica. 1945; 33:245-59.
- Tangjang S, Arunachalam A. Role of traditional home garden systems in Northeast India. 2009
- Mooley DA, Parthasarathy B, Sontakke NA. An index of summer monsoon rainfall excess over India and its variability: 1871-1978. Archives for meteorology, geophysics, and bioclimatology, Series B. 1982; 31: 301-11.