Research Article - Journal of Industrial and Environmental Chemistry (2017) Volume 1, Issue 1
Utility of non-steroidal anti-inflammatory for a novel green nano determination of platinum in environmental samples using a cloud point extraction combined with spectrophotometry
Alaa S Amin1*, Nader Hassan21Chemistry Department, Faculty of Science, Benha University, Benha, Egypt
2Chemistry Department, Faculty of Science, Port Said University, Port Said, Egypt
- *Corresponding Author:
- Alaa S Amin
Chemistry Department
Benha University
Benha
Egypt
Tel: +20552350996
E-mail: asamin2005@hotmail.com
Accepted Date: September 26, 2017
Citation: Amin AS, Hassan N. Utility of non-steroidal anti-inflammatory for a novel green nano determination of platinum in environmental samples using a cloud point extraction combined with spectrophotometry. J Ind Environ Chem. 2017;1(1):7-14
Abstract
A new ternary surfactant proposal is studied as an extraction strategy for nano amount determination of platinum using tenoxicam (I) or piroxicam (II) as a selective chromogenic reagent in presence of PONPE 5.0 as nonionic surfactant at pH 3.5 has been developed. The analyte was investigated in the enriched solution by spectrophotometry. After examination and optimization of the complexation and extraction conditions, an enrichment factor superior to 500-fold was achieved with improved sensitivity of 342 and 427 using I and II, respectively, times more than the conventional extraction system using only a nonionic surfactant. In the acetonitrile medium, the molar absorptivity of the complex was 4.89 × 10⁵ and 4.45 × 10⁵ L mol−1 cm−1 at 474 and 482 nm using I and II, respectively. Beer's law is obeyed in the concentration range of 5.0–300 ng mL−1, whereas the optimum range was 15 –275 ng mL−1 using Ringbom method. The relative standard deviation (RSD) for 150 ng mL−1 Pt4+ was 1.67 and 1.32%, respectively. In the original samples, The attained detection and quantification limits amounted to 1.55 and 4.85 using I and 1.42 and 4.50 ng mL−1 using II. The proposed procedure was applied successfully for Pt4+ determination content in environmental samples such as geological, food and waters samples with excellent results.
Keywords
Platinum determination, Spectrophotometry, Non-steroidal anti-inflammatory, Environmental analysis
Introduction
Platinum is mainly used as a catalyst in automobile exhaust catalytic converters, in a wide variety of processes such as petroleum reforming and nitric acid production. Platinum also used in electronic industry as a material for electrodes, contacts and resistance wires and in glass and chemical industries as cladding on account of anticorrosion properties. Another application field of platinum is the manufacture of jewels [1]. Some platinum compounds are used as anti-cancer drugs.
Platinum soluble compounds are very toxic, and industrial exposure is responsible for the syndrome called platinosis. The low levels from the abrasion of the catalytic surface can penetrate deeply into human lungs and are toxicological relevant. Moreover, they are able to prepare various organometallic compounds. In these forms they can be solubilised and enter waters, soils, sediments, and plants, and in consequence, they can enter food chain [2].
Therefore, ultra-sensitive and selective analytical procedures are desirable, since low levels of the metal in the real samples are below the limit of detection of most analytical tolls. Various procedures have been investigated separation and preconcentration of platinum from different matrices, e.g., liquid-liquid extraction [3], co-precipitation with tellurium [4], solid phase extraction [5-7] and cloud point extraction [8-10].
Cloud point extraction (CPE) is one of the most simple and versatile methods for preconcentration and extraction of different metal ions [11] considerable attention was attracted due to complies with the “Green Chemistry” principles [12], as the amount of organic solvent is much less than that of traditional liquid extraction. In addition, it is highly efficient, cheap, fast, simple, and of lower toxicity than those using organic solvents. CPE for metal determination was firstly applied and reported by Watanabe and Tanaka [13]. Since it has been used for preconcentration and separation of many metal ions in different matrices [11]. The mechanism of separation is depended on the clouding phenomena of the surfactant. A micellar solution of a non-ionic surfactant was heated and the surfactant will change from water-soluble to oil-soluble. Above a critical temperature, named the cloud point, it will give completely water insoluble and so, the surfactant molecules will separate out from the aqueous phase. The clear solution gives turbid and phase separation occurs and the homogenous surfactant-rich phase contains much of the surfactant at the cloud point, while the other phase, named aqueous phase, contains mostly water and surfactant monomers at a concentration near its critical micelle concentration (CMC). Some organometallic complexes or hydrophobic compounds initially present in the solution and bound to the micelles can favorably be extracted and concentrated in a small amount of the surfactant-rich phase [11].
In our laboratory, we work on the CPE of many metal ions to preconcentrate, separate, and determine them in different real samples [14-29]. The Goal of the present study was to develop CPE as a preconcentration and separation step for Pt4+ prior to its spectrophotometric determination. In the applied system, I or II was used as the complexing agent and PONPE 5.0 as nonionic surfactant. Potential factors affecting the CPE of Pt4+ were studied in detail. The accuracy was tested by Pt4+ determination in spiked water samples. The developed technique was validated by analyzing Pt4+ in geological, food and water samples.
Experimental
Apparatus
An Orion research model 601 A/digital ionalyzer pH meter was used for checking the pH of solutions. A Perkin-Elmer Lambda 12 UV/Vis spectrometer was applied for recording absorbance spectra with 1.0-cm quartz cell. A water bath with temperature control and a centrifuge with 25 mL calibrated centrifuge tubes (Superior, Germany) were used to accelerate the phase separation process.
Reagents and solutions
All solutions were prepared using ultrapure water obtained by a Milli-Q water purification system (Millipore, Bedford, MA, USA). Analytical grade reagents used were obtained from Sigma-Aldrich (St. Louis, MO, USA) or Merck (Darmstadt, Germany). The laboratory glassware was kept overnight in 10% v/v HNO3 solution. Before the use, the glassware was washed with deionized water and dried in a dust free environment. The standard stock solution (1000 g mL−1) of Pt(IV) was prepared by dissolving an appropriate amounts of Na2PtCl6 in 1.0 M HCl. Working standard solutions were prepared daily from the stock solution by dilution with 1.0 M HCl. Solutions of different pH 2.5-11.5 acetate, phosphate, thiel and universal buffers were prepared as described early [30]. Potassium iodide salt and acetonitrile solvent were purchased from Merck.
Egyptian International Pharmaceutical Industries Company (EIPICO) Egypt, kindly provided tenoxicam and piroxicam, Egypt. A 5 × 10⁻³ M stock solution was prepared by dissolving an appropriate weigh of the solid in minimum volume of glacial acetic acid and is completed to 100 mL with bidistilled water in a 100 mL measuring flask. Acetonitrile solvent and potassium iodide salt were purchased from Merck.
Surfactant PONPE 5.0, (Tokyo Kasei Industries, Chuo-Ku, Tokyo, Japan) 50% (v/v) in ethanol (Sigma Chemical Co.), was employed without further purification.
General procedure
An aliquot of cold Pt4+ standard solution was transferred to a 100 mL polypropylene tube, 5.0 mL of the 5 × 10⁻³ M I or II solution and 10 mL thiel buffer solution of pH 3.5 were added by the Addition of 2.5 mL of 50% PONPE 5.0 solution and 5.0 mL of 0.5 M of KI solution was then added. The total system was placed for 5.0 min in a thermostatic bath at 50°C. The separation of the two phases was obtained by centrifugation for 5.0 min at 3800 rpm using 25 mL calibrated centrifuge tubes. The phases were cooled in an ice bath in order to increase the viscosity of the surfactant-rich phase. The surfactant-rich phase was dissolved and diluted to 0.2 mL with acetonitrile and transferred into a 1.0-mm quartz cell. At 474 or/and 482 nm for I or/and II, respectively, the absorbance was measured. The blank solution was applied to the same procedure without Pt4+ ions.
Interferences study
Different concentrations of ions, which may be present in samples, (1/1, 1/10, 1/50 and 1/100 Pt4+/interferent ratio) were submitted to the test solution containing 150 ng mL−1 Pt4+ and the general above procedure was applied. Tolerance limits were realized in samples without addition of masking or anticoagulant agents.
Accuracy study
Adequate volume of each sample was spiked with increasing amounts of Al3+ (100 and 150 ng mL−1). Analyte concentrations were determined by proposed methodology.
Water samples
Tap, river, brackish, sea and industrial waste water samples used for development of the method were collected in polytetrafluoroethylene containers, filtered using a 0.45 mm Millipore cellulose nitrate membrane to remove the suspended particulate matter, and stored in the dark at 4°C. Tap water was obtained from our laboratory, and river water was collected from river Nile water from Benha City (Egypt). Brackish water was taken from Rasheed Bridge (Egypt). Sea water was collected from Mediterranean sea from Port Said City (Egypt). The domestic wastewater was provided from Port Said Sewage Wastewater Treatment Plant (Egypt).
Geological samples
The rock and road dust samples were obtained and collected from different areas in Geology Department, Faculty of Science, Benha, Egypt. The samples were dried at 90°C for 2.0 h, ground, passed through a sieve of 100 meshes and homogenized. 2.0 g of each sample was accurately weighed in a 100 mL beaker. In order to dissolve, 10 mL of aqua regia was added into the beaker and the mixture was heated almost to dryness. Then, 5.0 mL of aqua regia and 2.0 mL of H2O2 were added again to the residue and the mixture was evaporated to dryness. Double distilled water was added into the beaker and then the insoluble part was filtered through a filter paper and finally washed with double distilled water. The pH was adjusted to about 3.5 using 1.0 M of NaOH and the total volume was made up to 10.0 mL with double distilled water in a measuring flask. 5.0 mL of the digested samples were subjected to the CPE methodology for Pt4+ determination as described above.
Food samples
An accurately weighed sample (about 5.0 g) was placed in a 100 mL beaker, and a solution of concentrated HClO4-HNO3 1 : 2 (v/v) (10 mL) was added. This mixture was heated gradually until the solution became clear. Near dryness about 10 mL of double distilled water were added, the solution was filtered off then cooled and diluted to 50 mL with double distilled water. Then Pt4+ was determined as described above for 10 mL of this solution.
Results and Discussion
Reagent I and II is often applied as a chromgenic reagent for the determination of Pd2+ [31]. Pt4+ form a complex with I or/ and II in the presence of PONPE 5.0 which has a maximum wavelength at 452 or/and 459 nm, respectively. By addition of iodide ion, the solution became turbid and can be extracted by CPE procedure. The ternary complex formed in surfactantrich phase indicates a maximum absorbance at 474 or/and 482 nm, respectively (Figure 1). The absorbance was measured at 474 or/and 482 nm, respectively, against blank reagent, after separation of surfactant-rich phase.

Figure 1. Absorption spectra for Pt4+ complexed with I and II using mgmL-1 Pt4+ without CPE and 150 ng mL4+ with CPE at the optimum.
Optimization
To take full advantage of the method, experimental reaction conditions must be examined and optimized. Variable parameters were investigated to achieve optimum experimental conditions. All parameters were optimized by setting these parameters to be constant and optimizing one each time.
In the pH range of 2.5 – 11.5, the effect of pH on the developed colour at a constant concentration of complex in surfactant-rich phase was studied. Different buffer solutions (acetate, borate, phosphate, universal and thiel) were examined. The absorbance of the Pt4+– {I or II} – PONPE 5.0 system at 474 or/and 492 nm, respectively, in surfactant-rich phase was investigated against blank reagent. Thiel buffer solution gave the highest and constant absorbance. In the range of 3.0–4.0, the absorbance was nearly constant. So, pH 3.5 was selected as the optimum (Figure 2). The amount of pH 3.5 was investigated to choose the optimum volume. The highest absorbance value was achieved by addition of 8.0–12 mL of pH 3.5. For all further studies, 10 mL of pH 3.5 per 100 mL was selected.

Figure 2. Effect of pH on the CPE of 150 ng ml-1Pt4+ complexed with I and II at the optimum conditions.
The separation and determination of Pt4+ was affected with the reagent I or/and II concentration which investigated in the range of 0.5–5.0 × 10⁻⁴ M. The formed complex increased by increasing reagent concentration up to 2.5 × 10⁻⁴ M and decreased at higher concentrations. It was expected that increasing I or/and II causes an increase in the absorbance of complex. At concentrations ≥ 3.0 × 10⁻⁴ M, the concentration of uncomplexed reagent in surfactant-rich phase increases significantly. Therefore, much probably decrease of absorbance change at concentrations ≥ 3.0 × 10⁻⁴ M is due to this fact that the free reagent competes with the complexes in extraction to surfactant-rich phase. The optimum reagent concentration of 2.5 × 10⁻⁴ M was selected.
Effect of 50% PONPE 5 concentration on the complexation of Pt4+ was studied in the volume range 0.5 - 5.0 mL. The absorbance increased by increasing PONPE 5 concentration up to 2.5 mL of 50% and decreased at higher concentrations. The absorbance of blank also increased by increasing PONPE 5 concentration. This is due to more extraction of reagent by increasing PONPE 5 concentration, whereas the difference between the sample and blank (ΔA) increased by increasing PONPE 5 concentration up to 2.5 mL of 50% and decreased at higher concentrations (Figure 3). Therefore, 2.5 mL of 50% PONPE 5 was selected.

Figure 3. Effect of 50% PONPE 5 volume on the CPE of 150 ng mL-1 Pt4+ complexed with I and II at the optimum conditions.
Salt addition can cause non-ionic surfactant solutions to separate into immiscible surfactant-rich and surfactant-poor phases. Various inorganic salts KCl, KBr, KI, NaCl, NaF, and KNO3, were examined and KI was found as the best. Therefore, addition of iodide was induced micelle growth and extraction of complex. The iodide concentration effect was studied in the range of 0.005– 0.04 M. Addition of 0.025 M iodide in the final 100 mL solution sufficed for maximum extraction and separation of the complex formed and the absorbance decreased at higher concentrations. A 0.025 M iodide was selected for further studies.
Optimal incubation time equilibration and temperature were necessary to complete the reaction and to achieve as sufficient as possible for easy phase preconcentration and separation of Pt4+. The effect of equilibration temperature on the extraction recovery of Pt4+ was investigated in the range of 30–60°C. It was found that the extraction recovery increased with equilibration temperature from 45–55°C and stabilized up to 55°C. Thus 50°C was ensured to get maximum absorbance. Therefore, the temperature of 50°C was employed in continuing the experiment, keeping the equilibration temperature as 50°C and the influence of the incubation time on cloud point extraction was monitored in the range of 1.0–15 min thus the obtained result showed that the 5.0 min of incubation time was sufficient for the separation process. Also, a successful CPE was found to be enough after centrifugation at 3800 rpm for 5.0 min.Regarding sensitivity, various solvents were examined to choose the one producing the optimal results because the surfactantrich phase was precipitated. Among methanol, ethanol, acetone, acetonitrile, and DMF, acetonitrile gave the optimum results due to low overlapping of spectra of components and high sensitivity. Therefore, acetonitrile was selected in order to have appropriate amount of sample for transferring and measurement of the absorbance and also a suitable preconcentration factor. Therefore, a preconcentration factor of 500 was achieved using the proposed procedure.
Stoichiometric ratio
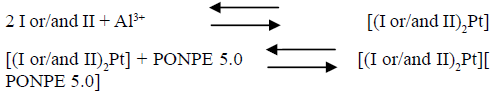
At the optimum conditions described early, the nature of the complex was established using the continuous variation and molar ratio procedures. The plot of absorbance versus the molar ratio of I or/and II to Pt4+, obtained by varying the I or/and II concentration, indicated inflection at molar ratio 2.0, indicating presence of two I or/and II molecules in the formed complex. Moreover, the Job method showed a ratio of I or/and II to Pt4+ = 2.0. Consequently, the results indicated that the stoichiometric ratio was (2 : 1) [I or/and II : Pt4+]. The conditional formation constant (log K), calculated using Harvey and Manning equation applying the data obtained from the above two procedures, was found to be 3.74, whereas the true constant was 3.57.
For the ternary complex with PONPE 5.0, the obtained results implied that a 1: 1 complex is formed between the [(I or/and II)2Pt] complex and PONPE 5.0. Consequently, the results indicated that the stoichiometric ratio was 2 : 1 : 1 [(I or/and II)2Pt][ PONPE 5.0], as recorded in the following equations. The conditional formation constant (log K), calculated using the Harvey and Manning equation applying the data obtained from the above two procedures, was found to be 4.04, whereas the true constant was 4.00.
Selectivity
Various cations and anions effect on 150 ng mL−1 Pt4+ determination by the proposed method was investigated. An ion was considered to be an interference when it caused difference in absorbance greater than ± 5.0%. For the determination of 150 ng mL−1 Pt4+, the foreign ions can be tolerated at the levels recorded in Table 1. I or/and II forms stable complexes with different metal ions, including transition metal ions. Most of the cations and anions tested do not interfere with the extraction and determination of Pt4+. These results demonstrate that excess amounts of some common cations and anions do not interfere on the determinations of the analyte, putting in evidence the adequate selectivity of the developed methodology. The interferences from Ni2+, Pd2+, and Au3+ were removed by using masking agent as NaF, EDTA, and SnCl2. The masking agent was added to the sample before addition of reagent solution. The masking agent form highly stable water soluble charged complexes with interfering ions and prevent them from complexing with I or/and II, thus removing their interference.
Table 1. Effect of diverse ions on the determination of 150 ng mL−1 Pt4+.
| Ion added | Tolerance limit, mg mL-1 | Ion added | Tolerance limit, mg mL−1 | ||
|---|---|---|---|---|---|
| I | II | I | II | ||
| Na+, K+, Li+ | 15000 | 7500 | Co2+, Rh3+ | 125 | 150 |
| Mg2+, Ca2+, Ba2+ | 12500 | 6000 | Pd2+ a | 100 | 129 |
| Al3+, Cr3+, Au3+ | 10500 | 5000 | Au3+ b | 75 | 60 |
| Pb2+, Mn2+, Hg2+ | 8750 | 4000 | Acetate, citrate | 12000 | 10500 |
| Cd2+, Zn2+, Sn2+, | 5000 | 3300 | Sulphate, oxalate | 9000 | 8000 |
| V5+, V4+, Sn4+ | 2250 | 2500 | Nitrate, tartrate | 7500 | 7000 |
| Ag+, Hg+ | 3700 | 3000 | Chloride, nitrite | 5000 | 5000 |
| W6+, Mo6+, Cr6+ | 2250 | 1750 | Phosphate, benzoate | 3000 | 2750 |
| Th4+, Zr4+ | 1800 | 1500 | Fluoride, iodide | 2250 | 2500 |
| Rh3+, Ir3+ | 1250 | 800 | Carbonate, bicarbonate | 1750 | 2000 |
| Ru3+, Os8+ | 800 | 600 | Thiosulphate, | 1000 | 1000 |
| Ce3+, Ce4+ | 250 | 200 | Thiocyanate | 750 | 800 |
| Ni2+a | 150 | 80 | Iodate, sulphide | 600 | 600 |
Note: *: Cations added as chloride, nitrate and sulphate, anions added as sodium or potassium states, unless otherwise stated
a: In the presence of 300 mg mL−1 of oxalate; NaF or EDTA
b: In the presence of 1200 mg mL−1 SnCl2
Analytical characteristics
The analytical characteristics of the optimized method summarized in Table 2, including regression equation, linear range and limit of detection, reproducibility, and preconcentration and improvement factor. The limit of detection [32], defined as CL =3SB/m (where CL, SB, and m are the limit of detection, standard deviation of the blank and slope of the calibration graph, respectively), was 1.55 and 1.42 using I and II, respectively. Because the amount of Py4+ in 100 mL of sample solution is measured after preconcentration in a final volume of 0.2 mL acetonitrile, the solution is concentrated by a factor of 500. The improvement factor, obtained as the ratio of the slope of the calibration graph for the CPE procedure to that of the calibration graph in micellar media without preconcentration, was 342 and 427 for I and II, respectively. The relative standard deviation (RSD) and relative error for six replicate measurements of 150 ng mL−1 of Pt4+ was 1.67% and 1.32%, respectively.
Table 2. Analytical features of the proposed method.
| Parameters | without CPE | Using CPE | ||
|---|---|---|---|---|
| I | II | I | II | |
| Amount of acetonitrile | -- | -- | 0.2 | 0.2 |
| pH | 3.5 | 3.5 | 3.5 | 3.5 |
| Optimum reagent (M) | 1.6 × 10⁻⁴ | 1.6 × 10⁻⁴ | ||
| Reaction time (min) | 20 | 20 | 5 | 5 |
| Stirring time (min) | 10 | 10 | 5 | 5 |
| Beer’s range (ng mL−1) | 500 - 3850 | 750-5000 | 5.0–300 | 5.0–300 |
| Ringbom range (ng mL−1) | 1000 - 3600 | 1500-5750 | 15 –275 | 15-270 |
| Molar absorptivity (L mol−1cm−1) | 2.28 × 10⁴ | 2.04 × 10⁴ | 4.89 × 10⁵ | 4.45 × 10⁵ |
| Sandell sensitivity (ng cm−2) | 27.9 | 25.7 | 0.004 | 0.0044 |
| Regression equation | ||||
| Slope (µg mL−1) | 0.021 | 0.018 | 2.51 | 2.28 |
| Intercept | -0.012 | 0.04 | ||
| Correlation coefficient (r) | 0.998 | 0.9888 | 0.999 | 0.9995 |
| RSD a (%) | 3.1 | 3.5 | 1.67 | 1.82 |
| Detection limits (ng mL−1) | 160 | 230 | 1.55 | 1.42 |
| Quantification limits (ng mL−1) | 490 | 725 | 4.82 | 4.5 |
| Enhancement factor | -- | 500 | 500 | |
| Improvement factor | -- | 342 | 427 | |
The proposed procedure characteristics have been compared with those of other methods. Table 3 compares analytical quality parameters of the proposed procedure with those reported previously for Pt4+ determination. It was shown that the proposed method is comparable in detection limit to the previous studies for Pt4+ determination. Therefore, CPE combined with spectrophotometric detection is a very simple and sensitive method for the preconcentration and determination of Pt4+.
Table 3. Comparison of some spectrophotometric methods for platinum.
| Reagents | λμαξ | ε ξ 104 Λ | Beer’s | Ref. |
|---|---|---|---|---|
| (nm) | mol−1 cm−1 | µg mL−1 | ||
| 2-(6-Aminoquinoxaline-2, 3-dithiol | 625 | 2.75 | 0.0 - 2.0 | [33] |
| 5-Chloro2-hydroxythiobenzhydrazide | 680 | 2.4 | 1.0 - 7.0 | [34] |
| 2, 2'-Diaminodiphenyldisulphide | 725 | 5.48 | 0.25 - 5.0 | [35] |
| N-(3,5-dimethylphenyl)-N’-(4-amino-benzenesulfonate)-thiourea | 755 | 9.51 | 0.1 - 3.0 | [36] |
| Pyronine G | 575 | 10.7 | 0.0 - 0.80 | [37] |
| Promethazine hydrochloride | 406 | 1 | 0.0 - 7.5 | [38] |
| NPTSQ | 640 | 13.7 | 0.0 - 1.0 | [39] |
| 5-Chloro2-hydroxythiobenzhydrazide | 510 | 1.06 | 1.8 - 14.4 | [40] |
| Butyl rhodamine B | 570 | 92.6 | 0.0 - 1.20 | [41] |
| o-Hydroxythiobenzhydrazide | 690 | 2.78 | 0.46 - 9.2 | [42] |
| Bis(2-hydroxynaphtaldehyde) ethylendiamine | 355 | 1.4 | 1.0 - 5.0 | [43] |
| Rhodamine 6G | 530 | 28 | 0.08 - 0.6 | [44] |
| TMK | 530 | 29.5 | 0.0 – 0.48 | [45] |
| 1-Phenyl-4-ethyl thiosemicarbazide | 715 | 5 | 0.2 – 2.6 | [46] |
| 5-Br-PADAP | 570 | 15.4 | 1.0 – 3.6 | [47] |
| CEABT | 390 | 2.05 | 0.8 – 3.2 | [48] |
| 5-(2’,4’-Dimethylphenylazo)-6-hydroxy-pyrimidine-2,4-dione | 634 | 149 | 0.03–0.13 | [29] |
| I | 474 | 48.9 | 0.005 -0.3 | This work |
| II | 482 | 44.5 | 0.5-0.300 | This work |
Determination of Pt(IV) in spiked water samples
To test the accuracy of the studied separation method, it has been applied to determine Pt4+ in spiked water samples from different sources. The results (Table 4) indicated that the recoveries are quantitative at reasonable levels for trace Pt4+ analysis, ranging from 98–103%. The method is then applied for the analysis of synthetic mixtures. A suitable liquid of the synthetic mixture was analyzed by the proposed procedure and the results are displayed in Table 4. The agreement between the actual and found values confirmed the accuracy of the procedure.
Table 4. Determination of Pt4+ in spiked water samples by the proposed procedurea.
| Sample | Concentration of Pt(IV) (ng mL−1) | ||||||
|---|---|---|---|---|---|---|---|
| Added | Found ± S.D. | % Recovery | RSD | ||||
| I | II | I | II | I | II | ||
| Tap water | — | BDL | BDL | — | |||
| 10 | 10.1 ± 0.07 | 9.85 ± 0.06 | 101 | 98.5 | 1.7 | 1.5 | |
| 20 | 20.0 ± 0.05 | 19.75 ± 0.07 | 100 | 98.75 | 1.9 | 2.2 | |
| 50 | 50.5 ± 0.08 | 50.50 ± 0.05 | 101 | 101 | 2.4 | 1.9 | |
| River Nile water | — | BDL | BDL | — | |||
| 20 | 19.80 ± 0.03 | 20.25 ± 0.07 | 99 | 101.25 | 2.1 | 2.6 | |
| 40 | 40.75 ± 0.07 | 40.60 ± 0.08 | 101.9 | 101.5 | 2.7 | 2.9 | |
| 60 | 59.85 ± 0.05 | 60.75 ± 0.03 | 99.75 | 101.25 | 1.4 | 1.6 | |
| Brackish water | — | BDL | BDL | — | |||
| 30 | 29.80 ± 0.08 | 30.50 ± 0.07 | 101.7 | 101.67 | 2.2 | 1.8 | |
| 60 | 60.60 ± 0.07 | 59.40 ± 0.05 | 99 | 99 | 1.7 | 1.6 | |
| 90 | 89.50 ± 0.04 | 91.10 ± 0.06 | 101.2 | 101.22 | 1.5 | 1.9 | |
| Sea water | — | BDL | BDL | — | |||
| 40 | 39.55 ± 0.07 | 40.50 ± 0.09 | 101.3 | 101.25 | 2.9 | 2.6 | |
| 80 | 81.00 ± 0.05 | 80.07 ± 0.80 | 101.3 | 101.25 | 2.5 | 2.8 | |
| 120 | 121.2 ± 0.07 | 119.0 ± 0.06 | 101 | 99.16 | 2.1 | 2.2 | |
| Waste water | — | BDL | BDL | — | |||
| 60 | 59.40 ± 0.06 | 60.75 ± 0.08 | 101.3 | 101.25 | 2.6 | 2.8 | |
| 120 | 118.6 ± 0.09 | 121.5 ± 0.05 | 98.83 | 101.25 | 1.8 | 2.9 | |
| 180 | 182.2 ± 0.07 | 178.4 ± 0.08 | 101.2 | 99.11 | 2.7 | 2.6 | |
Note: BDL: below detection limit. The results are the mean of five measurements ± standard deviation
Applications
In order to investigate the validity of the proposed method, the described procedure was applied to determine Pt4+ in food and geological samples. The results obtained in five individual determinations and their standard deviations are shown in Table 5. The same batch of samples was also analysed by ICP-MS after solvent extraction with APDC/ MIBK [49]. The paired t-test was applied to the results obtained by the proposed and the reference methods, and it indicated that the calculated t values were lower than the tabulated t value (t=2.36, n=5, P=0.05). This suggested that at the 95% confidence level, the difference between the results obtained by the two methods were statistically not significant. These results demonstrate the applicability of the method for the determination of Pt4+ in real samples.
Table 5. Determination of Pt4+ in food and geological samples by the recommended procedure.
| Sample | Pt(IV) concentrationa (ng g−1) | t-test | F-value | ||
|---|---|---|---|---|---|
| The present work | |||||
| I | II | ICP-MSb | |||
| Rice | 0.23 ± 0.04 | 0.24 ± 0.03 | 0.25 ± 0.02 | 1.78 | |
| Tomato | 0.13 ± 0.06 | 0.14 ± 0.05 | 0.14 ± 0.07 | 2.98 | |
| Flour | 0.35 ± 0.08 | 0.31 ± 0.04 | 0.37 ± 0.03 | 2.11 | |
| Flour | 0.3 ± 0.04 | 0.34 ± 0.08 | 0.37 ± 0.03 | 3.47 | |
| Beans | 0.26 ± 0.05 | 0.25 ± 0.04 | 0.24 ± 0.07 | 2.25 | |
| Tobacco | 0.56 ± 0.09 | 0.43 ± 0.11 | 0.44 ± 0.21 | 3.65 | |
| Road dust | 16.75 ± 0.25 | 16.50 ± 0.70 | 15.95 ± 1.11 | 1.93 | |
| Rock | 33.7 ± 0.75 | 32.42 ± 0.45 | 34.33 ± 1.75 | 3.13 | |
Note: a Mean ± S.D. (n = 5). b After solvent extraction with APDC/MIBK
Conclusion
The results of this work demonstrate the possibility of using drug I and II as an effective complexing agent for the CPE and separation of Pt4+ prior to its determination using spectrophotometry. The method can be applied successfully determination of Pt4+ in environmental samples. The procedure proved to be sensitive, selective, rapid, and convenient to determine Pt4+ in environmental samples without interferences. Furthermore, the proposed procedure was compared with other reported methods. As is demonstrated, the proposed procedure presents superior or comparable analytical figures of merit to the reported procedures.
References
- WHO. Environmental Health Criteria, No.125: Platinum. World Health Organization, Geneva. 1991.
- Bradford CW. Platinum, in Handbook of Toxicity of Inorganic Compounds. New York: Basel. 1988:533–539.
- Lee JY, Rajesh KJ, Kim JS, et al. Liquid–liquid extraction/separation of platinum(IV) and rhodium(III) from acidic chloride solutions using tri-iso-octylamine. J Hazard Mater. 2009;168(1): 424–9.
- Gupta JG. Determination of trace and ultra-trace amounts of noble metals in geological and related materials by graphite-furnace atomic-absorption spectrometry after separation by ion-exchange or co-precipitation with tellurium. Talanta. 1989;36(6): 651–6.
- Soylak M, Buyuksekerci EB, Elci L. Flame atomic absorption spectrometric determination of gold, palladium and platinum in catalytic converters. Asian J Chem. 2004;16(3):1625–9.
- Elci L, Soylak M, Buyuksekerci EB. Separation of gold, palladium and platinum from metallurgical samples using an Amberlite XAD-7 resin column prior to their atomic absorption spectrometric determinations. Anal Sci. 2003;19(12):1621–24.
- Marinho RS, SilvaCN, Afonso JC, et al. Recovery of platinum, tin and indium from spent catalysts in chloride medium using strong basic anion exchange resins. J Hazard Mater. 2011;192(3):1155–60.
- Chappuy M, Caudron E, Bellanger A, et al. Determination of platinum traces contamination by graphite furnace atomic absorption spectrometry after preconcentration by cloud point extraction. J Hazard Mater. 2010; 176(1-3):207–12.
- Rekha D, Prasad PR, Chiranjeevi P. Platinum determination in environmental samples using preconcentration cloud-point extraction with flame atomic absorption spectrometry. Environ Monit Assess. 2007;130(1-3):537.
- Cerutti S, Silva MF, Asquez JAG, et al. Cloud point preconcentration prior to capillary zone electrophoresis: Simultaneous determination of platinum and palladium at trace levels. Electrophoresis. 2005;18(26):3500–6.
- Ojeda CB, Rojas FS. Separation and preconcentration by cloud point extraction procedures for determination of ions: recent trends and applications. Microchim Acta. 2012;177(1-2):1–21.
- Anastas P, Eghbali N. Green chemistry: Principles and practice. Chem Soc Rev. 2010;39(1):301–12.
- Watanabe H, Tanaka H. A non-ionic surfactant as a new solvent for liquid-liquid extraction of zinc(II) with 1-(2-pyridylazo)-2-naphthol. Talanta. 1978;2(1):585–89.
- Amin AS. Utility of solid phase extraction for spectrophotometric determination of gold in water, jewel and ore samples. Spectrochim. Acta (A). 2010;77(5):1054–8.
- Amin AS. Spectrophotometric determination of bismuth after solid–phase extraction using amberlite XAD-2 resin modified with 5-(2‘-bromophenylazo)-6-hydroxy pyrimidine-2,4-dione. Spect Lett. 2011;44:424–31.
- Amin AS. Solid-phase extraction using polymer-based cartridge modified with 2-(2-benzothiazolylazo)-3-hydroxyphenol for preconcentration of Uranium(VI) Ions from water and real samples. Spect Lett. 2012;45(4):246–55.
- Kassem MA, Amin AS. Spectrophotometric determination of iron in environmental and food samples using solid phase extraction. Food Chem. 2013;141(1):1941–6.
- Amin AS. Study on the solid phase extraction and spectrophotometric determination of cobalt with 5-(2-benzothiazolylazo)-8-hydroxyquinolene. Arab J Chem. 2014;7(5):715–21.
- Gouda AA, Amin AS. Cloud-point extraction, preconcentration and spectrophotometric determination of trace quantities of copper in food, water and biological samples. Spectrochim. Acta (A). 2014;120:88–96.
- Kassem MA, Amin AS. Determination of rhodium in metallic alloy and water samples using cloud point extraction coupled with spectrophotometric technique. Spectrochim Acta (A). 2015;136:1955–61.
- Amin AS, Zaafarany IA. Spectrophotometric determination of bismuth after solid-phase extraction using amberlite XAD-2 resin modified with 5-(2′-bromophenylazo)-6-hydroxy pyrimidine-2,4-dione . J Taibah Univ Sci. 2015;9(4):490–7.
- Amin AS, Kassem MA, Mohammed TY. Utilization of cloud-point extraction for colorimetric determination of trace amounts of thorium(IV) in real samples. RCS Advance. 2015;5:52095-100.
- Amin AS. Optimized solid phase extraction methodology for separation, and spectrophotometric determination of boron using amberlite XAD-16 resin modified with 2-(2-benzothiazolylazo)-4-methoxyphenol. RCS Advance. 2015;5(82):66975–80.
- AAM El-Sharjawy, Amin AS. Use of cloud-point preconcentration for spectrophotometric determination of trace amounts of antimony in biological and environmental samples. Anal Biochem. 2016;492: 1–7.
- Amin AS, Moalla SMN. Utility of solid phase extraction for UV-visible spectrophotometric determination of gallium in environmental and biological samples. RSC Adv. 2016;6(3):1938–44.
- Amin AS, Kassem MA, Moalla SMN. Determination of scandium in monazite and environmental samples using cloud point extraction coupled with a spectrophotometric technique. RCS Advance. 2016;6(77) :73797–804.
- Amin AS, Kassem MA. Determination of nano amounts of copper in environmental, biological, and water samples via cloud point extraction and spectrophotometry. Anal Chem Lett. 2016;6(6):820–833.
- Gouda AA, Sheikh REl, Amin AS. Application of cloud point extraction for separation of iron in water, food and environmental samples perior to determination by spectrophotometry. Anal Chem Lett. 2016;6 (3):296–312.
- Amin AS, Nassar MY. Cloud-point extraction for preconcentration and platinum determination using spectrophotometry in environmental samples. Anal Chem Lett. 2017;7(1):128 – 141.
- Britton HTS. Hydrogen ions (4th edn). London: Chapman and Hall. 1952.
- Amin AS, Hassan WS, Ragab GH, Application of non-steroidal anti-inflammatory drugs for palladium determination. Chem Pap. 64;6:715–722.
- Irving HNMH, Freiser H, West TS. IUPAC compendium of analytical nomenclature, Definitive Rules. Pergamon Press, Oxford. 1981.
- Bhaskare CK, Pawashe RG. Separation and extractive spectrophotometric determination of palladium and platinum with 6-aminoquinoxaline-2,3-dithiol. Analyst. 1981;106(1266): 1005–9.
- Sawant SS. Spectrophotometric determination of traces of platinum with 5-chloro-2-hydroxythiobenzhydrazide after extraction into molten naphthalene. Anal Sci. 2010;26 (1):95–100.
- Bag SP, Chakrabarti SK. 2,2′-Diaminodiphenyldisulphide—a new sensitive spectrophotometric reagent for platinum. Talanta. 1977;24 (2):128–9.
- Xin Z, Yuanqing Z, Huang Z, et al. Study of solid phase extraction prior to spectrophotometric determination of platinum with N-(3,5-Dimethylphenyl)-N′-(4-Aminobenzenesulfonate)-Thiourea. Mikrochim Acta. 2006; 153(3-4):187–91.
- Jaya S, RaoTP, Ramakrishna TV. Spectrophotometric determination of platinum with iodide and Pyronine G. Analyst. 1984;109(11):1405–7.
- Gowda HS, Padmaji KA. Spectrophotometric studies on platinum—Promethazine hydrochloride complex. Microchem J. 1980;25(4):396-402.
- Zhao JW, Xu QH. Colour reaction of platinum(II) with 5-(4-nitrophenylazo)-8-(p-toluenesulphonamido)-quinoline and its analytical applications. Talanta. 1991;38 (8):909–12.
- Sawant SS. Sequential separation and spectrophotometric determination of osmium and platinum with 5-Chloro-2-Hydroxythiobenzhydrazide. Anal Sci. 2009;25(6):813–8.
- Li Z, Wang J, Xu Q. Highly sensitive spectrophotometric determination of trace amounts of platinum(IV) with the molybdate-basic dyes-poly(vinyl alcohol) system. Mikrochim Acta. 1995;118(1-2):43–9.
- Gangopadhyay PK, Das HR, Shome SC. Spectrophotometric determination of platinum(IV) with o-hydroxythiobenzhydrazide. Anal Chim Acta. 1973;66(6):460–3.
- Khuhawar MY, Arain GM, Shah A. Spectrophotometry determination of platinum(ii) from platinum based cisplatin and carboplatin anticancer injections. The Nucleus. 2004;41(1-4):59–62.
- Marczenko Z, Kalinowski K. Sensitive flotation-spectrophotometric determination of platinum based on systems with chlorostannate(II) and basic dyes. Anal Chim Acta. 1983;153:219–27.
- Liu ZL, Chang WB, Hong J, et al. Studies on the co-colour reaction of platinum(IV) and palladium(II) with 4,4′-bis(dimethylamino)thiobenzophenone . Analyst. 1991;116:213–5.
- AL-Attas A. Separation and spectrophotometric determination of platinum (IV) in natural waters, simulated samples and prepared solid complexes using 1- Phenyl-4-Ethylthiosemicarbazide. Jordan J Chem. 2007;2:183–97.
- Ratre P, Kumar D. Spectrophotometric determination of Pt (II) and Pd (II) in environmental samples collected from highly polluted areas of Delhi region of India. Inter J Emerging Techno Computational Appl Sci. 2013;5:421–429.
- Jayabalan K, Naik PP, Shetty N. Single step determination of platinum(IV) in alloys, catalysts, complexes, environmental and pharmaceutical samples using p-[N,N-bis(2chloroethyl)amino] benzaldehyde thiosemicarbazone. J Indian Chem Soc. 2013;90(8):1061–1068.
- Hassanien MM. Silica glass modified with flavonoid derivatives for preconcentration of some toxic metal ions in water samples and their determination with ICP-MS. Environ Monit Assess. 2010;167(1-4):587–98.