Research Article - Biomedical Research (2017) Volume 28, Issue 15
Truncated logistic regression for matched case-control studies using data from vision screening for school children
Ertugrul Colak1* and Huseyin Gursoy2
1Department of Biostatistics, Faculty of Medicine, Eskisehir Osmangazi University, Eskisehir, Turkey
2Department of Ophthalmology, Faculty of Medicine, Eskisehir Osmangazi University, Eskisehir, Turkey
- *Corresponding Author:
- Ertugrul Colak
Department of Biostatistics
Faculty of Medicine
Eskisehir Osmangazi University, Turkey
Accepted on July 10, 2017
Abstract
Matching is a methodology applied at the beginning of a study that compares two or more groups. The main advantage for matching over random non-matching sampling is that matched study designs can often lead to a more statistically efficient analysis. The most commonly used methods to analyse the matched pair dataset are logistic regression models. The main advantage of using logistic regression with matched data occurs when there are variables other than the matched variables that the investigator wishes to control. Conditional logistic regression is one commonly used method to investigate the relationship between an outcome and a set of covariates in matched case-control studies. The aim of this study is to propose a truncated logistic regression analysis for matched case-control studies, an alternative approach to conditional logistic regression methods, and to demonstrate its applicability in matched case-control studies. We also applied the methods to a real data set and compared them. We showed that regression coefficient estimation can be accomplished using either truncated or conditional logistic regression methods. However, the parameter estimates for those covariates obtained from truncated logistic regression had more precision. In conclusion, truncated logistic regression model may be the preferred method for the analysis of matched case-control data because it is a more efficient method.
Keywords
Matched case-control data, Conditional logistic regression, Truncated logistic regression, Vision screening, Myopia.
Introduction
Matching is a methodology applied at the beginning of a study that compares two or more groups. For matching, a referent group is selected to compare with the primary interest group, defined as the index group. The matching process is performed by limiting the referent group to make it comparable to the index group on one or more risk factors called “matching factors.” In a case-control study, the referent group is the control, which is compared with an index group of cases [1,2].
The rationale for matched studies has been discussed in detail in epidemiology texts [2-6]. In this type of study, subjects are grouped based on variables believed to be associated with the outcome. For example, age and sex are widely used matching variables. If there is only one case and one control, the matching is defined as 1:1. m:n matching refers to a situation in which there is a varying number of cases and controls in the matched sets [6-8].
The main advantage for matching over random non-matching sampling is that matched study designs can often lead to a more statistically efficient analysis. In particular, matching may lead to a narrower confidence interval, that is, more precision, around the parameters being estimated than would be achieved without matching [7].
An important disadvantage of matching is that it can be costly, both in terms of the time and labor required to find appropriate matches and in terms of information loss due to discarding available controls that are unable to satisfy the matching criteria. In fact, if too much information is lost from matching, the matching process may result in a loss of statistical efficiency [1,9].
Statistical methods, such as the Mantel-Haenszel chi-square test and McNemar’s test, are used to analyse a matched pair dataset. However, most commonly used methods to analyse the matched pair dataset are logistic regression models. The main advantage of using logistic regression with matched data occurs when there are variables other than the matched variables that the investigator wishes to control. Conditional logistic regression is one commonly used method to investigate the relationship between an outcome and a set of covariates in matched case-control studies. The outcome is whether the subject is a case or a control [1,10].
The aim of this study is to propose a truncated logistic regression analysis for matched case-control studies, an alternative approach to conditional logistic regression methods, and to demonstrate its applicability in matched case-control studies. To the best of our knowledge, this is the first trial using truncated logistic regression analysis for matched case-control studies. In section 2, some notations are given about truncated and conditional logistic regression models. We also applied the methods to a real data set and compared them. The results are evaluated in section 3. Finally, the results are discussed and a conclusion section is included in section 4.
Materials and Methods
Truncated logistic regression method
Truncated logistic regression is a model that is applied to binary data consisting of a group of individuals who each have a binary response and only if one or more of the individuals have a positive response [10,11].
The specific form of the truncated logistic regression form is described as follows.
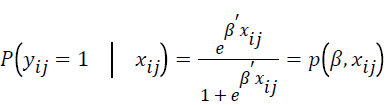
where  is the event probability of jth individual in the ith group,
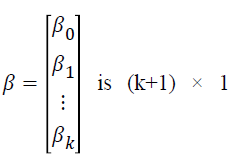 vector of regression coefficients,
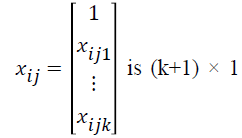 vector of covariates associated with
the jth individual in the ith group, i=1,...,G is the number of groups, j=1,...,ni is the sample size for the ith group, and k is the number of covariates [10,12,13].
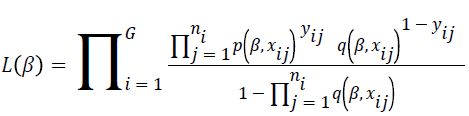
The truncated logistic regression method is based on the probability that a group is observed, which is the probability that it results in at least one event. This has the effect of introducing 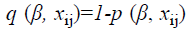 as a divisor to a conventional logistic regression likelihood. The likelihood function for the model is described as follows.
The parameter estimates  are calculated using a score function and Fisher’s information matrix by the Newton-Raphson algorithm [14,15]. The score function for β is
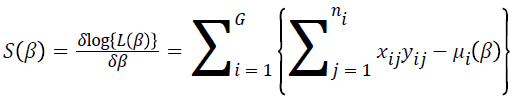
where 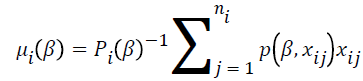 and
and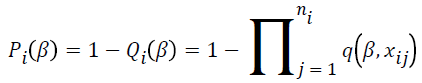 . The parameter estimates is the solution of S (β)=0.
The Fisher’s information matrix is
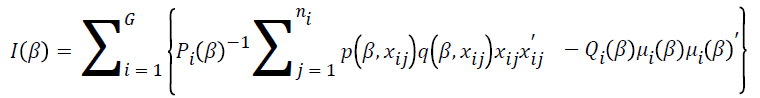
The variance of the parameter estimates is 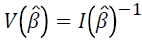 .
.
Parameter estimates are obtained by using the Newton- Raphson algorithm as follows.
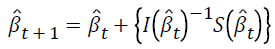
where t is the iteration number. For the first iteration, 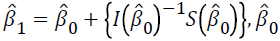 is taken as zero.
The tolerance level is used to determine the number of iterations as follows.
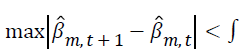
where  is parameter estimates for the mth covariate at the iteration
  is the parameter estimate for the mth covariate at iteration t, and m=0,1,…,k. The tolerance level is taken as ε ≤ 0.0001.
Conditional logistic regression method
Conditional logistic regression is widely used to determine the relationship between an outcome and a set of prognostic factors in matched case-control studies. The outcome is whether the subject is a case or a control.
The specific form of the conditional logistic regression form is described as follows.
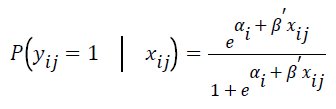
where P (yij=1|xij) is the event probability of jth individual in the ith group, αi is the effect of the ith group, 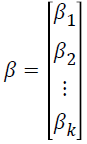 is k × 1 vector of regression coefficients,
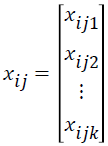 is k × 1 vector of covariates associated with the jth individual in the ith group, i=1,…,G is number of groups, j=1,…,ni is the sample size for the ith group, and k is the number of covariates.
The conditional logistic regression model is based on conditional probabilities that condition away the group effects, which results in a model that contains substantially fewer parameters. In this situation, the αi are known as nuisance parameters [10,12,13,16].
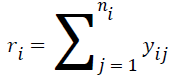
The conditional logistic regression model eliminates the nuisance parameters from the maximum likelihood function by conditioning the number of total observations, which are statistically sufficient. The sufficient statistics for the ith group described as follows.
The conditional reference set is defined as follows.
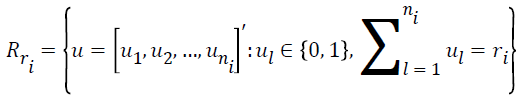
where R (ri) demonstrates the set of all possible vectors of ni binary responses whose summations are ri. The maximum likelihood function is defined as follows.
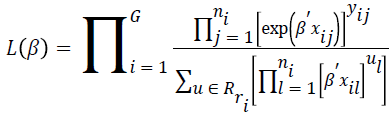
For conditional asymptotic inference, maximum likelihood estimates of the regression parameters are obtained by maximizing the conditional likelihood with the Newton- Raphson algorithm [17].
Vision screening data
The study was approved by our local ethics committee (ESOGU-2016-66) and was performed in accordance with the Declaration of Helsinki after informed consent was obtained from each subject’s parent. A Lenstar LS900 (Haag-Streit AG, Koeniz, Switzerland) was used for all measurements. The measurements were performed at a primary school as part of a screening program. A total of 252 school children between 6 and 12 y of age were screened. The binary dependent variable was whether a child had myopia or not. Various ophthalmological covariates such as Axial Length (AL) in mm, Central Corneal Thickness (CCT) in μm, Anterior Chamber Depth (ACD) in mm, Lens Thickness (LT) in mm, corneal curvatures (K1, K2) in Diopters (D), and individual level covariates such as age and sex were measured. All measurements were obtained 30 min after instilling two drops of 1% tropicamide 5 min apart. Three consecutive measurements were obtained for each eye. Only the right eyes were included and the mean values for each variable were used for analysis. The children were matched according to age and gender by using case-control matching design of IBM SPSS Statistics version 23. Pairing was done using 7 age and 2 sex groups. For this reason, the number of matched sets consisted of 14 groups. After matching, 200 out of 252 school children were included in the analysis.
Conditional and truncated logistic regression methods were applied to the data to estimate the effect of various ophthalmological and individual-level covariates on the probability of myopia, and the results of the models were compared according to the parameter estimates and their standard errors and the confidence intervals of the odds ratios.
Results
The mean measurements obtained in control cases and children with myopia are shown in Table 1.
| Covariates | Control cases (n=100) | Myopic cases (n=100) | p values* |
|---|---|---|---|
| Mean ± Sd. | Mean ± Sd. | ||
| AL (mm) | 22.50 ± 0.84 | 23.18 ± 0.84 | <0.001 |
| CCT (µm) | 549.76 ± 37.48 | 550.22 ± 35.64 | 0.929 |
| ACD (mm) | 3.49 ± 0.30 | 3.55 ± 0.31 | 0.136 |
| LT (mm) | 3.40 ± 0.18 | 3.41 ± 0.16 | 0.908 |
| K1 (D) | 42.73 ± 1.56 | 43.46 ± 1.32 | <0.001 |
| K2 (D) | 43.49 ± 4.23 | 44.42 ± 1.43 | 0.039 |
| *Independent samples t test. | |||
Table 1. The mean values obtained in the right eyes of school children.
According to the univariate analysis shown in Table 1, AL, K1 and K2 are significant covariates with differences between controls and myopic cases.
The matched groups for myopia according to age and gender are shown in Table 2. There were 90 male and 110 female children. A total of 100 of 200 children had myopia, 45 male and 55 female.
| Matched groups | Gender | Age | Myopia | Total | |
|---|---|---|---|---|---|
| n | n | ||||
| - | + | ||||
| 1 | Male | 6 | 10 | 10 | 20 |
| 2 | 7 | 13 | 13 | 26 | |
| 3 | 8 | 4 | 4 | 8 | |
| 4 | 9 | 7 | 7 | 14 | |
| 5 | 10 | 1 | 1 | 2 | |
| 6 | 11 | 6 | 6 | 12 | |
| 7 | 12 | 4 | 4 | 8 | |
| Male total | 45 | 45 | 90 | ||
| 8 | Female | 6 | 10 | 10 | 20 |
| 9 | 7 | 10 | 10 | 20 | |
| 10 | 8 | 13 | 13 | 26 | |
| 11 | 9 | 9 | 9 | 18 | |
| 12 | 10 | 8 | 8 | 16 | |
| 13 | 11 | 2 | 2 | 4 | |
| 14 | 12 | 3 | 3 | 6 | |
| Female total | 55 | 55 | 110 | ||
| Total | 100 | 100 | 200 | ||
Table 2. The n:n matched case-control layout of the 84 children according to age and gender.
The conditional and truncated regression models were fitted using the methods presented in section 2, and the results are given in Tables 3 and 4, respectively. Among the independent variables AL, LT, and K1 were found to be significant covariates for myopia according to the backward stepwise (Wald) method, and the non-significant covariates were removed from the model to simplify the analysis.
| Variable | Coef. | Std. err. | z | p-value | Odds ratio | 95% CI for odds ratio |
|---|---|---|---|---|---|---|
| AL | 3.19 | 0.5 | 6.38 | <0.001 | 24.24 | 9.11-64.51 |
| LT | 5.02 | 1.45 | 3.46 | 0.001 | 151.63 | 8.78-2617.24 |
| K1 | 1.44 | 0.23 | 6.28 | <0.001 | 4.2 | 2.68-6.57 |
Table 3. The results of the conditional logistic regression.
| Variable | Coef. | Std. err. | z | p-value | Odds ratio | 95% CI for odds ratio |
|---|---|---|---|---|---|---|
| Intercept | -141.83 | 21.12 | 6.71 | <0.001 | - | - |
| Al | 2.91 | 0.45 | 6.51 | <0.001 | 18.38 | 7.60-44.34 |
| LT | 5.43 | 1.37 | 3.97 | <0.001 | 228.15 | 15.56-3344.10 |
| K1 | 1.32 | 0.21 | 6.22 | <0.001 | 3.73 | 2.48-5.65 |
Table 4. The results of the truncated logistic regression.
According to the conditional logistic regression results, the odds ratios (95% confidence intervals) were 24.24 (9.11-64.51), 151.63 (8.78-2617.24), and 4.20 (2.68-6.57) for AL, LT, and K1 respectively. However, the odds ratios and confidence intervals obtained from the truncated logistic regression method for AL, LT, and K1 were 18.38 (7.60-44.34), 228.15 (15.56-3344.10), and 3.73 (2.48-5.65), respectively. Truncated logistic regression gives more efficient parameter estimates with narrower confidence intervals. We also showed that there is agreement between conditional and truncated logistic regression methods for parameter coefficients.
However, truncated logistic regression gives more precise estimates.
Discussion
There is more than one method that can be used for the same purpose in the analysis of matched case-control data for clinical studies. Choosing the correct method ensures unbiased, consistent, efficient, and sufficient parameter estimates with minimum variance. Logistic regression methods are widely used in the analysis of clinical research involving matched case-control data. The most widely used method is conditional logistic regression [1]. In this study, for the analysis of matched case-control data, we proposed an alternative method, truncated logistic regression introduced by O'Neil and Barry in 1995 [10]. Additionally, a comparison of conditional and truncated logistic regression models was made, and these comparisons were shown using an application data set about myopia.
The results of this study show that AL, LT, and K1 are significant covariates affecting the probability of whether a child has myopia. Our findings were consistent with the Li et al. study, in which AL, corneal curvatures, and LT were significant determinants of refraction [18]. The increase in AL was found to be the most important predictor of myopia in children [19]. These results are similar to the current findings. The association between LT and myopia remains controversial, although Tog et al. found an increased LT in myopic children aged 6-12 y [19,20].
We showed that regression coefficient estimation can be accomplished using either truncated or conditional logistic regression methods. We also showed that there is agreement between conditional and truncated logistic regression methods for the coefficient estimates. The parameter estimates for those covariates obtained from truncated logistic regression had more precision. This was evident in the lower standard errors of the estimates from truncated logistic regression. In addition, the confidence intervals for the odds ratios of the truncated model were narrower than the confidence intervals of the conditional logistic regression odds ratios.
In conclusion, the two methods are applicable to any situations in which a binary dependent variable and related covariates are measured if and only if at least one individual of the matched set has a positive binary response. However, the truncated logistic regression model may be the preferred method for the analysis of matched case-control data because it is a more efficient method.
References
- Kleinbaum DG, Klein M, Pryor ER. Logistic regression: a self-learning text. Newyork Springer 2010.
- Kleinbaum DG, Kupper LL, Morgenstern H. Epidemiologic research: principles and quantitative methods. John Wiley & Sons 1982.
- Breslow NE, Day NE. Statistical methods in cancer research. The analysis of case-control studies. Distributed for IARC by WHO, Geneva, Switzerland 1980.
- Kelsey J, Thompson WD, Evans A, Kelsey J, Thompson W. Case control studies. Meth Observ Epidemiol 1986.
- Rothman KJ, Greenland S. Precision and validity in epidemiologic studies. 1998.
- Schlesselman JJ. Case-control studies: design, conduct, analysis. Oxford University Press 1982.
- Hosmer DW, Lemeshow S. Applied logistic regression. Wiley 2000.
- Miettinen OS. Individual matching with multiple controls in the case of all-or-none responses. Biometrics 1969; 25: 339-355.
- Kleinbaum DG. Logistic regression: a self-learning text. Springer New York 2013.
- ONeill TJ, Barry SC. Truncated logistic regression. Biometrics 1995; 51: 533-541.
- Gelfand AE, Smith AF, Lee T-M. Bayesian analysis of constrained parameter and truncated data problems using Gibbs sampling. J Am Stat Assoc 1992; 87: 523-532.
- Chen CH, Tsai WY, Chao WH. The product-moment correlation coefficient and linear regression for truncated data. J Am Stat Assoc 1996; 91: 1181-1186.
- Gross ST, Lai TL. Nonparametric estimation and regression analysis with left-truncated and right-censored data. J Am Stat Assoc 1996; 91: 1166-1180.
- Eliason SR. Maximum likelihood estimation: Logic and practice. Sage Publ 1993.
- Quinn K. The newton raphson algorithm for function optimization. University of Washington Seattle 2001.
- Stokes ME, Davis CS, Koch GG. Categorical data analysis using the SAS system. Wiley 2001.
- Lachin JM. Power of the Mantel-Haenszel and other tests for discrete or grouped time-to-event data under a chained binomial model. Stat Med 2013; 32: 220-229.
- Li SM, Li SY, Kang MT, Zhou YH, Li H. Distribution of ocular biometry in 7- and 14-year-old Chinese children. Optom Vis Sci 2015; 92: 566-572.
- Wong HB, Machin D, Tan SB, Wong TY, Saw SM. Ocular component growth curves among Singaporean children with different refractive error status. Investig Ophthalmol Vis Sci 2010; 51: 1341-1347.
- Tong L, Wong EH, Chan YH, Balakrishnan V. A multiple regression approach to study optical components of myopia in Singapore school children. Ophthal Physiol Opt 2002; 22: 32-37.