Research Article - Journal of Agricultural Science and Botany (2018) Volume 2, Issue 2
The vegetation composition, structure and regeneration status of Gole Natural Forest, West Arsi Zone, Oromia Regional State, Ethiopia
Mesfin Belete Hailemariam* and Tamiru Demsis Temam
Wolkite University, Gubrei, Wabe Bridge, Ethiopia
- *Corresponding Author:
- Mesfin Belete Hailemariam
Researcher and instructor
Biology Department
Wolkite University
Gubrei, Wabe Bridge, Ethiopia
E-mail: msbd2006@gmail.com
Accepted on April 20, 2018
Citation: Hailemariam MB, Temam TD. The vegetation composition, structure and regeneration status of Gole Natural Forest, West Arsi Zone, Oromia Regional State, Ethiopia. J Agric Sci Bot. 2018;2(2):10-21.
DOI: 10.35841/2591-7897.2.2.10-21
Visit for more related articles at Journal of Agricultural Science and BotanyAbstract
This study was conducted in Gole natural forest (Dodola) West Arsi Zone of Oromia Regional State, Ethiopia. The study was intended to investigate the vegetation composition, structure, community types and the regeneration status. To collect the vegetation data, systematically 62 plots 20 m × 20 m (400 m2) were established at 100 m interval, starting from the top of the mountain. Tree and shrub species were counted and their cover abundance value was estimated. The data for herbaceous species were collected from five 2 m × 2 m sub-plots laid at the four corners each and one at the centre of the main plot. Height and diameter at breast height (DBH) of all woody species taller than 1.5 m and thicker than 2 cm were measured. R package was applied for cluster analysis. Indicator species analysis was performed in R Interpolated species accumulation curves. Estimate S 8.2 Software and Microsoft Excel were used to analyze the data. Rarefaction was applied to compare the species richness of the plant communities in the study area. Sorensen’s similarity coefficient was used to detect similarities and dissimilarities among communities.
A total of 114 plant species belonging to 57 families and 94 genera were identified. The most dominant families were Asteraceae, followed by Acanthaceae and Lamiaceaae. Out of 114 species 17 were endemic to Ethiopia. The study showed that high density was seen at lower height and DBH classes. Five plant community types were identified. The rarefaction revealed that there is difference in species richness among communities. The Sorensen’s similarity index showed that, there was a difference in the distribution of plant species composition among the five plant communities.
Keywords
Afromontane forest, Gole forest, Rarefaction, Sorensen’s similarity coefficient, Endemic species, Seedlings, Saplings, Population structure, Importance value index.
Introduction
Mountain ecosystems around the globe are known for their high biological diversity and usually have distinct biological communities and high level of endemism, due to their topography [1]. Forest provides a wide range of ecological, economical, social and cultural services and processes [2]. Forests regulate water regimes/as water catchments, cultural and aesthetic services and provide ecosystem services, including nutrient cycling, soil formation, oxygen production, carbon sequestration and prevention of air pollution [3-5]. Mountain forests have a high potential for securing livelihoods by providing non-timber forest products [5,6]. They also used locally to generate income and in traditional foods and medicine [3,5].
Ethiopia has great biodiversity resources due to the diversity in physical features, climate, topography, habitat, vegetation types and fauna [7]. Altitudes range from 126 meters below sea level in the Dalol (Afar) depression, to the highest mountain, Ras Dejen in the Semen Mountains 4,620 meters above sea level [8]. In Ethiopia, environmental degradation and deforestation have been taking place for hundreds of years. Forests in the entire country declined from the original 35% to 16% in 1952, 3.6% by 1980, 2.6% by 1987, and an estimated 2.4% in 1992 [9]. The major threats to the bio diversities are unsustainable utilization of natural resources, deforestation, conversion of natural vegetation to farmland, alien invasive species, climate change and lack of proper policy framework [4,10,11]. This remnant stands of natural forests are found in remote and inaccessible part of the country [12]. Therefore, the recognition of these threats to biodiversity has led to draw conservation strategies to protect from the threats. Thus, availability of accurate data on forest resources is an essential requirement for forest management and planning within the context of sustainable development. Various attempts have been made to study the forests in different parts of the country. Gole natural forest is highly valued for its socio-economic and ecological services. However, the assessment of vegetation composition, structure, distribution and other attributes has not been studied so far in the study area. Therefore, the present study attempts to provide information on the vegetation composition, structure and regeneration status of Gole forest.
Objectives of the Study
General objective
The general objective of this study is to investigate the vegetation of Gole natural forest which could serve as an important input for conservation of the forest in the study area.
Specific objectives
• to explore floristic composition of Gole natural forest
• to analyze the vegetation structure and tree species population structure of Gole forest
• to identify main plant community types in Gole forest
• to investigate the regeneration status of woody species in Gole forest
• to investigate the similarity of Gole Forest with some other forests in Ethiopia regarding its floristic composition.
Research questions
In order to realize the above mentioned research objectives, the following research questions should be answered in the course of this study:
• What plant species are common in Gole forest?
• What the vegetation structure of Gole forest looks like?
• What are the main plant community types in Gole forest?
• Does Gole Forest is similarity with other forests in Ethiopia?
• What does the regeneration status of main woody plants in Gole forest looks like?
Materials and Methods
Location of the study area
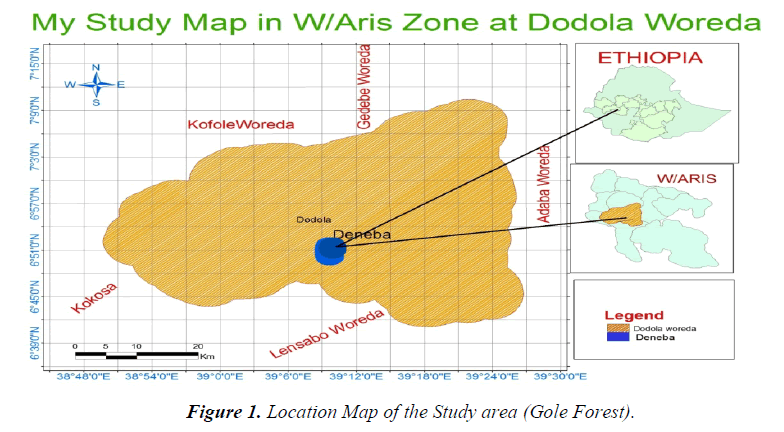
The Gole natural forest is found in Dodola woreda, West Arsi Zone of Oromia Regional state, Ethiopia. It is located in the south-east part of the country 320 km away from the capital city Addis Ababa. The study area is found between latitude 60 51’ and 60 53’ N and longitude 390 11’ and 390 12’E, east of Dodola town in Deneba kebele. The altitudinal range of the study area is between 2728-3480 m a.s.l (Figure 1).
Climatic conditions
Rainfall is bimodal distribution, with the main rainy season occurring between June to September. The dry season lasts from November to February, followed by short rainy season during the months of March and April [13]. There is no metrological station in the study area but the climatic data for the Dodola town recorded by Agricultural Office shows that, the area has a mean annual rainfall of 733 mm and the temperature ranges from 7-24°C [14].
Vegetation
The vegetation of the study area mainly falls in to the Dry-evergreen afromontane forest (1600-3300 m) and the sub-afroalpine (3200-3500 m) vegetation type [3,15]. The forest formation changes along the altitudinal gradient. At the altitude between 2,850-3,000 m a.s.l., Juniperus procera is dominant in association with few Podocarpus falcatus. At the upper zone between 3,000-3,400 m a.s.l., Hagenia abyssinica, Hypericum revolutum and Erica arborea dominate the forest, sometimes mixed with Juniperus procera. Erica arborea occurs as a shrub at its uppermost distribution [16].
Socio-Economic conditions
The human population of the study area was estimated to be 237610 (117494 were male and 120116 were female) of which 27812 (14693 male and 13119 female) were living in the district capital of Dodola [17]. The farming systems are mainly characterized by the presence of subsistence mixed farming, of both livestock and agricultural crop production. There are also many households engaged in collecting and selling forest products. Forest is the main source of fuel wood demand for the whole communities. The forest is just on converting into agricultural and pastures fields [16].
Vegetation data sampling methods
Systematically, plots of 20 m x 20 m (400 m2) were established at every 100 m interval between the plots, starting from the top of the mountain to the lower side. A total of 62 plots were laid for vegetation data collection. For tree and shrub assessment, the 400 m2 plots were sampled. For the collection of herbaceous species 2 m x 2 m (4 m2) sub-plots, four at the four corner of the main plote and one at the center was laid [18].
From each plot, local name (if the local name was not known code of voucher specimen) and voucher specimen for all plants were collected. Abundance and cover-abundance of trees, shrubs, liana and abundance of herbaceous plants were recorded. Height and Diameter at breast height (at 1.30 m above ground) of each woody species having DBH > 2 cm and height of each woody species higher than 1.5 m were recorded. Tree height was measured using Suunto clinometers and meter tape and diameter at breast height measured using meter tape, this measurement was obtained from circumference (d=c/π). Cover-abundance values were estimated following modified 1-9 Braun-Blanquette scale and converted into [19,20]. All plant specimens in the plots were recorded and voucher specimens were pressed and dried. Voucher specimens were identified at National Herbarium of Addis Ababa University Ethiopia. The nomenclature of the plants was based on the published volumes of the Flora of Ethiopia and Eritrea [21-27]. The number of seedlings and saplings were collected to determine the regeneration status of the forest.
Data Analysis
All tree, shrub and herbaceous species recorded in all plots were used in the analysis of the vegetation structure. The percentages of various plant families, DBH and height classes of woody plants in the study area were summarized in pi-chart and bar graphs. Dominance curve was used to rank the relative abundance of the species identified. The vertical structure of tree species was described following the International Union Forestry Research Organization (IUFRO) classification scheme [28]. Seedlings (height less than 1.5 m) and saplings (height between 1.5-3 m) were considered as sapling [29], and measured using the meter tape to estimate the regeneration status of the forest.
Classification and ordination methods were used to describe vegetation types and to examine the relationship between vegetation types and environmental variables. R statistical package [30] was used for cluster and ordination analysis. Indicator species analysis was performed to find indicator species characterizing the communities. Indicator species analysis was performed in R using package labdsv [31]. Interpolated species accumulation curves were used to display the expected number of species in each community type as a function of accumulated number of plots. Estimate S 8.2 software [32] was used to compute the expected species richness and species richness estimators. Sorenson’s index was computed to assess the floristic similarity between the plant communities of the study area. Sorenson's index of similarity (Ss) was computed to assess the floristic similarity between the communities and to compare the association of Gole forest with other five forests in Ethiopia.
Results and Discussion
Floristic composition
A total of 114 species of vascular plants, belonging to 94 genera and 57 families were recorded from 62 plots laid in the forest (Appendix I). The families with the highest number of species were Asteraceae, represented by 21 species (18.42%) belonging to 14 genera, followed by Acanthaceae (5 species) belonging to 5 genera, Lamiaceae (5 species) belonging to 4 genera and Rosaceae (5 species) belonging to 4 genera 13.17% (4.39% each). The remaining families were represented by one or two species.
Growth forms
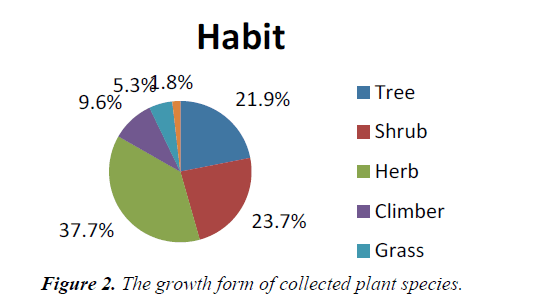
The collected species were composed of 25 (21.9%) trees, 27 (23.7%) shrubs, 43 (37.7%) herbs, 11 (9.6%) climbers, 6 (5.3%) grass and 2 (1.8%) fern. Herbs occupied the highest floristic composition followed by shrubs and trees. Trees and shrubs together contributed 45.6% of the floristic composition (Figure 2).
Plant endemism in gole natural forest
Among the species collected, 17 plant species have been recorded to be endemic to Ethiopia. Herbs, shrubs and climbers constitute 58.82%, 35.29%, and 5.88% respectively. The presence of these endemic species in the forest shows the importance of the conservation process of the forest (Table 1) [33,34].
| No | Scientific Name | Family | Habit | IUCN Category |
|---|---|---|---|---|
| 1 | Acanthus senii | Acanthaceae | Sh | NT |
| 2 | Bidens pachyloma | Asteraceae | H | LC |
| 3 | Conyza spinosa | Asteraceae | Sh | |
| 4 | Echinops ellenbekii | Asteraceae | Sh | EN |
| 5 | Echinops longisetus | Asteraceae | H | LC |
| 6 | Inula conifertiflora | Asteraceae | Sh | NT |
| 7 | Kalanchoe petitiana | Krassulaceae | H | LC |
| 8 | Kniphofia foliosa | Asphodelaceae | H | |
| 9 | Mikaniopsis clematoides | Asteraceae | C | LC |
| 10 | Mytenus addat | Celastraceae | Sh | NT |
| 11 | Sedum mooneyi | Crassulacea | H | |
| 12 | Senecio fresenii | Asteraceae | H | |
| 13 | Senecio myriocephalus | Asteraceae | H | LC |
| 14 | Solanecio gigas | Asteraceae | Sh | LC |
| 15 | Thymus schimperi | Lamiaceae | H | LC |
| 16 | Trifolium calocephalum | Fabaceae | H | |
| 17 | Urtica simensis | Urticaceae | H | LC |
Key: LC = Least Concern; NT = near threatened; EN=endangered; IUCN = International Union for the Conservation of Nature and Natural Resources.
Table 1. Endemic plant species occurring in Gole forest.
The density of selected plant species (Table 2).
| Species | Habit | Density/ha | % |
|---|---|---|---|
| Juniperus procera | Tree | 284.7 | 28 |
| Myrsine melanophloeos | Tree | 218.5 | 21.5 |
| Hypericum revolutum | Tree | 111.3 | 10.9 |
| Podocarpus falcatus | Tree | 95.6 | 9.4 |
| Erica arborea | Tree | 97.2 | 9.6 |
| Mytenus arbutifolia | Tree | 54.4 | 5.4 |
| Myrisine africana | Shrub | 75.4 | 13.5 |
| Discopodium penninervum | Shrub | 70.6 | 12.6 |
| Rubus apetalus | Shrub | 63.7 | 11.4 |
| Inula conifertiflora | Shrub | 58.9 | 10.5 |
| Dovyalis abyssinica | Shrub | 55.6 | 10 |
| Mikaniopsis clematoides | Climber | 81 | 33 |
| Aspargus africanus | Climber | 49.6 | 20.2 |
| Caucanthus auriculatus | Climber | 39.9 | 16.2 |
| Ipomoea involucrate | Climber | 15.7 | 6.4 |
| Clematis hirsuta | Climber | 13.7 | 5.6 |
| Pterolobium stellantum | Climber | 13.3 | 5.4 |
| Helichrysum formosissmum | Herb | 219.9 | 11.9 |
| Kniphofia foliosa | Herb | 170.6 | 9.6 |
| Haplocarpha schimperi | Herb | 160.5 | 9.1 |
| Kalanchoe petitiana | Herb | 152 | 8.6 |
| Myosotis abyssinica | Herb | 141.1 | 7.9 |
| Minulopsis solmisii | Herb | 108.9 | 6.1 |
Table 2. The most abundant plant species in Gole forest.
The above table shows some of the most abundant tree, shrub, climber and herbaceous species in the study area.
DBH-Class distribution
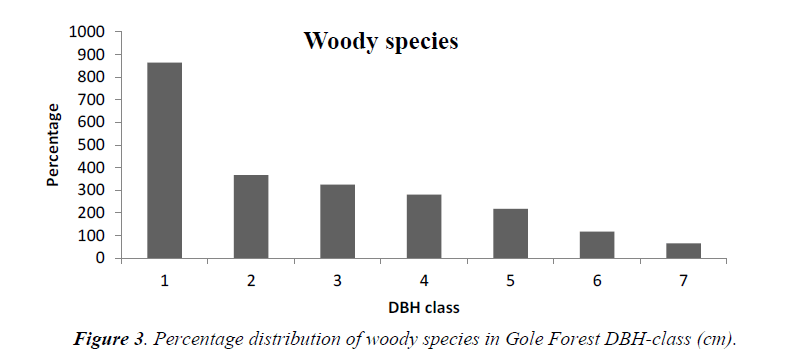
A total of 2236 individuals whose DBH >2 cm were recorded and seven DBH classes were established for DBH analysis. DBH class1 (2-5), 2(5.01-20), 3(20.01-40), 4(40.01-60), 5(60.01-800, 6(80.01-100) and 7 (>100).
The total number of woody species in each DBH class decreased with increasing DBH. The highest density of the populations, 864 (38.6%), were found in the lower DBH class (2-5 cm), while the rest 367 (16.4%), 324 (14.5%), 281 (12.6%), 218 (9.7%), 117 (5.2%), and 65(2.9%), were found between DBH classes 2-7 respectively. This was a normal DBH distribution pattern when viewed from the whole set of plant community, confirming reversed J shape. They exhibited good reproduction and recruitment. But there would be variation when individual species was analyzed separately (Figure 3).
The DBH-class distribution of individual tree species having higher important value index was described below to see the likely future of these trees.
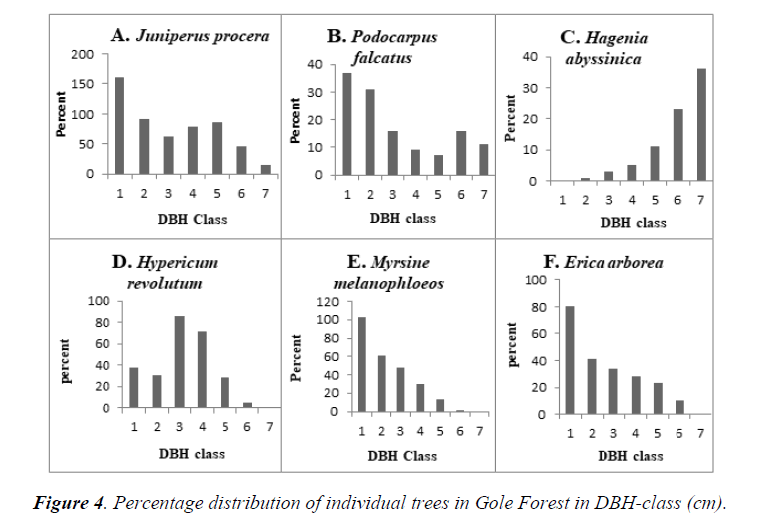
The DBH measurements of Juniperus procera (Figure 4A) shows that highest density 29.7% was found in the lowest DBH-class (2-5 cm) and 16.9%, 11.7%, 14.5%, 15.9%, 8.6% and 2.6% was found DBH class 2-7 respectively. The number of individuals of this tree decrease with increasing DBH class but there is slight increase in DBH class 4 and 5. They are represented by the broken up inverted ‘J’ curve structure, this shows good regeneration but discontinuous recruitment in to larger size. One of the possible reasons for the discontinuity could be selective cutting of a particular size of this tree for different purpose. The local people use medium size of these trees for roof cover of their huts and for making fence and the highest class for timber production as a result the density of these classes was lowered.
The DBH-class of Podocarpus falcatus (Figure 4B) indicates that the highest proportion (29.1%) of this species was found in lower DBH class (1). The trees having (24.4%) and (12.6%) are in the DBH-class 2 and 3 respectively. The remaining proportion (7.1%), 5.5% and 12.6% of these trees was observed to a DBH class between 4, 5 and 6 respectively. The highest DBH class (7) of this tree constitutes 8.7%. They show decreasing pattern of DBH classes up to some limits and then slight increase and finally decreases. This indicates irregular pattern of distribution, due to selective cutting of a particular size for construction, agricultural, fuel wood and other purpose. It indicates good reproduction but poor recruitment.
There was no Hagenia abyssinica (Figure 4C) in the lower DBH class (1). Small proportion of this tree species was found in the DBH-class 2, 3, 4 and 5, which accounts 1.3%, 3.8%, 6.3% and 13.9% respectively. The highest DBH-class 6 and 7 comprise 29.1% and 45.6% respectively. The number of individual of this tree increases with increasing DBH class, as the majority found above 80 cm. This is due to the fact that male and female individuals of Hagenia abyssinica were found on separate plant, which affects the reproductive capacity of the species, which in turn lowers reproduction. The other probable reason could be Hagenia abyssinica is one of the most useful medicinal plants in the area. The female flower parts are used as a remedy for tapeworm infestation, which affects the production of viable seeds to germinate and enhance seedling and young population.
The DBH class distribution of Hypericum revolutum (Figure 4D) also indicate considerable proportion was found in the first DBH class 14.6% and in the second class DBH 11.9%. The largest proportion (33.1%) and (27.7%) was recorded in the third and fourth DBH class respectively. The individuals belonging to the fifth DBH class was 10.8%. The smallest proportion 1.9% of this tree was in the sixth DBH-class. There is no Hypericum revolutum in the seventh DBH class; this is due to the nature of the plants not to grow to higher DBH class.
The DBH class distribution of Myrsine melanophloeos and Erica arborea (Figure 4E and 4F) was shown that high density in the lower DBH class (40.2% and 37%) respectively. The density of Myrsine melanophloeos and Erica arborea decreases with increasing DBH class. They represented by inverted ‘J’ curve structure, this pattern shows good reproduction and regeneration potential. On the other hand the low level of mature trees confirmed that the forest affected by collection of fuel wood, for household consumption, for sale and construction. There is no Myrsine melanophloeos and Erica arborea in the highest DBH class; this is due to the nature of the plants not to grow to higher DBH class (Figure 4).
Height-class distribution
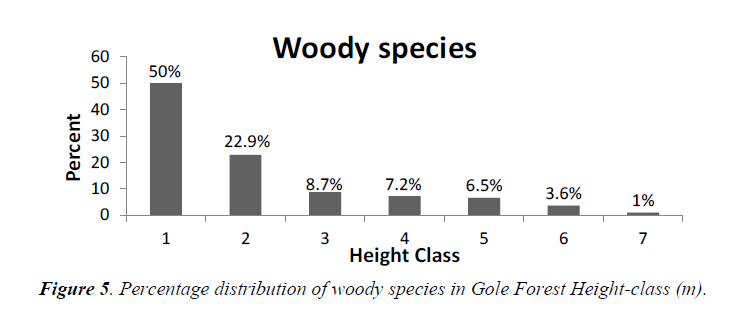
Seven height classes 1) 1.5-5 m, 2) 5.01-10 m, 3) 10.01-15 m, 4) 15.01-20 m, 5) 20.01-25 m, 6) 25.01-30 m, 7) >30.01 m were established. The number of individuals in each successive height class decreased beginning from the lower height class (1.5-5 m) to the highest height class (>30.01 m). Most of the woody species in the study area belongs to the lower height class. The highest height class comprises 9.3/ha (1%) occupied by Juniperus procera (82.6%) and Podocarpus falcatus (17.4%). Juniperus procera is the emergent tree and grow above all trees (Figure 5).
The height distribution patterns of Gole Forest was characterized by fewer individuals at matured stage than middle and young age, suggesting that the Forest was dominated by low height individuals, indicating good regeneration but low recruitment.
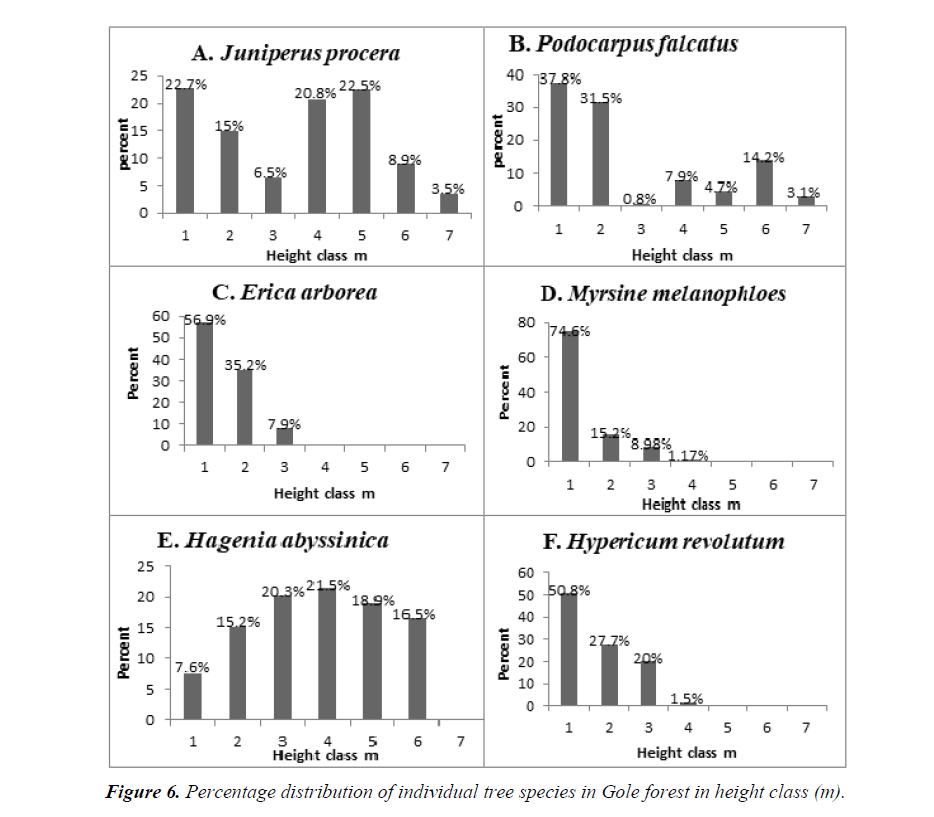
The separate analysis of Juniperus procera from the lower height class (1.5-5 m) to the highest height class (>30.01 m) shows that, 22.7%, 15%, 6.5%, 20.8%, 22.5%, 8.9% and 3.5% respectively. This indicates irregular or Zigzag pattern due to selective cutting for different purpose by the local people, which lower the proportion of medium height class and highest height-classes (Figure 6A).
In Podocarpus falcatus, there is many individuals in the first (37.8%) and second (31.5%) height class but less individuals in third (0.8%), fourth (7.9%), five (4.7%) and seventh (3.1%) height classes and medium number of individuals in the sixth (14.2%) height class. This indicates an irregular pattern of distribution. This kind of distribution is observed when there is selective cutting of trees for a particular purpose (Figure 6B).
Hagenia abyssinica shows slightly a bell-shaped distribution pattern (Figure 6E) due to highest density in the third (20.3%) and fourth (21.5%) height classes, less in the first (7.6%) and second height class (15.2%) and medium height in the fives (18.9%) and sixth (16.5%) height classes. There is no Hagenia abyssinica in the highest height class. This is due to timber production and the separation of male and female plant reduces the number of lower height class.
In Erica arborea (Figure 6C), Myrsine melanoploeos (Figure 6D) and Hypericum revolutum (Figure 6E and F) respectively, all have high density in the lower height class and gradually decreases with increasing height class. They show an inverted “J” shape pattern of height distribution. This is due to less human interference as they are found at the highest altitude and the nature of the tree not to grow in to the highest height class (Figure 6).
Vertical structure
The vertical structure of tree species was analyzed in to three vertical layers. These are upper storey (top height > 30 m), middle storey (height between 15-30 m) and lower storey (height <15 m) [28].
The lower storey contributed to 77.3% of all tree species. The most dominant trees in the lower story was Hypericum revolutum (18.3%), Myrsine melanophloeos (18%), Juniperus procera (17%), Erica arborea (15.4%), Mytenus arbutifolia (6.9%), Podocarpus falcatus (6.4%) and the remaining accounts less than 3% each. The middle storey (15-30 m), contributed about 21.4% of the tree species. This layer was dominated by Juniperus procera (76.8%), Hagenia abyssinica (11.6%), Prunus africana (1.3%), Podocarpus falcatus (8.8%), Ficus sur (1.5%) and the remaining contributed less than 1% each. The upper storey contributes only 1.3% of the total individual’s trees in the forest. The two dominant emergent tree species in this layer were Juniperus procera (82.6%) and Podocarpus falcatus (17.4%). Only two tree species (9%) were common to all storeys. In general, the percent of tree densities in lower, middle and upper storey was found to be 564.1/ha, 156.5/ha and 9.3/ha respectively (Table 3).
| Storey | Density/ha | No of species | % |
|---|---|---|---|
| Lower | 564.1 | 22 | 77.3 |
| Middle | 156.5 | 12 | 21.4 |
| Upper | 9.3 | 2 | 1.3 |
Table 3. The percentage distribution of trees in lower, middle and upper strata.
Basal area
The total basal area of tree species in Gole Forest was calculated from DBH data and it was found to be 49.2 m2/ha. About 90.8% of the total basal area is contributed by Juniperus procera 33.3%, Hagenia abyssinica 17.9%, Hypericum revolutum 11.6%, Podocarpus falcatus 8.9%, Erica arborea 7.9%, Mytenus arbutifolia 5.9% and Myrsine melanophloeos 5.3%. Species with the highest basal area do not necessarily have the highest density, indicating size difference between the species [35]. Myrsine melanophloeos have highest density but low in basal area and Hagenia abyssinica have low density but high in basal area. Therefore, the trees belonging to higher DBH classes contribute higher to the total basal area than trees with low DBH class. Basal area provides a better measure of the relative importance of the species than simple stem count [36]. Thus, Species with the largest basal area can be considered as the most important species in the forest (Table 4).
| No | Species | Basal Area m2/ha | % |
|---|---|---|---|
| 1 | Allophylus abyssinicus | 0.02 | 0.04 |
| 2 | Buddleja polystachya | 0.01 | 0.02 |
| 3 | Dombeya torrida | 0.9 | 1.8 |
| 4 | Ekebergia capensis | 0.1 | 0.2 |
| 5 | Erica arborea | 3.9 | 7.9 |
| 6 | Ficus sur | 0.4 | 0.8 |
| 7 | Galiniera saxifraga | 0.6 | 1.2 |
| 8 | Hagenia abyssinica | 8.8 | 17.9 |
| 9 | Hypericum revolutum | 5.7 | 11.6 |
| 10 | Ilex mitis | 0.1 | 0.2 |
| 11 | Juniperus procera | 16.4 | 33.3 |
| 12 | Maesa lanceolata | 0.1 | 0.2 |
| 13 | Myrsine melanophloeos | 2.6 | 5.3 |
| 14 | Mytenus arbutifolia | 2.9 | 5.9 |
| 15 | Nuxia congista | 0.7 | 1.4 |
| 16 | Olea europea sub.sp.cuspidata | 0.6 | 1.2 |
| 17 | Olinia rachetiana | 0.1 | 0.2 |
| 18 | Pittosporum viridiflorum | 0.1 | 0.2 |
| 19 | Podocarpus falcatus | 4.4 | 8.9 |
| 20 | Prunus africana | 0.3 | 0.6 |
| 21 | Rhamnus staddo | 0.2 | 0.4 |
| 22 | Schefflera volkensii | 0.3 | 0.6 |
| Total | 49.2 | 100 |
Table 4. The Basal area of trees (m2/ha) and their percentage contributions.
Frequency
Frequency is the indication of homogeneity and heterogeneity of given vegetation in which the higher number of species in higher frequency classes and low number of species in lower frequency classes show similar species composition while large number of species in lower frequency classes and small number of species in higher frequency classes indicates higher heterogeneity (Table 5) [37].
| Species | Habit | No of plot present | Total plot sampled | % |
|---|---|---|---|---|
| Erica arborea | Tree | 18 | 62 | 29 |
| Hagenia abyssinica | " | 26 | 62 | 41.9 |
| Hypericum revolutum | " | 28 | 62 | 45.2 |
| Juniperus procera | " | 55 | 62 | 88.7 |
| Myrsine melanophloeos | " | 47 | 62 | 75.8 |
| Mytenus arbutifolia | " | 24 | 62 | 38.7 |
| Podocarpus falcatus | " | 24 | 62 | 38.7 |
| Rubus apetalus | Shrub | 49 | 62 | 79 |
| Discopodium penninervum | " | 28 | 62 | 45 |
| Rosa abyssinica | " | 26 | 62 | 42 |
| Mikaniopsis clematoides | Climber | 40 | 62 | 65 |
| Aspargus africanus | " | 35 | 62 | 56.5 |
| Caucanthus auriculatus | " | 24 | 62 | 39 |
| Helichrysum formosissmum | Herb | 42 | 62 | 68 |
| Kalanchoe petitiana | " | 31 | 62 | 50 |
| Myosotis abyssinica | " | 31 | 62 | 50 |
| Carduus nyassanus | " | 30 | 62 | 48 |
| Haplocarpha schimperi | " | 29 | 62 | 47 |
| Kniphofia foliosa | " | 27 | 62 | 44 |
| Cyanoglossum amplifolium | " | 27 | 62 | 44 |
Table 5. List of the most frequent plant species in Gole Forest.
The above table shows the most frequent herb, climber, shrub and tree species of Gole forest. Gole forest is heterogeneous in its diversity.
Importance value index (IVI)
The importance value index of tree species in Gole Forest is given in Table 6. The highest IVI of Juniperus procera was as a result of high relative frequency, relative density and relative dominance. In Hagenia abyssinica the highest basal area made the species to have large value of relative dominance and hence got the highest Importance value index (Table 6).
| No | Species | Relative Frequency | Relative density | Relative dominance | Importance value index |
|---|---|---|---|---|---|
| 1 | Allophylus abyssinicus | 0.9 | 0.2 | 0.04 | 1.14 |
| 2 | Buddleja polystachya | 0.6 | 0.2 | 0.02 | 0.82 |
| 3 | Dombeya torrida | 2.5 | 1.8 | 1.8 | 6.1 |
| 4 | Ekebergia capensis | 1.9 | 0.6 | 0.2 | 2.7 |
| 5 | Erica arborea | 5.5 | 9.6 | 7.9 | 23 |
| 6 | Ficus sur | 0.3 | 0.5 | 0.8 | 1.6 |
| 7 | Galiniera saxifraga | 4.6 | 1.3 | 1.2 | 7.1 |
| 8 | Hagenia abyssinica | 7.9 | 3.3 | 17.9 | 29.1 |
| 9 | Hypericum revolutum | 8.6 | 10.9 | 11.6 | 31.1 |
| 10 | Ilex mitis | 0.3 | 0.08 | 0.2 | 0.58 |
| 11 | Juniperus procera | 16.9 | 28 | 33.3 | 78.2 |
| 12 | Maesa lanceolata | 0.6 | 0.5 | 0.2 | 1.3 |
| 13 | Myrsine melanophloeos | 14.5 | 21.5 | 5.3 | 41.3 |
| 14 | Mytenus arbutifolia | 7.4 | 5.4 | 5.9 | 18.7 |
| 15 | Nuxia congista | 4.9 | 1.7 | 1.4 | 8 |
| 16 | Olea europea sub.sp.cuspidata | 4.6 | 2.5 | 1.2 | 8.3 |
| 17 | Olinia rachetiana | 1.9 | 0.5 | 0.2 | 2.6 |
| 18 | Pittosporum viridiflorum | 1.9 | 0.4 | 0.2 | 2.5 |
| 19 | Podocarpus falcatus | 7.4 | 9.4 | 8.9 | 25.7 |
| 20 | Prunus africana | 0.9 | 0.3 | 0.6 | 1.8 |
| 21 | Rhamnus staddo | 1.2 | 0.6 | 0.4 | 2.2 |
| 22 | Schefflera volkensii | 4.6 | 0.9 | 0.6 | 6.1 |
| Total | 299.94 |
Table 6. Importance value index of trees species in Gole Forest.
The most dominant and ecologically important tree species of Gole Forest were Juniperus procera, Myrsine melanophloeos, Hypericum revolutum, Hagenia abyssinica, Podocarpus falcatus and Erica arborea. The leading dominant and ecologically most significant species might also be the most successful species [36]. Priority for conservation should be given based on their Importance value index values. i.e. the first priority for species with least Importance value index because they are at risk of local extinction and the last priority of conservation for species with highest Importance value index.
Vegetation community classification
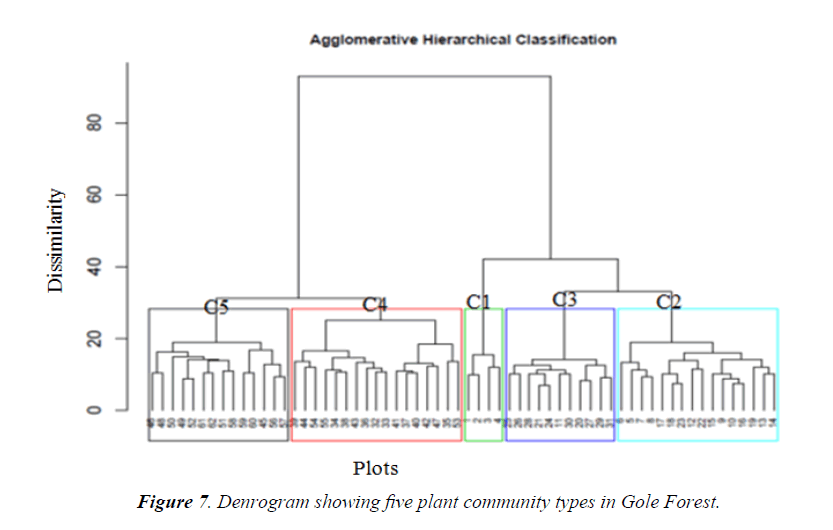
The plant community types were recognized using Agglomerative hierarchical cluster analysis. Communities were identified on the basis of quadrats grouping by similarity [38,39]. Agglomerative hierarchical cluster analysis revealed that there are five main plant communities in the study area, designated as community 1, 2, 3, 4, and 5 as shown in (Figure 7).
The dendrogram yields five plant Community types.
Community1: includes plot: 1, 2, 3 and 4
Community2: includes plot: 5,6,7,8,9,10,12,13,14,15,16,17,18 ,19,22 and 23
Community 3: includes plot: 11,20,21,24,25,26,27,28,29,30 and 31
Community 4: includes plot: 32,33,34,35,36,37,38,39,40,41,42 ,43,44,47,53,54 and 55
Community 5: includes plot: 45,46,48,49,50,51,52,56,57,58,59 ,60,61 and 62
The species with highest indicator values are bolded and used for naming the communities. The indicator values are determined by combining the relative abundance and relative frequencies of each species. The indicator values of the species are considered as significant if the respective probability values are less than 0.05 (Table 7) [40].
| Species | Community | Indicator value | P* Value |
|---|---|---|---|
| Thymus schimperi | 1 | 89.47 | 0.001 |
| Isolepis setacea | 1 | 75 | 0.001 |
| Erica arborea | 1 | 65.91 | 0.001 |
| Cyprus fischerianus | 1 | 65.25 | 0.001 |
| Crepis reupeli | 1 | 55.44 | 0.004 |
| Arsaema schimperiana | 1 | 50 | 0.007 |
| Festuca abyssinica | 1 | 47.06 | 0.005 |
| Helichrysum splendidum | 1 | 47.06 | 0.004 |
| Conyza spinosa | 1 | 46.85 | 0.002 |
| Helichrysum foetidium | 1 | 46.67 | 0.002 |
| Crinium abyssinicum | 1 | 42.58 | 0.004 |
| Gnaphalium rubriflorum | 1 | 41.8 | 0.008 |
| Trifolium qurtinianum | 1 | 29.34 | 0.032 |
| Bides pachyloma | 2 | 56.62 | 0.002 |
| Hypericum revolutum | 2 | 46.36 | 0.003 |
| Carduus nyasanus | 2 | 36.84 | 0.022 |
| Cyanatis berbata | 2 | 26.77 | 0.045 |
| Stellaria senii | 2 | 25.62 | 0.041 |
| Periploca linearifolia | 2 | 25 | 0.023 |
| Discopodium penninervum | 3 | 46.48 | 0.001 |
| Hagenia abyssnica | 3 | 43.59 | 0.009 |
| Myrsine melanophloeos | 3 | 34.49 | 0.002 |
| Kalanchoe petitiana | 3 | 34.23 | 0.036 |
| Kniphofia foliosa | 3 | 31.33 | 0.035 |
| Juniperus procera | 3 | 31.16 | 0.001 |
| Myrsine africana | 4 | 72.37 | 0.001 |
| Osyris qudripartita | 4 | 40.64 | 0.007 |
| Inula conifertiflora | 4 | 39.68 | 0.008 |
| Nuxia congista | 4 | 38.96 | 0.007 |
| Minulopsis solmisi | 4 | 36.31 | 0.014 |
| Dombeya torrida | 4 | 34.83 | 0.013 |
| Olea europea sub sp cuspidata | 4 | 30.35 | 0.038 |
| Dryopteris anthemantica | 4 | 26.89 | 0.028 |
| Podocarpus falcatus | 5 | 76.76 | 0.001 |
| Mytenus arbutifolia | 5 | 59.95 | 0.001 |
| Dovyalis abyssinica | 5 | 53.97 | 0.002 |
| Solanum indicum | 5 | 46.76 | 0.009 |
| Rosa abyssinica | 5 | 44.46 | 0.009 |
| Mikaniopsis clematoids | 5 | 38.68 | 0.003 |
| Myosotis abyssinica | 5 | 34.31 | 0.032 |
| Mytenus addat | 5 | 24.85 | 0.04 |
| Carduus camaecephalus | 5 | 21.43 | 0.022 |
| Prunus africana | 5 | 21.43 | 0.023 |
Table 7. List of Species with significant indicator values (in percentage) in each community and the montecarlo test of significance (P*).
The five plant communities which were identified in the study area are described as follows:
Community 1: Erica arborea-Conyza spinosa community type: This community type was found at the highest altitude ranging between 3388 and 3480 m a.s.l. This community resulted from 4 plots and 27 species. The tree layer was highly dominated by Erica arborea and the shrub layer by Conyza spinosa. The dominant herbaceous species of this community was Thymus schimperi, Isolepis setacea, Crepis reupeli, Helichrysum splendidum, Crinium abyssinicum, Gnaphalium rubriflorum and Trifolium quartinianum and the grass species of this community was Cyprus fischirianus and Festuca abyssinica.
Community 2: Hypericum revolutum community type: There were 16 plots and 50 species included in this community and found at an altitude between 3173 and 3350 m a.s.l. The tree layer was dominated by Hypericum revolutu. The herbaceous species of this community type includes Bidens pachyloma, Carduuus nyassanus, Cyanatis berbata, Stellaria senni and Periploca linearifolia.
Community 3: Hagenia abyssinica-Myrsine melanophloeos- Juniperus procera community: This community type was found at an altitudinal ranging between 3050 and 3275 m a.s.l. The community consists of 11 plots and 40 species. The tree layer of this community was dominated by Hagenia abyssinica, Myrsine melanophloeos, Juniperus procera and the dominant shrub of this community was Discopodium penninervum and the herbaceous species of this community was Kalanchoeo petitiana and Kniphofia foliosa.
Community 4: Nuxia congista-Myrsine africana-Osyris quadripartita community type: This community type was composed of 17 plots and 78 species and located at an altitude between 2758 and 3040 m a.s.l. The tree layer was dominated by Nuxia congista, Dombeya torrida, Olea europea subsp. cuspidata and the dominated shrub of this community was Myrsine africana, Osyris quadripartita and Inula conifertiflora. The dominated herbacious species was Minulopsis solmisii and Dryopteris anthamantica.
Community 5: Podocarpus falcatus-Mytenus arbutifolia- Dovyalis abyssinica community type: This community type was found at the lowest altitude ranging between 2728 and 2863 m a. s. l. The community consists of 14 plots and 75 species. The dominant tree species of this community type was Podocarpus falcaatus, Mytenus arbutifolia and Prunus africana, and the shrub layer of this community was dominated by Dovyalis abyssinica, Rosa abyssinica and Mytenus addat. The herbaceous species dominating this community was Myosotis abyssinica and Carduus camaecephalus, and the dominant climber of this community was Mikaniopsis clematoids.
Community Similarity Analysis
Sorenson's coefficient of similarity was computed to see whether communities and species composition is discontinuous or continuous (Table 8).
| Community | 1 | 2 | 3 | 4 | 5 |
|---|---|---|---|---|---|
| 1 | 1 | - | |||
| 2 | 0.26 | 1 | - | ||
| 3 | 0.2 | 0.41 | 1 | - | |
| 4 | 0.18 | 0.36 | 0.44 | 1 | - |
| 5 | 0.11 | 0.26 | 0.4 | 0.59 | 1 |
Table 8. Sorenson’s coefficient of Similarity between the Plant Communities of Gole Forest.
Sorenson's coefficient of similarity on the species composition between communities indicates that, community one shares more species with communities two (26%) and three (22%) but relatively low with community four (18%) and five (11%). Community two shares more species with community three (41%) and four (36%) and relatively less species with community five (26%). Community three shares more species with community four (44%) than with community five (40%). Community four share more species with community five (59%) than any other communities.
Gradual change in species composition and diversity was observed in the study area. The overall similarity coefficient ranges from 11-59% among all the communities. The highest similarity was observed between community four and five (59%), three and four (44%) and two and three (41%). This is due to existence of most quadrates adjacent to each other and similarity in altitudes that shows the availability of nutrient needed by those species and the adaptation of plants to that particular environment. The lowest similarity was observed between community one and five (11%), one and four (18%) and one and three (20%), this shows that community having nearly similar altitude have more species in common than communities occupying different altitude. If two sites have similar vegetation they have similar environment and if two sites have different vegetation they have different environment [41].
Species richness comparison
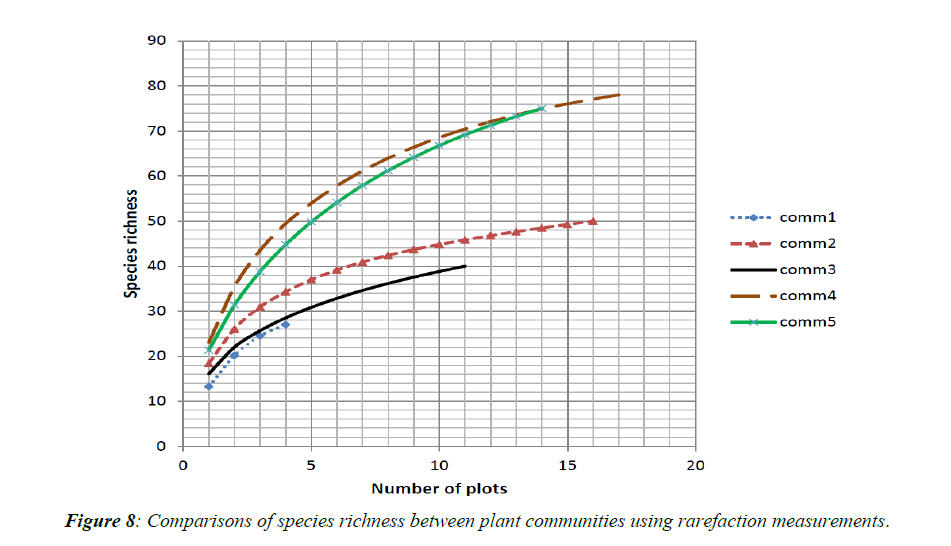
The rarefaction curves shows that, species richness was greater in community four (50), followed by community five (44), while species richness in community two (34) was intermediate but in community three (28) and one (27) is less. The species evenness also greater in community four, as the rarefaction curve is steeper followed by community five. Less even distribution of species was observed in community one, three and two as the rarefaction curve is relatively less steep (Figure 8).
The reason why community four has the highest species richness is that there are fewer disturbances in this community and mainly cover with shrubs which is less valuable woody species for commercial purpose and also resistant to wild animal and livestock grazing, like Osyris quadripartita and Myrsine africana. In community five at low elevation, even if disturbance level is greater, species richness is high next to community four; this is because of moderate conditions which permit rapid resource acquisition which is favorable for most plant growth. In community three and two the decrease in species richness than community four and five is due to disturbance and increase in altitude. The decrease in species richness of community one which is found at the highest altitude could be due to eco-physiological constraints, such as reduced growing season, low temperature and low productivity and other factors such as soil fertility and soil acidity. The soil pH decreases with increasing altitude and as a result the soil acidity increases with rising altitude and this could affect the chemical reaction between plant roots and nutrients and microbial activity.
