Research Article - Biomedical Research (2017) Volume 28, Issue 18
The diagnostic value of parallel detection of cytokeratin 19 fragment-based tumor markers in malignant pleural effusion: a systematic review and metaanalysis
Yan Gu1, Xiaojuan Qiao2, Lihong Wang1 and Xiuhua Fu1*
1Department of Respiratory and Critical Care Medicine, Affiliated Hospital of Inner Mongolia Medical University, Hohhot, Inner Mongolia, P. R. China
2Affiliated Hospital of Inner Mongolia Medical University, Hohhot, Inner Mongolia, P.R. China
- *Corresponding Author:
- Xiuhua Fu
Department of Respiratory and Critical Care Medicine
Affiliated Hospital of Inner Mongolia Medical University
Hohhot, Inner Mongolia, P. R. China
Accepted date: August 29, 2017
Abstract
Background: Cytokeratin 19 Fragment (CYFRA 21-1) is one of the commonly used tumor markers in clinical practice. The examination of CYFRA 21-1 in pleural effusions may help establish the diagnosis of Malignant Pleural Effusion (MPE). However, given the relatively low sensitivity, it is often used in combination with other tumor markers. Thus, we performed this systematic review and meta-analysis, aiming to explore the diagnostic performance of parallel diagnostic algorithms based on CYFRA 21-1 in MPE.
Material and Methods: The databases of Pubmed, Embase and the Cochrane Library were searched from their inception to February 2015 for eligible studies. We included studies that reported the performance of CYFRA 21-1 plus another tumor marker for diagnosing MPE. The STATA software was employed for data analysis, using the bivariate random-effects model. However, when only less than four records were included, the Meta-Disc software was used for data processing.
Results: Eleven studies assessed the diagnostic performance of pleural CYFRA 21-1 plus CEA for MPE. The pooled data showed that the sensitivity was 88% (76%-94%) and the specificity was 87% (83%-90%). The Positive Likelihood Ratio (PLR) was 6.6 (4.8-8.9), and the negative LR (NLR) was 0.14 (0.07-0.29). Four studies reported the diagnostic accuracy of pleural CYFRA 21-1 plus serum CYFRA 21-1 in MPE. The aggregated results revealed that the sensitivity was 76% (66%-84%), with a specificity of 87% (75%-93%). The PLR was 5.7 (2.8-11.5), with a NLR of 0.28 (0.19-0.41).
Conclusions: The parallel diagnostic algorithms, including pleural CYFRA 21-1 plus CEA, and pleural CYFRA 21-1 plus serum CYFRA 21-1, showed satisfactory and reliable diagnostic values in MPE. When compared with single tumor marker, the parallel test substantially increased the sensitivity and the diagnostic accuracy.
Keywords
Cytokeratin 19 fragment, Malignant pleural effusion (MPE), CEA
Introduction
Malignant Pleural Effusion (MPE) is common in cancer patients and most commonly secondary to lung cancer, breast cancer, lymphoma and pleural mesothelioma etc. [1]. Autopsy data show that MPE occurs in approximately 15% of cancerrelated deaths [2]. In the United States, there are about 100,000 new cases of MPE each year, 43% of which are hospitalized due to MPE [3]. Moreover, median survival time is greatly reduced to only 3-12 months in cancer patients with MPE [4]. MPE is the primary cause of pleural effusions, and approximately 42-77% of pleural effusions are caused by malignancies [1].
Detection of tumor markers in pleural fluid is important for distinguishing benign and malignant pleural effusions. However, a single tumor marker has significant limitations in establishing a definite diagnosis. Two meta-analyses were performed to compare the diagnostic value of common tumor markers in MPE, such as CA 19-9, CEA, CA 15-3, CA 125, and cytokeratin 19 fragments (CYFRA 21-1). They found that the use of a single tumor marker was unable to obtain satisfactory diagnostic performance, and high specificity (>90%) and low sensitivity (<80%) were generally presented. Although CYFRA 21-1 has a relatively high diagnostic sensitivity, it was only about 60% [5,6].
CYFRA-21-1 is a fragment of cytokeratin 19. Cytokeratin forms the cytoskeleton together with actin filaments and microtubules, which is one of the important features of epithelial cells [7]. Cytokeratin family consists of 20 polypeptides with different molecular weights and isoelectric points. They are insoluble in plasma, but can form some plasma soluble fragments after protease hydrolysis. Among them, cytokeratin 19 is a cytokeratin molecule with a minimum molecular weight of 40 kDa [8]. It itself is not organ-specific or tumor-specific. However, its hydrolysis product, cytokeratin 19 fragment, is increased in the serum of patients with malignant tumors, especially in patients with lung cancer. Moreover, this marker is closely related with the prognosis of lung cancer, especially non-small cell lung cancer [9-12]. As this fragment can be detected by the use of two monoclonal antibodies, BM21-1 and KS19-1, it is also called cytokeratin fragment [13].
As combined diagnostic method, the parallel test can increase sensitivity. The parallel detection of various tumor markers in pleural fluid is the most direct and easy way to improve diagnostic sensitivity. However, there are many different combinations in parallel tests. Given the relatively high sensitivity of CYFRA 21-1 in the diagnosis of MPE, assessing and comparing the advantages and disadvantages of pleural fluid CYFRA 21-1-based parallel tests (e.g., CYFRA 21-1+CEA, CYFRA 21-1+CA125) has important value in further improving the accuracy of MPE diagnosis. However, different conclusions have been drawn from different studies about the same parallel test. Huang et al. reported that the combination of CYFRA 21-1 with CEA had a sensitivity of 97.6% and a specificity of 91.4% [14]. In contrast, Lai et al. found a sensitivity of 72% and a specificity of 89% for the same combination [15]. Currently, the understanding of parallel test lacks strong evidence-based support. In view this, this paper intends to systematically evaluate different studies by diagnostic meta-analysis.
Methods
Search strategy
The meta-analysis was performed in accordance with the PRISMA guidelines [16]. Pubmed, Embase and Cochrane Library databases were searched from to February 2016. The following search strategy was mainly used: “pleural effusion” AND (“cytokeratin 19 fragment” OR “CYFRA 21-1” OR cytokeratin fragment”). Only English-language articles were included. References of included articles were also searched to avoid omission.
Inclusion and exclusion criteria
The following inclusion criteria were established: (1) The full text was available, and published in English; (2) Both patients with benign pleural effusion and with MPE were enrolled, detection results of pleural fluid CYFRA 21-1 were reported, the value of using pleural fluid CYFRA 21-1 in parallel with other commonly used tumor markers (e.g., CEA, CA19-9, CA15-3 and CA125) or blood CYFRA 21-1 in the diagnosis of MPE was assessed; only the combination of CYFRA 21-1 with another marker was discussed in this paper; (3) The sensitivity and specificity of the marker combination in the diagnosis of MPE can be extracted directly from the text or can be indirectly calculated; (4) Cytological or histopathological evidence was used as the reference standard of diagnosis.
The exclusion criteria were established as follows: (1) The full text was not available or published in English; (2) Only patients with MPE were included, with no comparison with those with benign pleural effusion; (3) Data were only available for diagnosis using CYFRA 21-1, or using CYFRA 21-1 combined with two or more markers (the number of markers used in combination ≥ 3).
Data extraction and study quality assessment
The following information was extracted independently by two authors Yan Gu and Xiaojuan Qiao) from each of the included studies: author, year of publication, study type, region, sample size, age, sex ratio, reference standard, type of combination used for detection, critical value, and type of tumor that caused secondary MPE. In addition, sensitivity, specificity, and diagnostic odds ratio of the studied markers were directly extracted or indirectly calculated. Quality of included studies was assessed with version 2 of the Quality Assessment of Diagnostic Accuracy Studies (QUADAS-2) [17]. QUADAS-2 includes 11 items in four domains: (1) Patient selection: a. Was a consecutive or random sample of patients enrolled? b. Was a case-control design avoided? c. Did the study avoid inappropriate exclusions? (2) Index test: a. Were the index test results interpreted in a blinded fashion? b. If a threshold was used, was it pre-specified? (3) Reference standard: a. Is the reference standard likely to correctly classify the target condition? b. Were the reference standard results interpreted in a blinded fashion? (4) Flow and timing: a. Was there an appropriate interval between index test(s) and reference standard? b. Did all patients receive a reference standard? c. Did all patients receive the same reference standard? d. Were all patients included in the analysis? Three options, yes, no, and unclear, were provided for each item.
Statistical analysis
When ≥ 4 studies were included, meta-analysis was performed in STATA (version 13.0, Stata Corp) using a bivariate randomeffects model (midas and metani modules), which has been widely recommended and applied in recent years [18]. However, the model requires that no less than four studies are included [19]. Therefore, when STATA was not applicable, meta-analysis was performed in the traditional diagnostic meta-analysis software Meta-Disc (version 1.4, Ramony Cajal Hospital, Madrid, Spain) using a DerSimonian and Laird random-effects model [20]. Statistical effect size values and their 95% confidence intervals to be calculated include: sensitivity (Sen), specificity (Spe), positive likelihood ratio (PLR), negative likelihood ratio (NLR), and diagnostic odds ratio (DOR). Meta-analysis of data was performed using a bivariate random effects model [21]. In addition, a summary receiver operating characteristic (SROC) curve was constructed. Publication bias was qualitatively assessed by constructing a funnel plot, and quantitatively assessed by regression analysis [22].
Between-study heterogeneity was measured by I2. I2>50% was considered to represent significant heterogeneity [23]. If the meta-disc software was applied, the focus was on the heterogeneity caused by threshold and non-threshold effects. The threshold effect was evaluated by analyzing the SROC curve and calculating the Spearman correlation coefficient. If the SROC curve exhibited a “shoulder-arm” shape, and/or the P value of Spearman correlation coefficient was <0.05, a threshold effect existed [20]. If there was a threshold effect, the best way to merge data was to fit the SROC curve and calculate AUC [24]. If there was no threshold effect, then Sen, Spe and other statistics were calculated, the SROC curve was constructed, and AUC was calculated. In all statistical analyses, P<0.05 was considered statistically significant.
Results
Document retrieval
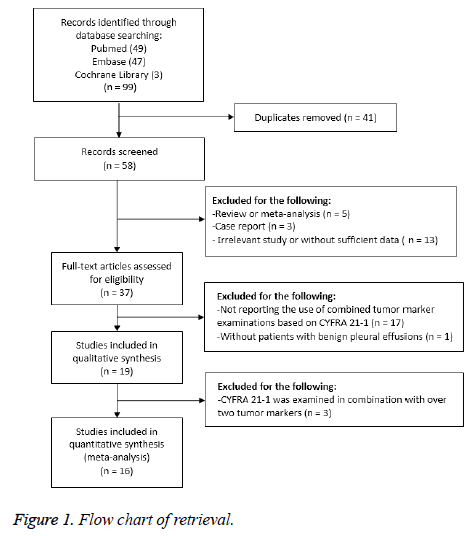
The preliminary database search identified 99 articles, including 49 from Pubmed, 47 from Embase, and 3 from Cochrane. After 41 duplicate articles were excluded, the title and abstract of the remaining 58 articles were reviewed and screened.
Next, 21 articles with an ineligible study type or irrelevant content were excluded. The remaining 37 full-text articles were included in the assessment. After that, 18 articles without combined detection results or a benign pleural effusion control group, and 3 articles that combined three or more markers were excluded.
Finally, 16 articles were included in the systematic review and meta-analysis. The retrieval process is detailed in Figure 1.
Characteristics and quality assessment of included studies
The included studies were published from 1998 to 2015. Among them, eight were conducted in Asian populations, five in European populations, two in African populations and one in South American populations [10,14,15,25-36]. Six of them were prospective studies [10,26,28,31,34,37]; the remainder were retrospective analyses. Sample size ranged from 40 to 196.
Cytology or pathology was the reference standard of diagnosis in all these studies. The results of study quality evaluation using QUADAS-2 are shown in Table 1. All the included studies met the requirements of all items, except that the reference standard results were not interpreted in a blinded fashion (16/16), and that the index test results were not interpreted in a blinded fashion (12/16).
| Study | Was a consecutive or random sample of patients enrolled? | Was a case-control design avoided? | Did the study avoid inappropriate exclusions? | Were the index test results interpreted without knowledge of the results of the reference standard? | If a threshold was used, was it pre-specified? | Is the reference standard likely to correctly classify the target condition? | Were the reference standard results interpreted in a blinded fashion? | Was there an appropriate interval between index test(s) and reference standard? | Did all patients receive a reference standard? | Did all patients receive the same reference standard? | Were all patients included in the analysis? |
|---|---|---|---|---|---|---|---|---|---|---|---|
| Salama et al. | Unclear | Yes | Unclear | No | Yes | Yes | No | Yes | Yes | Yes | Yes |
| Ferrer et al. | Yes | Yes | Yes | No | Yes | Yes | No | Yes | Yes | Yes | Yes |
| Lai et al. | Unclear | Yes | Unclear | No | Yes | Yes | No | Yes | Yes | Yes | Yes |
| Alata et al. | No | Yes | No | Yes | Yes | Yes | No | Yes | Yes | Yes | Yes |
| Dejsomritrutai et al. | Yes | Yes | Yes | No | Yes | Yes | No | Yes | Yes | Yes | Yes |
| Lyubimova et al. | No | No | Unclear | No | No | Yes | No | Yes | Yes | Yes | Yes |
| Lee et al. | No | No | Yes | Yes | Yes | Yes | No | Yes | Yes | Yes | Yes |
| Shitrit et al. | Yes | Yes | Yes | Yes | No | Yes | No | Yes | Yes | Yes | Yes |
| Wagner et al. | Yes | Yes | Yes | No | Yes | Yes | No | Yes | Yes | Yes | Yes |
| Wu et al. | Yes | Yes | Yes | No | Unclear | Yes | No | Yes | Yes | Yes | Yes |
| Li et al. | Unclear | No | No | Yes | Yes | Yes | No | Yes | Yes | Yes | Yes |
| Huang et al. | Yes | Yes | Unclear | No | Yes | Yes | No | Yes | Yes | Yes | No |
| Farag et al. | No | No | Yes | No | Yes | Yes | No | Yes | Yes | Yes | Yes |
| Han et al. | Yes | Yes | Unclear | No | Yes | Yes | No | Yes | Yes | Yes | Yes |
| Son et al. | Yes | Yes | No | No | Yes | Yes | No | Yes | Yes | Yes | Yes |
| El-Shimy et al. | Unclear | No | Unclear | No | Yes | Yes | No | Yes | Yes | Yes | Yes |
Table 1. Evaluation of study quality by QUADAS-2.
Combined use of CYFRA 21-1 and CEA in pleural fluid
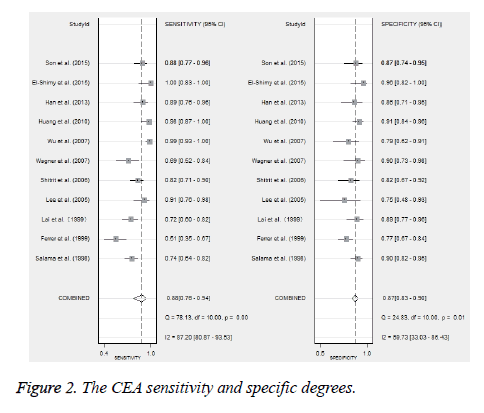
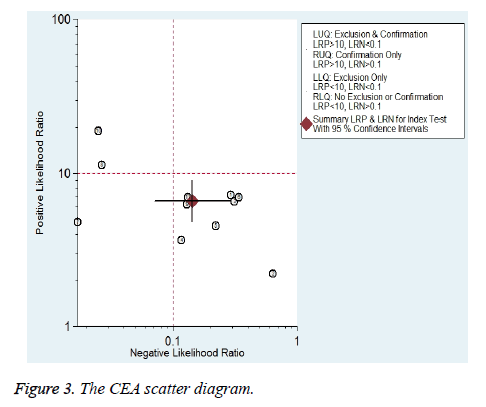
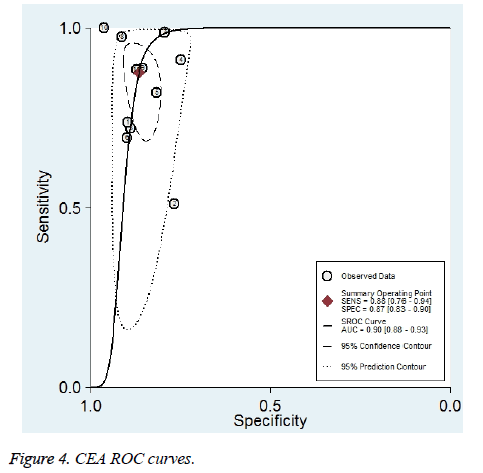
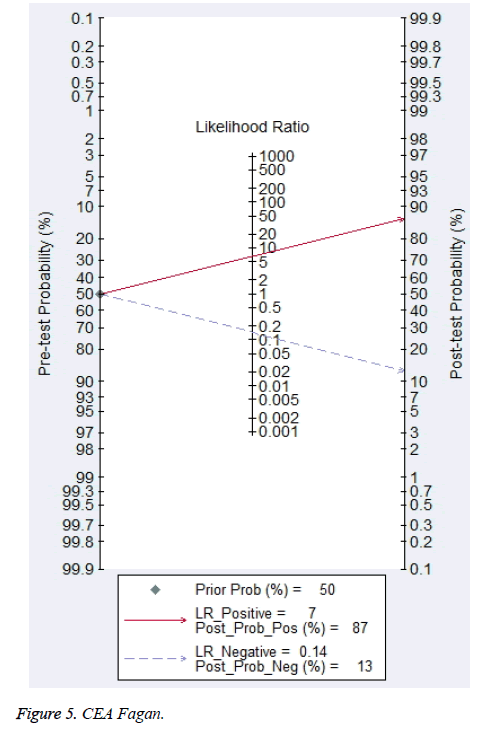
Eleven studies reported the value of combining CYFRA 21-1 and CEA in the differential diagnosis of benign and malignant pleural effusions (Figure 2) [10,14,15,26,28,29,31,33-35,37]. Meta-analysis showed that CYFRA 21-1 combined with CEA had a Sen of 88% (76%-94%) and a Spe of 87% (83%-90%) in the diagnosis of MPE. Heterogeneity test revealed significant heterogeneity in both of them (I2 was 87.2% and 59.7%, respectively). Parallel test showed a PLR of 6.6 (4.8-8.9), a NLR of 0.14 (0.07-0.29) and a DOR of 46 (18-117) for the diagnosis of MPE. The likelihood ratio (LR) scatter plot showed a summary LR point in the lower right quadrant (Figure 3). AUC of the SROC curve (ORr (95% CI)) was 0.90 (0.88-0.93) (Figure 4). Fagan’s nomogram revealed that with a pre-test probability of 50%, the post-test probabilities corresponding to PLR and NLR were 87% and 13%, respectively (Figure 5).
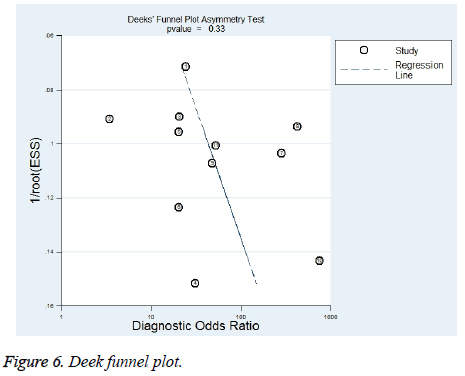
Publication bias was assessed by Deek’s funnel plot. Asymmetry of the funnel plot was examined by linear regression. The regression test P was calculated to be 0.33, indicating no significant publication bias. The funnel plot is shown in Figure 6.
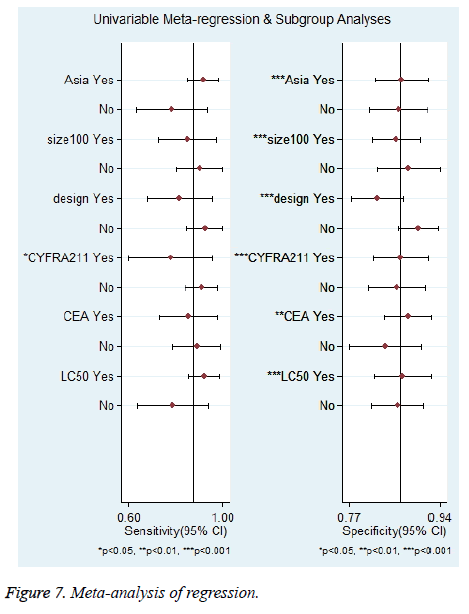
Furthermore, univariate meta-regression analysis was performed based on the characteristics of the studies. The following 6 variables were assessed: Asian populations vs. non-Asian populations; case load ≥ 100 vs. <100; prospective vs. retrospective; pleural effusion CYFRA 21-1 threshold ≥ 50 ng/ml vs. <50 ng/ml; pleural effusion CEA threshold ≥ 6 ng/ml vs. <6 ng/ml and lung cancer-related MPE ≥ 50% vs. <50%. The results are shown in Figure 7. As to Sen, only CYFRA 21-1 threshold might be a source of heterogeneity (P<0.05). For Spe, all the 6 variables might be sources of heterogeneity (P<0.05).
The data of subgroup analysis are shown in Table 2. In the subgroup analysis of Sen, it was higher for Asian populations than for non-Asian populations (92% (85%-98%) vs. 78% (63%-94%)), higher for studies with a lower CYFRA 21-1 threshold (<50 ng/mL) than for those with a higher one (≥ 50 ng/ml) (91% (84%-98%) vs. 78% (60%-96%)), higher for studies with a higher proportion of lung cancer-related MPE patients (≥ 50%) than for those with a lower one (<50%) (92% (85%-99%) vs. 79% (63%-94%)). The subgroup analysis of Spe showed no significant difference between the subgroups.
| Subgroup | Number of study | Sensitivity | P value | Specificity | P value |
|---|---|---|---|---|---|
| Asian populations | 6 | 0.92 (0.85-0.98) | 0.66 | 0.87 (0.82- 0.92) | 0 |
| Non-Asian populations | 5 | 0.78 (0.63-0.94) | 0.86 (0.81-0.92) | ||
| Sample size ≥ 100 | 6 | 0.85 (0.72-0.98) | 0.26 | 0.86 (0.82-0.90) | 0 |
| Sample size<100 | 5 | 0.90 (0.80-1.00) | 0.88 (0.82-0.94) | ||
| Prospective | 6 | 0.81 (0.68-0.95) | 0.06 | 0.82 (0.78-0.87) | 0 |
| Retrospective | 5 | 0.93 (0.85-1.00) | 0.90 (0.86-0.93) | ||
| CYFRA 21-1 ≥ 50 ng/ml | 4 | 0.78 (0.60-0.96) | 0.03 | 0.87 (0.82-0.92) | 0 |
| CYFRA 21-1<50 ng/ml | 7 | 0.91 (0.84-0.98) | 0.86 (0.81-0.91) | ||
| CEA ≥ 6 ng/ml | 6 | 0.86 (0.73-0.98) | 0.32 | 0.88 (0.84-0.92) | 0 |
| CEA<6 ng/ml | 5 | 0.89 (0.79-0.99) | 0.84 (0.77-0.90) | ||
| Lung cancer-related MPE ≥ 50% | 6 | 0.92 (0.85-0.99) | 0.59 | 0.87 (0.82-0.92) | 0 |
| Lung cancer-related MPE<50% | 5 | 0.79 (0.63-0.94) | 0.86 (0.81-0.91) |
Table 2. Subgroup analysis of CYFRA+CEA combination in the diagnosis of MPE.
Combined use of pleural fluid CYFRA 21-1 and blood CYFRA 21-1
Four studies reported the value of combining pleural fluid CYFRA 21-1 and blood CYFRA 21-1 in the differential diagnosis of benign and malignant pleural effusions [10,25,29,32]. Meta-analysis showed that pleural fluid CYFRA 21-1 combined with blood CYFRA 21-1 had a Sen of 76% (66%-84%) and a Spe of 87% (75%-93%) in the diagnosis of MPE. Heterogeneity test revealed significant heterogeneity in both of them (I2 was 56.4% and 63.5%, respectively). The combined use showed a PLR of 5.7 (2.8-11.5), a NLR of 0.28 (0.19-0.41), and a DOR of 21 (8-54) for the diagnosis of MPE. The LR scatter plot showed a summary LR point in the lower right quadrant. AUC of the SROC curve (ORr (95% CI)) was 0.87 (0.83-0.89). Fagan’s nomogram revealed that with a pretest probability of 50%, the post-test probabilities corresponding to PLR and NLR were 85% and 22%, respectively (Figure 5). Due to the small number of studies, publication bias was not detected.
Combined use of CYFRA 21-1 and CA15-3 in pleural fluid
Three studies reported the value of combining CYFRA 21-1 and CA15-3 in the differential diagnosis of benign and malignant pleural effusions [27,30,36]. The analysis using Meta-Disc software revealed that the SROC curve exhibited a shoulder-arm shape, the Spearman correlation coefficient was 1, and P<0.001, indicating a threshold effect. Therefore, Sen, Spe, LR and other statistics were not merged. The AUC of the SROC curve was 0.97. Due to the small number of studies, meta-regression analysis was not performed to explore sources of heterogeneity.
Combined use of CYFRA 21-1 and other tumor markers in pleural fluid
Two studies reported the value of combining CYFRA 21-1 and CA 125 in the differential diagnosis of benign and malignant pleural effusions [29,31]. However, there was great difference in the definition of threshold (Table 3). Ferrer et al. reported a Sen of 55.8% and a Spe of 76.7% [31]. While Wu et al. reported Sen of 94.5% and of Spe 79.4% [29]. Two studies reported the value of combining pleural fluid CYFRA 21-1 and NSE in the differential diagnosis of benign and malignant pleural effusions [10,29]. Lee et al. reported a Sen of 78.8% and a Spe of 75% [10]. While Wu et al. reported Sen of 91.9% and of Spe 50% [29]. Son et al. also evaluated the value of combining pleural fluid CYFRA 21-1 with CA 19-9 and CD66c in the differential diagnosis of benign and malignant pleural effusions [28]. The Sen and Spe of diagnosis using CYFRA 21-1 combined with CA19-9 were 85.1% and 84.6%, respectively. The Sen and Spe of diagnosis using CYFRA 21-1 combined with CD66c were 85.1% and 82.7%, respectively.
| Authors (Y) | Area | Cases | Research type | Male, % | Average age | Chest water marker combination | Critical value | Golden standard | Lung cancer-MPE-ratio, % |
|---|---|---|---|---|---|---|---|---|---|
| Salama et al. | France | 196 | Retrospective study | 56 | 32813 | CYFRA 21-1+CEA | CYFRA21-1: 100 ng/ml; CEA: 6 ng/ml | Cytology or Pathology | 26 |
| Ferrer et al. | Spanish | 146 | Prospective | 66 | 53 | CYFRA 21-1+CEA | CYFRA21-1: 150 ng/ml; CEA: 10 ng/ml | Cytology or Pathology | 37 |
| Spanish | 146 | Prospective | 66 | 53 | CYFRA 21-1+CA125 | CYFRA21-1: 150 ng/ml; CA125: 1000 U/L | Cytology or Pathology | 37 | |
| Lai et al. | Taiwan | 126 | Retrospective study | NA | NA | CYFRA 21-1+CEA | CYFRA21-1: 50 ng/ml; CEA 10 ng/ml | Cytology or Pathology | 100 |
| Alata et al. | Turkey | 74 | Retrospective study | 73 | 50 | CYFRA 21-1+CA15-3 | CYFRA 21-1: 8 ng/ml; CA15-3: 14 U/ml | Pathology | 55 |
| Dejsomritrutai et al. | Thailand | 62 | Retrospective study | 29 | NA | Hydrothorax CYFRA 21-1+CYFRA 21-1 | CYFRA 21-1: 55 ng/ml; blood CYFRA 21-1: 2.5 ng/ml | Cytology or Pathology | 85 |
| Lyubimova et al. | Rassia | 69 | Retrospective study | NA | 31-90 | Hydrothorax CYFRA 21-1+CYFRA 21-1 | CYFRA 21-1: 75 ng/ml; blood CYFRA 21-1: 9.6 ng/ml | Pathology | 34 |
| Lee et al. | Korea | 50 | Prospective | 58 | 57 | CYFRA 21-1+CEA | CYFRA21-1: 45 ng/ml; CEA: 5 ng/ml | Cytology or Pathology | 100 |
| Korea | 50 | Prospective | 58 | 57 | CYFRA 21-1+NSE | CYFRA21-1: 45 ng/ml; NSE: 20 ng/ml | Cytology or Pathology | 100 | |
| Korea | 50 | Prospective | 58 | 57 | Hydrothorax CYFRA 21-1+CYFRA 21-1 | CYFRA21-1: 45 ng/ml; blood CYFRA 21-1: 3.3 ng/ml | Cytology or Pathology | 100 | |
| Shitrit et al. | Israel | 116 | Prospective | 56 | 70 | CYFRA 21-1+CEA | CYFRA21-1: 3.3 ng/ml; CEA 5 ng/ml | Cytology or Pathology | 48 |
| Wagner et al. | Brazil | 85 | Prospective | 55 | 51 | CYFRA 21-1+CEA | CYFRA21-1: 35 ng/ml; CEA: 1.86 ng/ml | Cytology or Pathology | 29 |
| Wu et al. | China | 108 | Retrospective study | NA | NA | CYFRA 21-1+CEA | CYFRA21-1: 22.4 ng/ml; CEA: 3.6 ng/ml | Cytology or Pathology | 100 |
| China | 108 | Retrospective study | NA | NA | CYFRA 21-1+NSE | CYFRA21-1: 22.4 ng/ml; NSE: 5.2 ng/ml | Cytology or Pathology | 100 | |
| China | 108 | Retrospective study | NA | NA | CYFRA 21-1+CA 125 | CYFRA21-1: 22.4 ng/ml; CA125: 37.5 U/ml | Cytology or Pathology | 100 | |
| China | 108 | Retrospective study | NA | NA | Hydrothorax CYFRA 21-1+CYFRA 21-1 | CYFRA 21-1: 22.4 ng/ml; blood CYFRA 21-1: 14.5 ng/ml | Cytology or Pathology | 100 | |
| Li et al. | China | 62 | Retrospective study | 69 | 67 | CYFRA 21-1+CA15-3 | CYFRA 21-1: 3.3 ng/ml; CA15-3: 35 U/ml | Cytology or Pathology | 100 |
| Huang et al. | Taiwan | 134 | Retrospective study | 59.7 | 70.2 | CYFRA 21-1+CEA | CYFRA21-1: 60 ng/ml; CEA: 6 ng/ml | Cytology | 31 |
Table 3. The characteristic of literature.
Discussion
Exfoliative cytology of pleural fluid is the easiest and most accurate method for diagnosis of MPE. However, its sensitivity is poor. Cytological malignancy of exfoliated cells was negative in approximately 40% of patients with MPE [38]. Pleural biopsy has poorer sensitivity than exfoliative cytology [1]. Moreover, both of them are closely related to tumor tissue type and the degree of infiltration [39]. Therefore, the detection of tumor markers has an important value in improving the detection rate of MPE. Pleural fluid markers are superior to blood markers [40]. Among the commonly used tumor markers, CEA is mainly associated with colorectal cancer, CA 125 with ovarian cancer, and CA 15-3 with breast cancer, NSE with small cell lung cancer, and CYFRA 21-1 with lung cancer or pleural mesothelioma [40,41]. However, meta-analysis confirmed that the diagnosis of MPE with a single tumor marker still had low sensitivity (37.6%-62.5%) [6]. In contrast, CYFRA 21-1 is superior to other tumor markers in terms of diagnostic sensitivity [5,6]. The value of pleural fluid CYFRA 21-1 in the diagnosis of MPE was assessed in two metaanalyses. The 2008 data revealed a sensitivity and specificity of 55% (52%-58%) and 91% (90%-93%), respectively and the 2015 data indicated 62.5% (48.3%-76.6%) and 93.2% (86.2%-100%), respectively [5,6].
The present meta-analysis included a total of 16 studies, involving Asian, African, European, and South American populations. The summary of the results indicated that the combined use of pleural fluid CYFRA 21-1 and CEA had a sensitivity of 88% (76%-94%) and a specificity of 87% (83%-90%) in the diagnosis of MPE. The combined use of pleural fluid and blood CYFRA 21-1 had a sensitivity of 76% (66%-84%) and a specificity of 87% (75%-93%) in the diagnosis of MPE. Compared with the use of CYFRA 21-1 alone, the combined use of pleural fluid CYFRA 21-1 with CEA or blood CYFRA 21-1 could significantly improve the diagnostic sensitivity, without a significant decrease in specificity. The combined use of CYFRA 21-1 and CEA had a PLR of 6.6 and a NLR of 0.14 in the diagnosis of MPE. Likelihood ratio is a comprehensive index superior to sensitivity and specificity, and not affected by prevalence. Ideally, when PLR>10 or NLR<0.1, the possibility of diagnosing or ruling out a disease will be increased significantly, which is also a requirement for ideal markers [42]. However, there are very few ideal markers in clinical practice. A diagnostic marker can be regarded as good when PLR>5 or NLR<0.2 [43]. Therefore, CYFRA 21-1 plus CEA is a reliable marker combination for the diagnosis of MPE.
To our knowledge, this is the first meta-analysis on CYFRA 21-1-based tumor marker combinations. All the included studies used cytology or pathology as the reference standard, detected tumor markers with standard laboratory methods, calculated the thresholds for markers based on the ROC curve, had high scores in quality assessment, had no publication bias detected, and employed a bivariate random effects model, which provided a powerful argument. However, the sensitivity and specificity results indicated high heterogeneity. Meta regression analysis showed that the different CYFRA 21-1 thresholds might be a source of heterogeneity in sensitivity. Subgroup analysis revealed that sensitivity was up to 91% in 7 studies with low CYFRA 21-1 thresholds (<50 ng/mL), while it was only 78% in 4 studies with high CYFRA 21-1 thresholds (≥ 50 ng/mL). In addition, the sensitivity was up to 92% in 6 studies with a high proportion of lung cancer-related MPE (>50%), while it was only 79% in those with a low proportion of lung cancer-related MPE. Previous studies have shown that CYFRA 21-1 was mainly expressed in various types of lung cancer, especially in squamous cell carcinoma [15,27]. The diagnostic sensitivity with squamous cell carcinoma was significantly higher than with adenocarcinoma [44]. Therefore, we hypothesized that the CYFRA 21-1+CEA combination had a higher diagnostic value for lung cancer-related MPE. The appropriate relaxation of the CYFRA 21-1 detection threshold can improve the diagnostic sensitivity, without significant impact on specificity. Regression analysis on specificity showed that race, sample size, CEA threshold, and the proportion of patients with lung cancer might all be sources of heterogeneity. Nevertheless, subgroup analysis demonstrated no significant difference in specificity.
The meta-analysis has some limitations. Gray literature was not retrieved. Only English-language articles were included. Some eligible studies may thus be omitted. Some included studies had a small sample size. Some were retrospective, which might introduce recall bias. Moreover, the testing results might be biased by differences in testing techniques or experience, or testing time. Different thresholds were selected in these studies, which might lead to a great difference in sensitivity or specificity. Except CYFRA 21-1 plus CEA, the CYFRA 21-1-based combinations were assessed in a very limited number of included studies. Therefore, the diagnostic value of CYFRA 21-1 combined with other markers (such as CA 125, CA 15-3, and NSE) cannot be analyzed due to insufficient data. Due to insufficient original study data, adequate stratified analysis on MPE of different causes was not performed in this study. For example, CYFRA 21-1 was highly expressed in squamous cell carcinoma, but the causes of MPE were not stratified in most studies. In addition, combinations of three or more markers were not analyzed in this study in consideration of the costs of detecting multiple markers from the viewpoint of health economics. Besides, most studies did not consider the impact of markers on MPE survival and prognosis. Additionally, we do not compare the Sen and Spe between pleural CYFRA 21-1 plus CEA and pleural CYFRA 21-1 plus serum CYFRA 21-1. Finally, IDI value was not showed in this meta-analysis.
Conclusion
The parallel detection of pleural fluid CYFRA 21-1+CEA, or pleural fluid CYFRA 21-1+blood CYFRA 21-1 is important for the diagnosis of MPE. Compared with detection of a single marker, the parallel detection can significantly improve the diagnostic sensitivity and accuracy. However, the diagnostic value of combining CYFRA 21-1 with other tumor markers has not been supported by sufficient evidence. The detection of pleural fluid markers should be comprehensively analyzed in combination with clinical features and the cause of MPE in the future.
Funding
The research receives fund from grant no’s: NYFY ZD 2014001; YKD2015KJBW018.
References
- American Thoracic S. Management of malignant pleural effusions. Am J Respir Crit Care Med 2000; 162: 1987-2001.
- Rodriguez-Panadero F, Borderas Naranjo F, Lopez Mejias J. Pleural metastatic tumours and effusions. Frequency and pathogenic mechanisms in a post-mortem series. Euro Respir J 1989; 2: 366-369.
- Fenton KN, Richardson JD. Diagnosis and management of malignant pleural effusions. Am J Surg 1995; 170: 69-74.
- Roberts ME, Neville E, Berrisford RG. Management of a malignant pleural effusion: British Thoracic Society Pleural Disease Guideline 2010. Thorax 2010; 65: 32-40.
- Liang QL, Shi HZ, Qin XJ. Diagnostic accuracy of tumour markers for malignant pleural effusion: a meta-analysis. Thorax 2008; 63: 35-41.
- Nguyen AH, Miller EJ, Wichman CS. Diagnostic value of tumor antigens in malignant pleural effusion: a meta-analysis. J Laboratory Clin Med 2015; 166: 432-439.
- Buccheri G, Ferrigno D. Lung tumor markers of cytokeratin origin: an overview. Lung Cancer 2001; 34: 65-69.
- Broers JL, Ramaekers FC, Rot MK. Cytokeratins in different types of human lung cancer as monitored by chain-specific monoclonal antibodies. Cancer Res 1988; 48: 3221-3229.
- Stieber P, Hasholzner U, Bodenmuller H. CYFRA 21-1: A new marker in lung cancer. Cancer 1993; 72: 707-713.
- Lee JH, Chang JH. Diagnostic utility of serum and pleural fluid carcinoembryonic antigen, neuron-specific enolase, and cytokeratin 19 fragments in patients with effusions from primary lung cancer. Chest 2005; 128: 2298-2303.
- Xu Y, Xu L, Qiu M. Prognostic value of serum cytokeratin 19 fragments (Cyfra 21-1) in patients with non-small cell lung cancer. Sci Rep 2015; 5.
- Ando S, Kimura H, Iwai N. Positive reactions for both Cyfra21-1 and CA125 indicate worst prognosis in non-small cell lung cancer. Anticancer Res 2003; 23: 2869-2874.
- Takada M, Masuda N, Matsuura E. Measurement of cytokeratin 19 fragments as a marker of lung cancer by CYFRA 21-1 enzyme immunoassay. Brit J Cancer 1995; 71: 160-165.
- Huang WW, Tsao SM, Lai CL. Diagnostic value of Her-2/neu, Cyfra 21-1, and carcinoembryonic antigen levels in malignant pleural effusions of lung adenocarcinoma. Pathol 2010; 42: 224-228.
- Lai RS, Chen CC, Lee PC. Evaluation of cytokeratin 19 fragment (CYFRA 21-1) as a tumor marker in malignant pleural effusion. Japan J Clin Oncol 1999; 29: 421-424.
- Moher D, Liberati A, Tetzlaff J. Preferred reporting items for systematic reviews and meta-analyses: the PRISMA statement. PLoS Med 2009; 6: e1000097.
- Whiting PF, Rutjes AW, Westwood ME. QUADAS-2: a revised tool for the quality assessment of diagnostic accuracy studies. Ann Intern Med 2011; 155: 529-536.
- Sterne JA, Bradburn MJ, Egger M. Meta-Analysis in Stata™. Systematic Reviews in Health Care: Meta-Analysis in Context (2 Ed) 2008; 347-369.
- Dendukuri N, Schiller I, Joseph L. Bayesian meta-analysis of the accuracy of a test for tuberculous pleuritis in the absence of a gold standard reference. Biometrics 2012; 68: 1285-1293.
- Zamora J, Abraira V, Muriel A. Meta-Disc: Software for meta-analysis of test accuracy data. BMC Med Res Methodol 2006; 6: 31.
- Reitsma JB, Glas AS, Rutjes AW. Bivariate analysis of sensitivity and specificity produces informative summary measures in diagnostic reviews. J Clin Epidemiol 2005; 58: 982-90.
- Deeks JJ, Macaskill P, Irwig L. The performance of tests of publication bias and other sample size effects in systematic reviews of diagnostic test accuracy was assessed. J Clin Epidemiol 2005; 58: 882-893.
- Guyatt GH, Oxman AD, Kunz Rl. GRADE guidelines: 7. Rating the quality of evidence-inconsistency. J Clin Epidemiol 2011; 64: 1294-1302.
- Moses LE, Shapiro D, Littenberg B. Combining independent studies of a diagnostic test into a summary ROC curve: data-analytic approaches and some additional considerations. Statistics Med 1993; 12: 1293-1316.
- Dejsomritrutai W, Senawong S, Promkiamon B. Diagnostic utility of CYFRA 21-1 in malignant pleural effusion. Respirol 2001; 6: 213-216.
- Han HS, Yun J, Lim SN. Downregulation of cell-free miR-198 as a diagnostic biomarker for lung adenocarcinoma-associated malignant pleural effusion. Int J Cancer 2013; 133: 645-652.
- Li CS, Cheng BC, Ge W. Clinical value of CYFRA21-1, NSE, CA15-3, CA19-9 and CA125 assay in the elderly patients with pleural effusions. Int J Clin Pract 2007; 61: 444-448.
- Son SM, Han HS, An JY. Diagnostic performance of CD66c in lung adenocarcinoma-associated malignant pleural effusion: comparison with CEA, CA 19-9 and CYFRA 21-1. Pathol 2015; 47: 123-129.
- Wu GP, Ba J, Zhao YJ. Diagnostic value of CEA, CYFRA 21-1, NSE and CA 125 assay in serum and pleural effusion of patients with lung cancer. Acta Cytologica 2007; 51: 679-680.
- Alatas F, Alatas O, Metintas M. Diagnostic value of CEA, CA 15-3, CA 19-9, CYFRA 21-1, NSE and TSA assay in pleural effusions. Lung Cancer 2001; 31: 9-16.
- Ferrer J, Villarino MA, Encabo G. Diagnostic utility of CYFRA 21-1, carcinoembryonic antigen, CA 125, neuron specific enolase, and squamous cell antigen level determinations in the serum and pleural fluid of patients with pleural effusions. Cancer 1999; 86: 1488-1495.
- Lyubimova NV, Yag'ya TN, Chuchalin AG. Diagnostic value of tumor markers Cyfra 21-1 and neuron-specific enolase in analysis of pleural fluid. Bulletin Exp Biol Med 2002; 133: 478-480.
- Salama G, Miedouge M, Rouzaud P. Evaluation of pleural CYFRA 21-1 and carcinoembryonic antigen in the diagnosis of malignant pleural effusions. Brit J Cancer 1998; 77: 472-476.
- Shitrit D, Zingerman B, Shitrit AB. Diagnostic value of CYFRA 21-1, CEA, CA 19-9, CA 15-3, and CA 125 assays in pleural effusions: analysis of 116 cases and review of the literature. Oncologist 2005; 10: 501-507.
- El-Shimy WS, El-Shafey BI, El-Sorougy HA. Diagnostic value of cyfra 21-1 and carcinoembryonic antigen in differentiation between benign and malignant pleural effusion. Egypt J Chest Dis Tuberculosis 2015; 64: 411-417.
- Farag DH, Hadidi EE, Maraghy MO. Pleural CYFRA 21-1 and CA 15-3 in differentiation of malignant from benign pleural effusions. Life Sci J 2012; 9: 499-505.
- Wagner IC, Guimaraes MJ, da Silva LK. Evaluation of serum and pleural levels of the tumor markers CEA, CYFRA21-1 and CA 15-3 in patients with pleural effusion. Jornal brasileiro de pneumologia: publicacao oficial da Sociedade Brasileira de Pneumologia e Tisilogia 2007; 33: 185-191.
- Miedouge M, Rouzaud P, Salama G. Evaluation of seven tumour markers in pleural fluid for the diagnosis of malignant effusions. Brit J Cancer 1999; 81: 1059-1065.
- Antonangelo L, Sales RK, Cora AP. Pleural fluid tumour markers in malignant pleural effusion with inconclusive cytologic results. Curr Oncol 2015; 22: 336-341.
- Korczynski P, Krenke R, Safianowska A. Diagnostic utility of pleural fluid and serum markers in differentiation between malignant and non-malignant pleural effusions. Euro J Med Res 2009; 14: 128-133.
- Bielsa S, Esquerda A, Salud A. High levels of tumor markers in pleural fluid correlate with poor survival in patients with adenocarcinomatous or squamous malignant effusions. Euro J Intern Med 2009; 20: 383-386.
- Jaeschke R, Guyatt GH, Sackett DL. Users' guides to the medical literature. III. How to use an article about a diagnostic test. B. What are the results and will they help me in caring for my patients? The Evidence-Based Medicine Working Group. Jama 1994; 271: 703-707.
- Van den Bruel A, Haj-Hassan T, Thompson M. Diagnostic value of clinical features at presentation to identify serious infection in children in developed countries: a systematic review. Lancet 2010; 375: 834-845.
- Toumbis M, Rasidakis A, Passalidou E. Evaluation of CYFRA 21-1 in malignant and benign pleural effusions. Anticancer Res 1996; 16: 2101-2104.
