Research Article - Biomedical Research (2018) Volume 29, Issue 4
Sparse characterization of PPG based on K- SVD for beat-to-beat blood pressure prediction
Sree Niranjanaa Bose S* and Kandaswamy A
Department of Biomedical Engineering, PSG College of Technology, India
- *Corresponding Author:
- Sree Niranjanaa Bose S
Department of Biomedical Engineering
PSG College of Technology
India
Accepted date: December 08, 2017
DOI: 10.4066/biomedicalresearch.29-17-1438
Visit for more related articles at Biomedical ResearchAbstract
Continuous non-invasive monitoring of blood pressure is essential for cardiovascular risk patients. This article presents the sparse characterization of Photoplethysmogram (PPG) using K-SVD technique for beat-to-beat blood pressure estimation. The relative changes in the blood volume that is represented by PPG is influenced by the pressure changes in the peripheral circulation. Owing to the anomalous nature of the time domain features obtained from ECG and PPG, we propose the use of sparse representation as means of feature extraction method. The sparse features generated from K-SVD processed dictionary that can approximate the shape of the PPG signal were taken as the features to predict the BP values. The proposed system is evaluated using the Multi-Parameter Intelligent Monitoring for Intensive Care (MIMIC-II) database. The proposed method is compared with the baseline system that employs time domain features for BP prediction. The Mean Absolute Error (MAE) and Root mean square Error (RMSE) between the predicted BP and ground truth BP were chosen as the performance measures. The system achieved the error measure of (MAE ± RMSE) 5.06 ± 6.27 mmHg for systolic BP and 2.99 ± 3.93 mm Hg for Diastolic BP. Further, the comparison studies suggests that the proposed system outperforms the baseline system with an overall reduction in MAE and RMSE by 20.55% and 22.14% respectively for systolic BP and 28.15% and 23.48% respectively for Diastolic BP. Hence, the sparse representation of PPG can be successfully utilized for the beat-to-beat prediction of BP.
Keywords
Cuffless blood pressure, Photoplethysmogram, K-SVD, Orthogonal Matching pursuit, Sparse coefficients
Introduction
The condition of elevated Blood Pressure (BP), also known as hypertension is one of the dominant risk factors that is associated with Cardiovascular Diseases (CVD) and chronic kidney disease (CKD). The behavioural risk factors namely the physical inactivity, unhealthy lifestyle, etc., contributes to the impact of CVDs in individuals. One of the objectives of the global Non-communicable Disease (NCD) adopted by World Health Assembly in 2013 is to reduce the prevalence of hypertension, defined as systolic BP of 140 mmHg or higher or diastolic BP of 90 mmHg or higher by 25% by 2025 [1]. The early intervention of elevated blood pressure can influence the behavioural risk factors which greatly reduces the cardiovascular risk.
The mercury based sphygmomanometer has been the gold standard instrument for measuring the BP, utilizing the arm cuff inflation followed by deflation procedure to measure the systolic BP and diastolic BP values based on the korotkoff’s sounds. The state of the art in BP measurement extends to oscillometric principle based automated devices for its use in intensive care units (ICUs), home and offices that measures BP at intermittent intervals preferably for every 15 min. The time gap between the successive readings was to avoid the uneasiness experienced by the individuals during inflation and the consequently the artery occlusion. It also holds a limitation of non-availability of beat-to-beat BP monitoring which is highly essential for the timely assessment of hypertensive patients. The monitoring of blood pressure variations in very short term (beat-to-beat) and short term (minutes to hours) seeks more attention for hypertensive patients as it gives signs for the progressive target organ damage [2]. The blood pressure variability measurement requires implementations of continuous bear-to-beat BP recording devices. The primarily available system for continuous BP monitoring was invasive technique that employs cannula insertion into the artery, widely used in surgical units to monitor the rapid BP fluctuations. In 1967, Czech physiologist Prof. J Peñáz introduced the volume clamp technology that measure the finger arterial pressure using IR plethysmograph-finger cuff setup. The Finapres systems were developed based on the technology that takes the regulated cuff pressure as arterial pressure, maintaining the constant blood volume under the cuff [3]. In spite of its small size, limitations like larger data processing system, motion-sensitivity instability outside the clinical setting and need for calibration with upper arm cuff makes it unreliable for monitoring BP during normal day-to-day activities.
Review of the related works
A number of researchers have carried out their study on the Pulse Wave Velocity (PWV) as indirect means for BP measurement [4]. The PWV, velocity of the pulsating pressure waves results from the changes in the blood pressure. Though PWV is a function of arterial stiffness and enables for continuous BP monitoring, its accuracy rests on the site of measurement as the relation between PWV and BP hold good only if it is measured in the central aortic arteries. One possible way to get over this difficulty was to measure the time taken for the arterial wave to propagate between two substitute arterial locations, also known as pulse transit time (PTT), as it indirectly represents the velocity of the pulsating wave [4,5]. The relation between the PWV and PTT are based on the Moens Korteweg Equation (1)
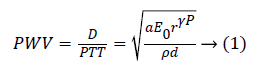
The parameter D is the distance between two arterial locations and the parameters a, E0, ρ, d and P denotes the arterial wall thickness, initial elastic modulus, blood density, diameter and the blood pressure. Few studies have confirmed the relationship between PTT and BP in various conditions [6-8]. McCarthy et al., studied the effects of PTT as biomarker of BP and stated that the relation holds good for shorter time periods beyond which requires re-calibration [6]. Choi et al., proposed the method of multi-innovation recursive least squares to update the system parameters that extends the time of recalibration [7]. Payne et al., analysed the effects of vaso-active drugs in the PTT-BP relationship and found it to be relatively unaffected [8]. However, PTT represents only certain characteristics of the complex cardiovascular events induced by BP fluctuations. The linear regression models based on PTT to estimate BP outperforms for only a short period of time beyond which requires calibration with the reference BP from standard BP devices. These models illustrates the stronger dependence of BP with respect to PTT but fails to operate for long-term BP monitoring.
PTT is associated with arterial stiffness that increase with aging and more prominent in chronic hypertensive patients [9]. But the hemodynamic phenomena like the vascular distensibility, peripheral vascular resistance have not been considered. These details are closely related to the morphological shape of Photoplethysmogram but it has been very less analysed [10]. The variations in the physiological parameters, arterial elastic modulus, wall thickness, blood density and the diameter do contribute to the magnitude of BP and the vice versa. The pressure at which the blood is pumped along the arterial line is responsible to the amount of blood volume present in the capillaries for a particular instant of time. The blood volume as a function of time indirectly depends on the physiological parameters and the blood pressure. The photoelectric plethysmogram also known as photoplethysmogram (PPG) typically characterises the blood volume changes with respect to time. The deeper understanding and exploration of the shape of the photoplethysmographic waveform can give more insights about the blood pressure and other influencing factors.
The Photoplethysmography is a simple, optical based diagnostic tool that presents the structural and functional information of peripheral and central circulation. The uses of photoplethysmography was originally illustrated by Alrick Hertzman in 1937 based on previous observations and principles that PPG measures the fullness of the tissue by measuring the light absorption when illuminated by a light [11]. Figure 1 shows the typical photoplethysmogram (PPG) waveform where primary peak (systolic peak) refers to the systolic phase and the secondary peak (diastolic peak) refers to the diastolic phase of the cardiac cycle. Though the primary application of the PPG is to compute the oxygen saturation in the tissues from light absorption of LED and IR light, the studies has suggested that the detailed analysis of the pulse wave can yield functional information on the cardiovascular system [12]. The pulse rate calculated from the time interval between two systolic peaks is alternative for heart rate calculated from ECG. The BP prediction systems developed from the features extracted from the PPG alone have shown considerable reduction in the error between the actual and the estimated BP values. Some of the studies where the time domain physiological features like systolic amplitude [13], autoregressive coefficients, energy profile and heart rate statistics [14], and magnitude and phase values of 4 specific frequencies of the PPG signal [15] were employed and considerable accuracy was achieved.

Figure 1: Photoplethysmogram with distinctive features.
Unfortunately, the work presented in the literature produces incorrect results because of the inaccuracy in the extracted features. The slightest variations in the shape of the PPG because of the motion artifacts results in features that are noisy and erroneous. Since the features are checked manually on very few training data and there are no other specific ways to check the authenticity and the correctness of the features, this introduces outliers (inaccurate feature values) in the whole of training data that alters the learning process of the machine learning algorithm employed to estimate BP. Though some outliers can be removed statistically, it also ends up removing the crucial data points that can contribute to the system. All of the previously mentioned works relies on data that are clean and devoid of motion artifacts. The other issue is that the frequency domain features presented in [15] focusses on certain frequencies which gives same range of feature values making it difficult and trivial for the learning algorithms to estimate the correct BP range. Therefore, we need to explore diverse yet significant features that can overcome the above issues.
As an alternative to the above existing methods, this article focusses on new type of features that can be extracted from PPG for beat-to-beat BP Prediction. Sparse coding is one of the evolving techniques in signal processing that can represent a given input signal in terms of weighted sum of the dictionary atoms or dictionary elements. The sparse coding is employed in number of applications like compression, denoising, feature extraction and regularization, and more [16]. The objectives of this study is to verify that the sparse coefficients of PPG generated from over complete bases dictionary can be used for the beat-to beat prediction of BP. This study is also focused on comparison of the performance of the proposed system to that of the native baseline system that utilises the mathematically engineered features for continuous beat-to-beat BP monitoring.
Sparse representation
Sparse technique represents the given signal Si as weighted sum of the bases derived from the over-complete dictionary. The dictionary D is a codebook that consists of K dictionary elements that determines the approximation of the given signal in a specific domain. Given the dictionary D={D1, D2,......DK} the method aims at representing the signal Si as the weighted sum of the elements from the dictionary D.
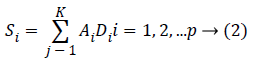
Here A={A1, A2,...AK} correspond to sparse coefficients. Vector Quantisation (VQ), Principal Component Analysis (PCA), Independent component Analysis (ICA) are some of the well-known techniques of this kind [16]. The nature of the dictionary depends on the function defining the dictionary and the completeness of the dictionary. The simplest method of defining the dictionary is by use of pre-defined transform functions which includes Discrete Cosine Transform (DCT), wavelets, Short Time Fourier Transform (STFT), and wavelets. The alternative method is to train the randomly initialised dictionary with the data of our interest. The term ‘Sparsity’ defines the presence of few non-zero coefficients and other being zero in the sparse vector. It implies that very few signal dictionary elements from the dictionary can give succinct representation of the data. Though over-complete dictionaries are able to find the inherent nature of the signal, the coefficients are no longer unique and are uncorrelated for a given input data. Thus the constraints of sparsity are introduced in learning process. It is given by
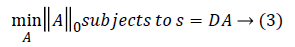
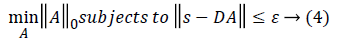
||A||0 gives the l0 normalization of sparse vector A. It yields the count of the non-zero entries in A [16]. The l0 optimization is helpful in finding the sparsest solution for underdetermined linear systems. The sparsest solution refers to lowest l0-norm i.e., fewest non-zero entries in A. The concept of sparsity and over-complete dictionaries can finds its use in feature extraction as the sparse coefficients generated from the designed dictionary can be used as feature vector for various classification and regression problems.
K-SVD based dictionary learning process
The K-means Singular value Decomposition (K-SVD) technique is an algorithm for designing the dictionary of over-complete bases that is solely based on the input data of our interest [16]. The dictionary learning process in K-SVD is composed of the sparse coding step and the dictionary updation step. Given the randomly initialised dictionary D, the sparse coding step finds the sparse coefficients using Orthogonal Matching Pursuit (OMP) algorithm, whereas the dictionary updation step decomposes the matrix DA into k rank-1 matrices by selecting dictionary element Dk and its corresponding vector Ak based on the following constraint
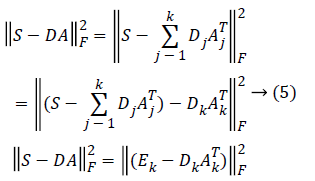
Here Ek corresponds to the overall error representation without Dk and its corresponding vector Ak. The SVD is computed for Ek that yields UΔVT. where the first column of U gives the updated dictionary atom Dk and the first column of V multiplied by Δ(1, 1) gives the coefficient vector AkT corresponding to atom Dk [17]. Therefore, the SVD is performed K times to complete K-dictionary elements dictionary.
The Orthogonal Matching Pursuit (OMP) is iterative algorithm that selects the dictionary elements at each step that are highly correlated with the input data or its residual. Unlike the other matching pursuit algorithms, the OMP computes the orthogonal projection of the signal from the dictionary elements of updated dictionary [18]. The OMP generates the sparse coefficients by projecting the given input signal data in a space spanned by the dictionary elements in the updated dictionary.
Sparse coding of training and testing signals
To achieve the objective of BP prediction on beat-to-beat basis, the PPG signal of each cardiac cycle is considered over a signal frame of fixed interval. The Figure 2 shows the process flow of the proposed system. The starting point of each pulse wave is obtained and the signal between two start points is taken as PPG signal frame. Each frame is resampled to fixed length to form the training signal matrix Strain of size N × Mi where N is the PPG frame length and Mi is the number of training samples. The Strain and the randomly initialized dictionary D of size N × K are fed to the K-SVD to get the updated dictionary DKSVD. Here K is the number of dictionary atoms in D. The OMP algorithm projects each PPG frame si from the matrix Strain onto the subspace spanned by the dictionary DKSVD. The resulting sparse coefficient vector for each training signal is of size Kx1 having maximum of Ai nonzero values. Therefore the sparse coefficient vector is taken as the feature vector to represent the PPG signal frame in both training matrix Strain and testing matrix Stest (of size N x Mj, Mj is the number of testing samples) The above mentioned process is implemented followed by the training of the system using regression model. The model is then employed to estimate the systolic and diastolic BP.

Figure 2: Process flow of the proposed system.
Materials and Methods
Dataset description
To test and evaluate the performance of the proposed system, we employ the Multi-Parameter Intelligent Monitoring for Intensive Care (MIMIC -II) dataset that consists of simultaneously recorded ECG, PPG and the arterial blood pressure (ABP) waveform [19]. In particular, we use the MIMIC-II Waveform Matched Subset Database as it has its corresponding clinical database linked to it. The clinical database has the demographic details and the clinical history of the subjects. A total of 105 out of 2850 subject records (35 females, 70 males) that has synchronized ECG, PPG and ABP waveforms, marked with essential hypertension were taken for our study. The training and testing dataset consists of 73 and 32 records respectively. The demographic characteristics of the dataset is listed in the Table 1. The characteristics of the dataset is of those waveform data matched with the available clinical data and other patient relevant details.
| Characteristics | Training Data | Testing Data | p-value |
|---|---|---|---|
| Sex (Males) % | 49 (67%) | 21 (65%) | NS |
| Age (Years) | 65.74 ± 16.52 | 65.34 ± 12.97 | NS |
| Height (cm) | 168.46 ± 13.19 | 172.53 ± 8.07 | NS |
| Weight (Kg) | 94.68 ± 29.66 | 93.06 ± 17.86 | NS |
| SOFA Scores | 10.56 ± 5.91 | 10.56 ± 5.91 | NS |
| Systolic BP | 116.42 ± 22.5 | 108.9 ± 20.13 | NS |
| Diastolic BP | 57.83 ± 12.84 | 59.92 ± 12.55 | NS |
| NS: Not Significant; SOFA: Sequential Organ Failure Assessment | |||
Table 1: Demographic characteristics of the dataset.
The ABP waveform data from the database is the continuous invasive BP measurement where in the single pressure wave, the maximum peak value corresponds to systolic BP and the following base value corresponds to diastolic BP. The placement of sensors along the arterial line takes the order of blood pressure invasive equipment followed by the pulse oximetry probe. Therefore, the ABP waveform follows the PPG waveform. As seen in the Figure 3, the BP value follows the normal distribution with 95% Confidence intervals (μ ± 1.96 σ) of 107 ± 39 mmHg for systolic BP and 59 ± 23.12 mmHg for diastolic BP.

Figure 3: Histogram with Fitted Distribution (a) Systolic BP (b) Diastolic BP.
System setup
The denoising of the PPG signal is performed using the algorithm in [20] and the peak detection adopted from [21] with adjustments in the filter design suitable for the signal. The foot point or pulse arrival point was determined with respect to the peaks. The signal data between 2 foot points was taken as one signal frame. To ensure that the size of the frame is fixed as the cardiac period varies, each signal frame was resampled to length of 100 samples. Therefore, the training signal set consisted of 5792 signal frames (5792 × 100) and testing signal set of 2588 frames (2588 × 100).
The dictionary is said to be over-complete only if the number of dictionary dictionary elements is greater than the length of the signal frames. The dictionary was randomly initialized with the size of 100 × 500. Here 500 correspond to the number of dictionary dictionary elements to be processed to get the learned dictionary. The training signal set and the dictionary D is fed to the K-SVD with the number of iterations and level of sparsity set to 30 and 25 respectively. It results in updated dictionary Dksvd. The OMP algorithm projects each signal frame spanned by Dksvd resulting in the sparse vector of size 500x1 with maximum of 25 non-zero coefficients. This forms the training feature set (size of 5792 × 500) and the testing set (2588 × 500).
Regression modelling
The beat-to-beat estimation of BP is considered as the regression problem with features to predict the value of BP. The linear and non-linear regression models must be analyzed to determine which of the available machine learning algorithm suits best for our proposed features. This article focusses on 4 main types of regression algorithm.
1. Linear regression of the form Y=a+bX where X is explanatory or predictor variable and Y is dependent variable. Though most of the real time regression problems are non-linear, they are simple, less susceptible to overfitting and requires less training samples.
2) Neural networks: One of the most commonly used machine learning algorithm that consists of network with input layer, hidden layer and the output layer. The output from one layer becomes the input to the following layer of nodes. Each nodes has weights based on the input-output relation and the weights are optimized by back propagation algorithm with respect to the reference target values. Our system is trained with input layer of 500 nodes, a hidden layer with 10 nodes and output layer with 2 nodes (one node corresponds to systolic BP and the other to diastolic BP).
3) Support vector regression: One of the supervised learning algorithm that is similar in function to neural networks. It form a hyperplane or a set of hyperplanes that maximizes the margin and minimize the error. The libSVM library [22] is used to develop the regression model with Radial Basis Function (RBF) kernel, with the epsilon and gamma value selected by cross-grid search (ε=5, γ=0.125 for SBP and ε=4, γ=0.25 for DBP).
4) Random forests: An ensemble technique which consists of n number of learners connected together to form single regression tree. The prediction from the each learner is combined to get the final prediction. It is advantageous to decision trees by being less prone to overfitting and less variance. Our system is developed with 100 base learners.
Evaluation protocol
The evaluation of the predicted BP values is performed by computing two main measures. One is the Mean Absolute error (MAE), (error between the reference BP and the predicted BP) and Root Mean Square Error (RMSE). The MAE and RMSE is computed using the equation 6 and 7.
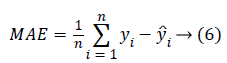
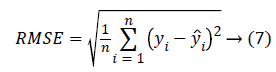
The yi is the reference BP value and ŷi is the BP value predicted from the system. The MAE and the RMSE in units of same as that of blood pressure (mmHg) gives the measure of how far the prediction system is better compared to the existing methods. The results reported are based on the evaluation performed on the test dataset.
Results
Table 1 lists the statistical analysis on the demographic data is done using Student’s t-test. The p-value for all the entries were greater than 0.05 signifying there is no much significant difference between the two groups (training and testing dataset), making it appropriate for the testing of the system. The sparse coefficients from the training signal frames and their corresponding BP values were given as input and targets for training the model.
The models were formed using 4 algorithms namely the multiple linear regression, the neural networks, the Support Vector Machines (SVR) and the Random forests as per the specified parameters with 10-fold cross validation. The performance of the regression models are assessed using the testing dataset (sparse coefficients from test signal frames) in terms of MAE and RMSE and is listed in the Table 2. The values mentioned are the results obtained for the overall test data. The performance measures suggests that the random forests performs best among the implemented systems with the minimum error both for Systolic and Diastolic BP. The less variance property and ensembling of many learners in random forests makes the prediction better than other systems. The association for the Advancement in Medical Instrumentation (AAMI) suggested the standards AAMI-SP10 to clinically investigate the automated BP measurement systems. According to AAMI, the mean error in absolute less than 5 mmHg and the root mean square error less than 8 mmHg is considered to be clinically acceptable. In order to verify the use of updated sparse dictionary DkSVD on subject-wise basis, a random forest model was developed with sparse coefficients of first 1 minute PPG signal frame (one-time calibration) and tested on the data of 10 min signal frames. The mean absolute error and root mean square error for each individual (32 subjects in the test dataset) using the random forests model is been listed in Table 3. It can be understood that except for some, the MAE ± RMSE for all other subjects fall within the specified range of 5 ± 8 mmHg for both systolic and Diastolic BP. The MAE and the RMSE averaged overall the test data is 5.06 and 6.27 mmHg respectively for systolic BP and 2.99 and 3.93 mmHg respectively (Figure 4).
| Regression Models | Systolic BP (mmHg) | Diastolic BP (mmHg) | ||
|---|---|---|---|---|
| MAE | RMSE | MAE | RMSE | |
| Linear Regression | 19.45 | 25.24 | 10.69 | 13.62 |
| Neural Networks | 19.12 | 24.58 | 10.54 | 13.62 |
| SVR | 19.01 | 24.17 | 11.15 | 14.07 |
| Random Forests | 17.08 | 21.73 | 10.77 | 13.27 |
| MAE: Mean Absolute Error; RMSE: Root Mean Square Error | ||||
Table 2: Comparison of models for BP prediction for systolic and diastolic BP.
| Record No. | Systolic BP (mmHg) | Diastolic BP (mmHg) | Record No. | Systolic BP (mmHg) | Diastolic BP (mmHg) | ||||
|---|---|---|---|---|---|---|---|---|---|
| MAE | RMSE | MAE | RMSE | MAE | RMSE | MAE | RMSE | ||
| s00618 | 7.82 | 8.57 | 5.48 | 6.17 | s04906 | 2.3 | 2.82 | 1.89 | 2.79 |
| s00946 | 3.66 | 6.89 | 3.75 | 8.82 | s05937 | 2.54 | 3.01 | 0.95 | 1.18 |
| s01004 | 6.32 | 7.51 | 2.1 | 2.53 | s06116 | 3.3 | 3.9 | 2.86 | 3.24 |
| s01501 | 1.74 | 2.05 | 1.3 | 1.54 | s06158 | 10.26 | 12.13 | 3.77 | 4.52 |
| s01501 | 3.32 | 4.01 | 1.49 | 2.03 | s06692 | 3.75 | 4.75 | 2.93 | 3.76 |
| s01840 | 4.28 | 6.13 | 1.89 | 2.67 | s06875 | 2.47 | 3.34 | 1.55 | 2 |
| s01840 | 1.6 | 2.01 | 0.97 | 1.18 | s07251 | 1.38 | 1.7 | 1.44 | 1.81 |
| s01855 | 15.9 | 18.94 | 11.94 | 15.94 | s07251 | 4.8 | 6.45 | 2.2 | 2.94 |
| s02458 | 9.93 | 11.37 | 3.05 | 3.9 | s07415 | 2.54 | 3.18 | 3.6 | 4.27 |
| s02586 | 2.87 | 3.59 | 1.71 | 2.25 | s07614 | 5.46 | 7.14 | 4.4 | 6.31 |
| s02586 | 2.21 | 2.72 | 1.84 | 2.3 | s07654 | 4.48 | 5.49 | 4.07 | 5.02 |
| s02703 | 1.74 | 2.09 | 1.2 | 1.79 | s08141 | 13.53 | 16.02 | 4.36 | 5.25 |
| s02858 | 10.42 | 12.79 | 6 | 7.99 | s08141 | 6.48 | 7.69 | 3.61 | 4.28 |
| s03617 | 4.12 | 5.15 | 1.92 | 2.5 | s10152 | 5.29 | 6.72 | 2.86 | 4.06 |
| s04679 | 2.92 | 3.57 | 1.77 | 2.11 | s12351 | 6.98 | 8.41 | 2.92 | 3.61 |
| s04679 | 2.93 | 4.13 | 1.22 | 1.47 | s12352 | 4.63 | 6.35 | 4.61 | 5.66 |
Table 3: Error measures of individual records after one-time calibration averaged over 10 min.

Figure 4: Visualization of beat-to-beat blood pressure measurements for the record s01840.
Comparison result
To illustrate the robustness of the system, we compared the performance of the system with the one of the already existing methods that uses the magnitude, area based features for BP Prediction. The algorithm proposed by Kachuee et al. [23] uses PTT calculated from ECG and PPG, systolic amplitude, diastolic amplitude, amplitude ratio, area under the PPG curve at different stages as the features. This system that has demonstrated a considerable accuracy is taken as the baseline system for comparison purposes. We implemented the baseline system with the same dataset to ensure better comparison of the two systems. Table 4 enumerates the performance measures (MAE and RMSE) obtained using the test dataset (n=32) for the proposed system and the baseline system. The relative improvement in terms of error from one method over the other is calculated to check whether the proposed system performs better than the baseline system. It is calculated using the formula (8).
The method 1 refers to the baseline system and the method 2 refers to the proposed system. The relative
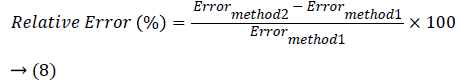
error in percentage is calculated for MAE and RMSE to show the performance increase of the proposed system with respect the baseline system. It can be understood that the proposed system that uses sparse coefficients as features outperforms the baseline system. The performance of the proposed system with respect to the baseline system in terms of the MAE and RMSE is increased by 20.55% and 22.14% respectively for systolic BP and 28.15% and 23.48% respectively for diastolic BP. This elucidates the fact that the sparse coefficients based BP prediction system can result in less erroneous BP values.
One of the other comparison is between the standard method and the proposed system of beat-to-beat BP measurement. The Bland-Altman plot, a graphical method is used to visualize the comparison of two methods of BP measurement [24]. The Bland-Altman plot for the record s01840 is shown in Figure 5. The error difference between the BP from the reference method and BP from the proposed method is plotted against the average of the two methods. The limits of agreement (LoA) is the 95% confidence intervals (CI) is given by Mean ± 1.96 of SD. The two methods are said to be in agreement and interchangeable only if the CI are within the allowed limits (Mean-5 mmHg, SD-8 mmHg as per AAMI). Except for the few instances, all other data instances lie within the 95% CI levels thus making the method clinically acceptable.

Figure 5: Bland-Altman plot of sparse features based bp estimation for record s01840.
Discussion
The study discusses about the application of sparse coding in modelling the shape of PPG signal for beat-to-beat cuffless estimation of BP. The results suggests that the sparse features can be a promising characteristics for PPG modelling. The ability of the learned dictionary for its use in sparse coding of PPG can depends on the size of the dictionary. The over-complete dictionary whose elements are PPG signal frames each of pulse interval duration of varying size and patterns enables for precise selection of the dictionary element to represent the given input PPG signal frame. The dictionary element which has the closest resemblance to the input PPG segment is given the highest weights (sparse coefficient) and so on. Increasing dictionary size increases the number of possible patterns of PPG to be selected upon for signal characterization. The sparse coefficients that weighs each dictionary element that sums up to mimic the given input signal is therefore unique and inherent to noisy signals. The number of non-zero coefficients or the number of dictionary atoms to be selected is decided upon by the user. To verify the given fact, we showed the effect of dictionary size in the error measures in the Figure 6.

Figure 6: Effect of dictionary size on the performance of the system.
Opposed to the fact, the figure illustrates that the performance of the BP prediction system is independent of the size of the dictionary. A dictionary even with symmetrical size (100 indices × 100 elements) can be applied for the process provided that the dictionary is well learned by the varied training data. A well learned dictionary with as many variations of dictionary elements available from the training data and irrespective of the health status of the subjects should be able to generate sparse coefficients that can be representative of the BP. Though we achieved a considerable improvement in accuracy with one-time calibration, a well learned dictionary can be universal to generate sparse features for any type of data and result in state of no calibration. Further, the inclusion of information like the age, height, weight and sex may contribute to the improvement of the system. The BP ranges varies for males and females and also for different age groups. A distinctive nature in the shape of the PPG can be observed by the presence of the prominent dicrotic notch in the middle aged adults. The arterial stiffness in the old aged adults’ results in disappearance of the notch making it necessary for separate BP prediction models. The model developed based on different age groups can improve the performance of the system. Despite the simplicity of the sparse features, it does have some limitations. The complexity of the training process of the model increases as the size of the feature vector increases. The trade-off exists between the vector size and the computation time. Though there are very few non-zero coefficients, the processing of all zeros in the remaining indices of each vector increases the computation.
Conclusion
In summary, this article presents the characterization of Photoplethysmographic waveform using K-SVD for the beat-to- beat prediction of BP. The technique involves the dictionary learning process where the randomly initialized dictionary is processed by K-SVD based on the photoplethysmogram signals. The updated dictionary consists of elements each defining varying shapes of the PPG. The OMP algorithm generates the sparse features for the PPG signal frame of pulse interval duration using the update dictionary. The supervised regression model developed with these features shows better performance compared to the system that uses hand-engineered features from ECG and PPG. While the proposed system exhibits a considerable reduction in the error measures when compared to the standard BP measurements, the future work would focus on to test the method on real time datasets to check its robustness and also to reduce the number of calibration required and therefore test its ability for unobtrusive, long-term monitoring process.
References
- Zhou B, Bentham J, Di Cesare M, Bixby H, Danaei G, Cowan MJ. Worldwide trends in blood pressure from 1975 to 2015. Lancet 2017; 389: 37-55.
- Parati G, Ochoa JE, Lombardi C, Bilo G. Blood pressure variability: Assessment, predictive value, and potential as a therapeutic target. Curr Hypertens Rep 2015; 17: 1-18.
- Porter KB, O’Brien WF, Kiefert V, Knuppel RA. Finapres: A noninvasive device to monitor blood pressure. Obstet Gynecol 1991; 78: 430-433.
- Geddes L, Voelz M, James S, Reiner D. Pulse arrival time as a method of obtaining systolic and diastolic blood pressure indirectly. Med Biol Eng Comput 1981; 19: 671-672.
- Hennig A, Patzak A. Continuous blood pressure measurement using pulse transit time. Somnol Sleep Res Sleep Med 2013; 17: 104-110.
- McCarthy BM, O’Flynn B, Mathewson A. An investigation of pulse transit time as a non-invasive blood pressure measurement method. J Phys Conf Ser 2011; 307: 1-6.
- Choi Y, Zhang Q, Ko S. Noninvasive cuffless blood pressure estimation using pulse transit time and Hilbert-Huang transform. Comput Electr Eng 2013; 39: 103-111.
- Payne RA. Pulse transit time measured from the ECG: an unreliable marker of beat-to-beat blood pressure. J Appl Physiol 2006; 100: 136-141.
- Bernstein LH. Insights in blood pressure. Insights Blood Pressure 2015; 1: 1-8.
- Elgendi M. On the analysis of fingertip photoplethysmogram signals. Curr Cardiol Rev 2012; 8: 14-25.
- Alian AA, Shelley KH. Photoplethysmography. Best Pract Res Clin Anaesthesiol 2014; 28: 395-406.
- Shelley KH. Photoplethysmography: Beyond the calculation of arterial oxygen saturation and heart rate. Anesth Analg 2007; 105: 13-18.
- Yoon Y, Yoon G. Non-constrained BP measurement Using PPG. J Opt Soc Korea 2006; 10: 91-95.
- Monte-Moreno E. Non-invasive estimate of blood glucose and blood pressure from a photoplethysmograph by means of machine learning techniques. Artif Intell Med 2011; 53: 127-138.
- Xing X, Sun M. Optical blood pressure estimation with photoplethysmography and FFT-based neural networks. Biomed Opt Express 2016; 7: 3007-3020.
- Aharon M, Elad M, Bruckstein AM. The {K-SVD}: An algorithm for designing of overcomplete dictionaries for sparse representations. IEEE Trans Signal Process 2006; 54: 4311-4322.
- Zubair S, Yan F, Wang W. Dictionary learning based sparse coefficients for audio classification with max and average pooling. Digit Signal Process A Rev J 2013; 23: 960-970.
- Cai TT, Wang L. Orthogonal matching pursuit for sparse signal recovery with noise. IEEE Trans Inf Theory 2011; 57: 4680-4688.
- Goldberger AL, Amaral LAN, Glass L, Hausdorff JM, Ivanov PCh, Mark RG, Mietus JE, Moody GB, Peng CKSH. PhysioBank, PhysioToolkit, and PhysioNet: Components of a new research resource for complex physiologic signals. Circulation 2000; 101: e215-220.
- Colominas MA, Schlotthauer G, Torres ME. Improved complete ensemble EMD: A suitable tool for biomedical signal processing. Biomed Signal Process Control 2014; 14: 19-29.
- Manikandan MS, Soman KP. A novel method for detecting R-peaks in electrocardiogram (ECG) signal. Biomed Signal Process Control 2012; 7: 118-128.
- Chang CC, Lin CJ. {LIBSVM}: A library for support vector machines. ACM Trans Intell Syst Technol 2011; 2: 1-27.
- Kachuee M, Kiani MM, Mohammadzade H, Shabany M. Cuff-less blood pressure estimation algorithms for continuous health-care monitoring. IEEE Trans Biomed Eng 2016; 99: 1-11.
- Giavarina D. Understanding bland altman analysis. Biochem Medica 2015; 25: 141-151.