Research Paper - Journal of Food Nutrition and Health (2018) Volume 1, Issue 1
Relationship of physical activity with obesity indicators and serum leptin level in a type 2 diabetic local population.
- *Corresponding Author:
- Butt S
Department of Zoology, University of the Punjab, Lahore Pakistan
E-mail: saba.butt@hotmail.com
Accepted date: January 05, 2018
Citation: Butt S, Cheema AM. Relationship of physical activity with obesity indicators and serum leptin level in a type 2 diabetic local population. J Food Nutr Health 2018;1(1):6-9.
DOI: 10.35841/food-nutrition-health.1.1.6-9
Visit for more related articles at Journal of Food Nutrition and HealthAbstract
Obesity is strong contributory factor in incidence and complications of type 2 diabetes and other degenerative disorders. Physical inactivity is associated with obesity and hormone levels. Current study was planned to investigate relationship of physical inactivity with obesity indicators and leptin levels in type 2 diabetics. Type 2 diabetes patients (n=112) visiting public hospitals of Lahore participated in this study. Anthropometric measures and physical activity were recorded using a structured questionnaire. Leptin levels were measured using ELISA. Statistical analysis was carried out to relate parameters of physical activity, obesity indicators and leptin levels. Results showed that type 2 diabetic subjects demonstrate unhealthy body composition and reduced physical activity. Physical activity was associated with leptin levels and obesity indicators. Leptin level was also significantly associated with the obesity indicators. It is concluded that physical inactivity is strongly related with obesity indicators and leptin levels in this population.
Keywords
Physical inactivity, Obesity indicators, Leptin, Type 2 diabetes.
Introduction
Obesity is one of the most important contributors in development and progression of various metabolic/ degenerative diseases. Increased incidence of obesity is attributed to the change in various lifestyle behaviours especially increased food intake and reduced physical activity. It has been found that food intake is increased and physical activity is decreased, particularly in urban populations which results into obesity and associated metabolic disorders [1]. Obesity is attributed to be responsible for various metabolic diseases including hypertension, cardiovascular diseases, metabolic syndrome and type 2 diabetes mellitus [2-4].
Nyamdorj [5] showed that BMI and central obesity are indicators of diabetes incidence in Mauritius. Obesity is strongly associated with degenerative diseases like diabetes, hypertension, cardiovascular diseases and more. Decoda study group [6] showed that obesity indicators including BMI and central obesity demonstrate a relationship with type 2 diabetes. Qiao and Nyamdorj [7] demonstrated that BMI and central obesity are predictors of diabetes independently. Type 2 diabetes mellitus is one of the most important disorders associated with obesity and reduced physical activity. Physical activity is also known to be associated with glycaemic control hence improve the hyperglycaemic situation that exist in type 2 diabetes. Physical activity particularly the one conducted for health or leisure time is specifically known to reduce and maintain weight [8]. Interaction of lifestyle factors with hormones is also studied and contemporary lifestyle has been found to be associated with circulating hormone levels in human and animal subjects [9]. Leptin is a one of the very important hormones that has been found to be involved in regulation of fuel metabolism in body hence related to overweight status and obesity. Leptin is known to control appetite hence involved in weight control. Leptin is a major regulator of appetite and energy expenditure [10].
The present study was planned in this context to investigate the relationship between physical activity with obesity indicators and leptin levels in a type 2 diabetic local population.
Materials and Methods
Research Design: Cross-sectional study.
Population and sampling
In this study, an interview-based questionnaire was filled for each diagnosed type 2 diabetes patient including information about their physical activity status. Weight, height, waist and hip circumference were recorded for each subject. Blood sample was obtained with the help of a trained personnel, which was taken to the lab in ice-box and serum was separated for further assessments.
Estimations and assessments
Body Mass Index (BMI), Waist to Hip Ratio (WHR) and Waist to Height Ratio (WHiR) were calculated using methods described in WHO, 1995 and 1998. BMI was calculated by dividing weight in kilograms by height in meters square. Waist to hip ratio was calculated as waist circumference by hip circumference, both taken in centimetres. Waist to height ratio was calculated by dividing waist circumference by height, both taken in centimetres. Serum leptin levels were measured by Enzyme-linked Immunosorbent Assay (ELISA) in a selective group of patients using commercially available ELISA kit prepared by Diagnostic Automation Inc., USA (Cat #1742-6) following the protocol described in the kit (sandwich ELISA).
Subject grouping
Patients were divided into groups according to BMI, WHR, WHiR and various aspects of physical activity. Categories of BMI, waist circumference, WHiR and WHR were followed from WHO report published in 2000. A BMI of 30 and above considered as obese, 25-30 as overweight, 18.5-24.9 as normal weight and less than 18.5 as underweight. A WHR of more than or equal to 0.8 was considered as at risk while below 0.8 was considered as normal. A WHiR of 0.6 and above was taken as at risk and below 0.6 was taken as normal. Physical activity was taken as leisure time physical activity, i.e., other than work related. Subjects doing physical activity or are sedentary were grouped separately. The groups were compared to each other for obesity indicators and leptin levels using appropriate statistical tests.
Statistical analysis
All variables were entered into MS Excel spread sheet and analysed statistically using SPSS v17.0. Groups were compared using t test and correlation as per requirement.
Results and Discussion
Type 2 diabetes mellitus is a degenerative disorder that is on increase in the world and in Pakistan due to contemporary lifestyle marked by reduced physical activity and increased or imbalanced food intake that leads towards reduced obesity and quality of life and economic burden on the society. Interactions of lifestyle with hormonal mechanisms need to be explored for a better understanding of the interactions and finding solutions. The present study was aimed to investigate the relationship of physical activity with obesity indicators and serum leptinimportant hormone involved in such interactions.
Physical activity status in type 2 diabetic subjects
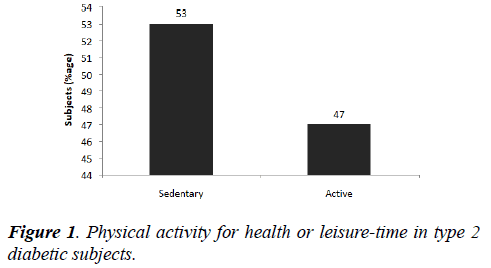
Results of this study showed that majority of the type 2 diabetics have unhealthy body composition and reduced physical activity. As indicated by the obesity indicators, most of the subjects were either in obese or overweight or at risk category. According to indicators of abdominal obesity, most of the subjects lie in at risk category. Physical activity was taken as leisure-time physical activity. It was found that 53% subjects do not do any physical activity for health, i.e. they were sedentary (Figure 1).
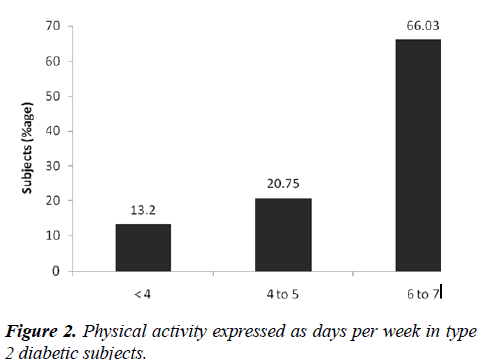
The subjects who do physical activity were asked for the type, duration and intensity of activity. Majority of the subjects, who answered yes to physical activity do walk as activity, a few only do other kinds of physical activity includes cycling, stair climbing or professional activity. Sixty six % (66.03%) of the subjects who perform physical activity; do it for 6 to 7 days per week, 20.75% do it for 4 to 5 days per week and 13.2% do it for 2 to 3 days per week (Figure 2).
Majority of the subjects Forty two % (42%) of the subjects do physical activity for 31 to 60 minutes per day, another 30% for 21 to 30 minutes per day and 28% do it for 10 to 20 minutes per day (Table 1). Majority of the subjects (58%) of the subjects perform physical activity at a moderate speed, 17% do brisk walking/activity and 25% do a slow walk/activity (Table 2).
| Duration of Physical activity per Day | Subjects (%age) |
|---|---|
| 10 - 20 Minutes | 28 |
| 21 - 30 Minutes | 30 |
| 31 - 60 Minutes | 42 |
Table 1. Duration of physical activity per day, in type 2 diabetic subjects.
| Intensity physical activity | Subjects (%age) |
|---|---|
| Slow | 25 |
| Moderate | 58 |
| Brisk | 17 |
Table 2. Intensity of physical activity expressed as percentage in slow, moderate and brisk in type 2 diabetic subjects.
Relationship of Physical Activity with Body Composition and Leptin Levels
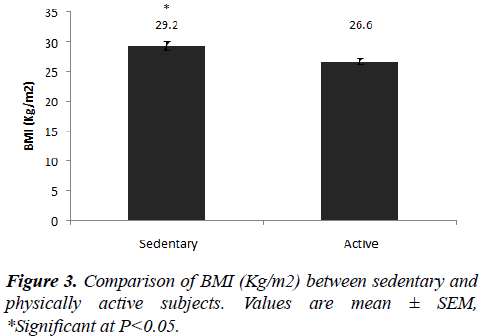
Physical activity was found to be strongly associated with body composition and other parameters. Statistical analysis revealed that the BMI of the subjects which are sedentary is significantly higher than those who are physically active (29.2 ± 0.78 versus 26.6 ± 0.59 Kg/m2) (Figure 3).
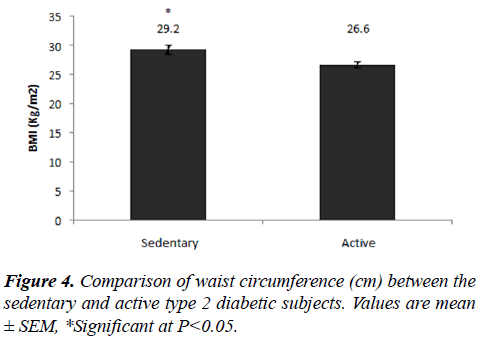
Waist circumference of the sedentary (physically inactive) subjects was also significantly higher in those who were sedentary (P<0.05); 99.34 ± 1.47 versus 94.75 ± 1.16 cm) (Figure 4).
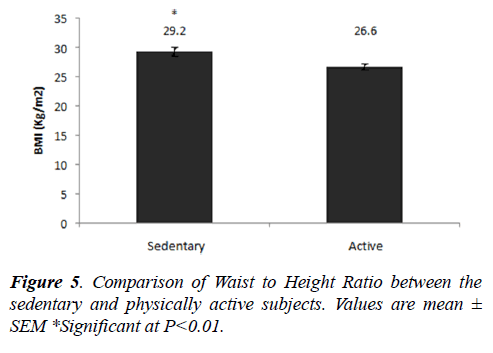
Waist to Height Ratio of sedentary subjects was also significantly higher than that of physically active subjects (0.64 ± 0.01 versus 0.58 ± 0.008) at P<0.05 (Figure 5).
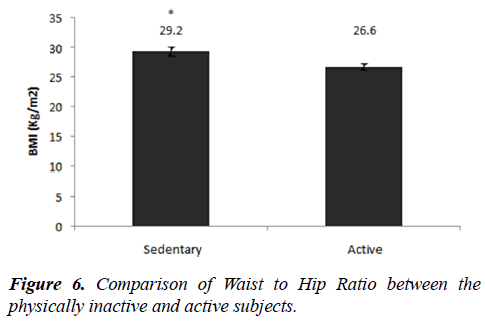
Waist to Hip Ratio (WHR) was not different significantly in this population. Sedentary subjects have a mean value of 0.94 ± 0.008 while physically active subjects have 0.97 ± 0.008 (Figure 6).
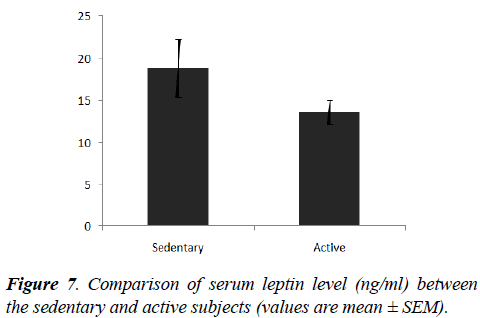
Serum leptin level (ng/ml) of physically active subjects was lower than that of physically inactive subjects (13.50 ± 1.41 versus 18.76.4 ± 3.48) but it could not reach statistical significance (Figure 7).
Results of this project showed that physically active and inactive subjects are approximately similar in numbers in this population. Physical activity in leisure time, i.e., not associated with profession was considered or strong professional physical activity was included. 53% subjects do not perform any physical activity while 47% do walk or other physical activity regularly as a leisure time physical activity (Figure 1). Majority of the subjects, who perform physical activity, generally do it regularly for 6-7 days a week (66.03%), while another 13.2% and 20.75% subjects do it for 2-3 days and 4-5 days (Figure 2). Majority of the subjects perform physical activity at a moderate speed; only 17% reported brisk walk (Table 2).
Regarding duration per day was variable among subjects; 28% subjects perform physical activity for 10-30 minutes per day while only 42% do it for 30-60 minutes per day (Table 1). It is concluded that many subjects who perform physical activity, do it quite casually and not up to the limit of reasonable health effects but still they try to do as per their understanding.
Physically active subjects have a significantly lower BMI than the sedentary subjects (P<0.05). Same is true for waist circumference and WHiR. Leptin level were decreased in physically active subjects but could not reach statistical significance. Tuomilehto showed that type 2 Diabetes could be prevented by changes in life styles of high risk subjects [11]. Ramachandran demonstrated that lifestyle modifications can prevent diabetes in Asian Indians with impaired glucose tolerance [12]. Hu et al. demonstrated that after a long term cohort study type 2 Diabetes could be prevented by adoption of a healthier lifestyle to reduce obesity in women [13].
It is concluded from this study that type 2 diabetic subjects have unhealthy body composition and about half of them are essentially sedentary. Reduced physical activity is strongly associated with increased incidence of obesity indicators and also associated with increased serum leptin levels. Increased leisure time physical activity was found to be associated with reducing obesity and leptin levels hence improvement in the management of diabetic status in this population. Physical activity should be promoted and prescribed by the physicians for the appropriate health effects in type 2 diabetic subjects.
Acknowledgements
We are obliged to PMRC Sir Ganga Ram Hospital, Lahore and DMC, Services Hospital, Lahore for their cooperation and support for facilitating sampling for this study.
References
- World Health Organization, Western Pacific Region, International Association for the Study of Obesity, et al. The Asia–Pacific perspective: redefining obesity and its treatment. Sydney: Health Communications Australia. 2000.
- Lee, Robert D, David C, et al. Nutritional Assessment. 3rd Edition. McGraw Hill, Inc, New York. 2003.
- Fletcher B, Gulanick M, Lamendola C. Risk factors for type 2 diabetes mellitus. J Cardiovasc Nurs. 2002;16:17-23.
- Wilding JP. Neuropeptides and appetite control. Diabet Med. 2002;19: 619-27.
- Nyamdorj RQ, Qiao S, Soderberg JM, et al. BMI Compared With Central Obesity Indicators as a Predictor of Diabetes Incidence in Mauritius. Obesity. 2009;17:342-8.
- Decoda Study Group R, Nyamdorj Q, Qiao TH, et al. BMI compared with central obesity indicators in relation to diabetes and hypertension in Asians. Obesity (Silver Spring). 2008;16:1622-35.
- Qiao Q, Nyamdorj R. Is the association of type II diabetes with waist circumference or waist-to-hip ratio stronger than that with body mass index? E J Clin Nutr. 2010;64:30-4.
- Siddiqui NI, Nessa A, Hossain MA. Regular physical exercise: way to healthy life. Mymensingh Med J. 2010;19:154-8.
- Swift DL, Johannsen NM, Lavie CJ. The Role of Exercise and Physical Activity in Weight Loss and Maintenance. Prog Cardiovasc Dis. 2014;56: 441-7.
- Kralisch S, Bluher M, Paschke R, et al. Adipokines and adipocyte targets in the future management of obesity and the metabolic syndrome. Mini Rev Med Chem. 2007;7:39-45.
- Tuomilehto J, Lindstrom J, Eriksson JG, et al. Prevention of type 2 diabetes mellitus by changes in lifestyle among subjects with impaired glucose tolerance. N Engl J Med. 2001;344:1343-50.
- Ramachandran A, Snehalatha CS, Mary B, et al. The Indian Diabetes Prevention Programme shows that lifestyle modification and metformin prevent type 2 diabetes in Asian Indian subjects with impaired glucose tolerance (IDPP-1). Diabetologia. 2006;49:289-97.
- Hu FB, Manson EJE, Stampfer MJ, et al. Diet, Lifestyle, and the Risk of Type 2 Diabetes Mellitus in Women. N Engl J Med. 2001;345:790-7.
