Research Article - Journal of Genetics and Molecular Biology (2017) Volume 1, Issue 1
Modelling Growth Of Dual-purpose Sasso Hens In The Tropics Using Different Algorithms
Abdulmojeed Yakubu*, Joy Madaki
Faculty of Agriculture, Department of Animal Science, Nasarawa State University, Keffi, Shabu-Lafia Campus, Nigeria
- *Corresponding Author:
- Abdulmojeed Yakubu
Faculty of Agriculture Department of Animal Science Nasarawa State University
Keffi Shabu-Lafia Campus, P.M.B. 135 Nasarawa State Nigeria
Tel: +234 8065644748
E-mail: abdulmojyak@gmail.com
Accepted date: December 20, 2017
Citation: Yakubu A, Madaki J. Modelling growth of dual-purpose Sasso hens in the tropics using different algorithms. J Genet Mol Biol. 2017;1(1):1-9.
DOI: 10.35841/genetics-molecular-biology.1.1.1-9
Visit for more related articles at Journal of Genetics and Molecular BiologyAbstract
This study was embarked upon to evaluate body weight (BW) from age (weeks) of Sasso hens in Nasarawa State, Nigeria. A total of one hundred and eight (108) Sasso hens aged 30 weeks were randomly selected from a larger stock kept at the Livestock Farm. Fifty-four of these birds were kept on deep litter while another fifty-four were reared in battery cages. The birds in each system of management were replicated three times with eighteen birds per replicate in a completely randomized design. In both deep litter and battery cage systems, data were collected on weekly body weights of birds from week 31-52 of rearing. Only data from forty (battery cage) and forty-three (deep litter) surviving birds were eventually used for further analyses. Effect of housing system on BW was subjected to T-Test. Phenotypic correlation between body weight (BW) and age of birds was established in both systems of rearing. Linear, Quadratic, Gompertz, Artificial Neural Network (ANN) and the Classification and Regression Tree (CRT) models were used to predict BW from the age (including housing system for CRT model) of birds. There was no significant (P=0.558) difference in the total average weekly BW of birds on deep litter (3.38 ± 0.12 kg) and those in cages (3.37 ± 0.12 kg). The prediction of BW from age was best fitted using the ANN model in both the deep litter (R2 , adjusted R2 , RMSE and significance level were 87.0%, 87.0%, 0.04 and 0.000) and battery cage (R2 , adjusted R2 , RMSE and significance level were 99.0%, 99.0%, 0.01 and 0.000) systems. The CRT model, however, predicted the optimal BW to be greater than 32.5, but not above 47.5 weeks of age with R2 value of 93.4%. The present findings may be exploited in mapping out appropriate management practices geared towards increased production.
Keywords
Body weight, Management system, Sasso, Model, Prediction.
Introduction
Poultry production is one of the best available sources for the production of high biological value animal protein in terms of eggs and meat. The performance of laying hens kept in the tropics is determined to a large extent by the birds’ productive adaptability [1]. Growth is an important feature of animals which is defined as any change in body size per time unit. Studies on growth can be applied in the improvement of management and productivity of livestock breeds. Mathematical functions called growth models (each with a non-linear structure, sigmoid shape) have been used to explain the growth patterns of poultry species [2]. The main advantages of nonlinear models are parsimony, interpretability, and prediction [3]. The Gompertz model is one of the most frequently used sigmoid models fitted to growth data [4,5]. Growth curve parameters are highly heritable and have been widely exploited in poultry selection studies [6,7] for the prediction of future growth at any age [4]. The mathematical model may help to define more appropriate feeding regimens to cover the high nutritional requirements during the various growth phases [7]. It can also be used for the improvement of feed conversion achieved primarily by reducing the growing period, which has been accomplished by selection for growth rate and feed conversion [8]. ANN is a more recent robust technique that has been used to model growth in livestock [9-12], forecast the number and weight of eggs [13] and fit egg production curves [14]. Classification and regression tree (CRT) is another classical statistical approach to model growth as it is not affected by multicollinearity problem [15,16].
Sasso hens are newly introduced into the Nigerian tropical environment. However, apart from preliminary information on their morphological traits [17], no other productive records are available on these birds in Nigeria. It has been emphasized that the introduction of tropically adapted genotypes with high performance is beneficial to the resource poor poultry farmers. There is need for a genotype newly introduced to a particular environment to be characterized in order to compare with the existing genotypes and explore its genetic potential. Such knowledge on production characteristics of birds is important to guide its adoption and future effective genetic improvement. The aim of this study was to establish the relationship between age (weeks of rearing) and body weight of hens and hence, predict body weight from age in conventional cages and deep litter using different growth prediction models.
Materials and Methods
Experimental site
The experiment was carried out at the guinea savannah zone of North Central Nigeria at the Livestock Section of the Teaching and Research Farm of the Faculty of Agriculture, Nasarawa State University (8° 29' 30", 8° 31' 0").
Management systems
A total of one hundred and eight (108) Sasso hens aged 30 weeks were randomly selected from a larger stock kept at the Livestock Farm. The birds were treated in two different management systems: Fifty-four of these birds were kept on deep litter while another fifty-four were reared in battery cages. The birds in each system of management were replicated three times with eighteen birds per replicate in a completely randomized design.
Birds’ management
All the birds in each system of management were tagged individually and assigned an identification number. They were fed commercial layer mash (Vital Feed) and provided fresh clean water ad libitum from week 30 to week 52 of rearing. Routine vaccination and other management practices were strictly adhered to. There was also routine administration of antibiotics, vitamins and coccidiostat (Amprolium) in the drinking water.
Data collection
In both deep litter and battery cage systems, data were collected on weekly body weight of each bird from week 31-52 of rearing. The body weights of birds were collected using an electronic scale. Only data from forty (battery Cage) and forty-three (deep litter) surviving birds were eventually available for further analyses.
Statistical analysis
T-test was used to determine the effect of housing system on BW of Sasso hens. Phenotypic correlation between body weight and age (weeks) was computed separately for birds on deep litter and those kept in cages. The relationship between body weight and age was also established using Linear and Quadratic regression models and these were fitted as described in Yakubu and Muza-Azara [18]. The Goodness of fit was determined using the coefficient of determination (R2), adjusted R2, mean square error (MSE) and root mean square error (RMSE). Gompertz model was employed using the Levenberg-Marquardt estimation option according to the following equation [7]:
W(t)=A × exp(-B × exp(-k × t))
where: W(t)=is the body weight (kg) of birds at t weeks of age (t=31, 32, 33…, 52); A, B and k are the three model parameters such that A is asymptotic (mature) weight when time goes to infinity; B is a scaling parameter (constant of integration), which is related to the initial body weight values of W and k is the relative maturity rate and t is the time in weeks.
Weight at the inflection point was calculated as:
Wi= A/e
where e is eulerian number or base of natural logarithm (2.71828) [4].
Age at the inflection point was computed as:
ti= ln(B)/k
where ‘ln’ is the natural logarithm.
Maximum weight gain at inflection point was estimated as:
Ui=A·k/e
Pearson’s correlation coefficient between the observed and the predicted BW was also obtained. The optimal performance of the Gompertz model was determined using R2, adjusted R2, MSE and RMSE.
Artificial neural network (ANN), which has the ability to model nonlinear systems, was equally used to predict BW from age. ANN involved the use of a multi-layer perceptron (MLP) model trained by back propagation algorithm [11]. The network was trained with 70% of the data set used in this study and the output was validated with the remaining 30% of the data. Model accuracy was assessed using R2, adjusted R2, RMSE and significance level.
Classification and regression tree (CRT) or decision tree was used to determine the optimal BW (response variable) of the birds. Week of rearing and housing systems were fitted as the independent variables. The CRT reveals graphically the most important attributes that permits the prediction of the dependent variable [16]. The efficiency of the CRT model was determined using coefficient of determination (R2) as well as the risk value and its associated standard error. The R2 value was calculated as follows as described in Yakubu [19]:
R2=1-S2e
where, S2e=Unexplained variation in body weight (risk value % variance of the dependent variable). SPSS [20] was employed in all analyses.
Results
There were no significant differences (P=0.558) in the mean total weekly BW of birds in the deep litter (3.38 ± 0.12 kg) and those in battery cages (3.37 ± 0.12 kg) (Table 1).
| Week | Housing system | |||
|---|---|---|---|---|
| Deep litter | Battery cage | |||
| Mean | Standard deviation | Mean | Standard deviation | |
| 31 | 3.01 | 0.09 | 2.97 | 0.01 |
| 32 | 3.11 | 0.03 | 3.10 | 0.01 |
| 33 | 3.21 | 0.05 | 3.20 | 0.00 |
| 34 | 3.31 | 0.05 | 3.30 | 0.00 |
| 35 | 3.37 | 0.05 | 3.36 | 0.00 |
| 36 | 3.40 | 0.00 | 3.40 | 0.00 |
| 37 | 3.42 | 0.00 | 3.42 | 0.00 |
| 38 | 3.43 | 0.01 | 3.43 | 0.00 |
| 39 | 3.44 | 0.02 | 3.44 | 0.00 |
| 40 | 3.44 | 0.01 | 3.44 | 0.00 |
| 41 | 3.45 | 0.00 | 3.45 | 0.00 |
| 42 | 3.48 | 0.05 | 3.47 | 0.00 |
| 43 | 3.43 | 0.00 | 3.43 | 0.00 |
| 44 | 3.43 | 0.00 | 3.43 | 0.00 |
| 45 | 3.40 | 0.09 | 3.42 | 0.00 |
| 46 | 3.45 | 0.01 | 3.45 | 0.00 |
| 47 | 3.47 | 0.04 | 3.46 | 0.00 |
| 48 | 3.40 | 0.02 | 3.40 | 0.00 |
| 49 | 3.42 | 0.00 | 3.42 | 0.00 |
| 50 | 3.41 | 0.00 | 3.41 | 0.00 |
| 51 | 3.41 | 0.04 | 3.40 | 0.00 |
| 52 | 3.38 | 0.09 | 3.40 | 0.00 |
| Total | 3.38a | 0.12 | 3.37a | 0.12 |
Note: ab means within the same row having different lower case superscripts are different significantly (P<0.05) for total average weekly body weight.
Table 1: Average weekly body weight of Sasso hens.
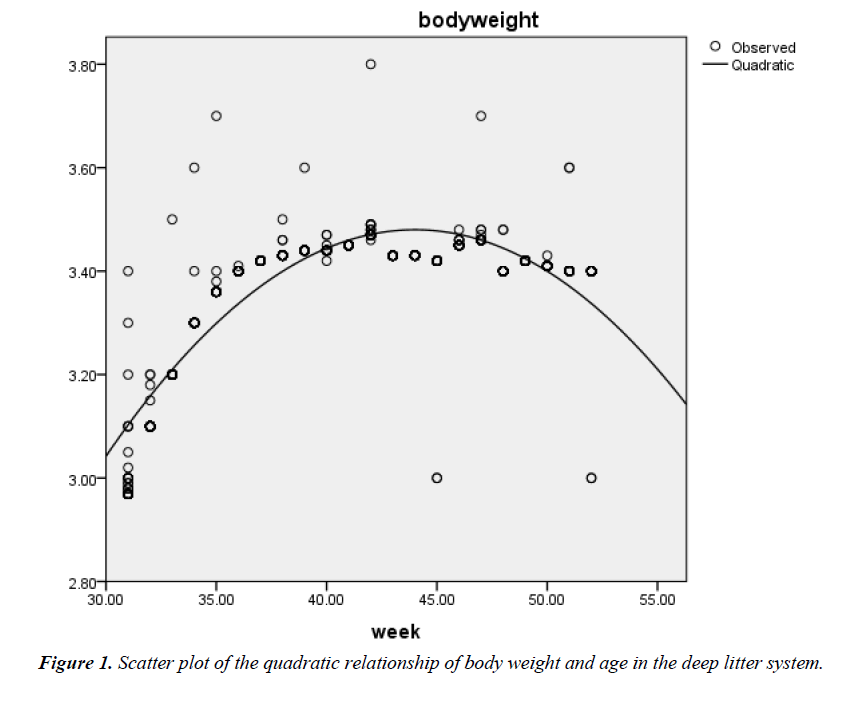
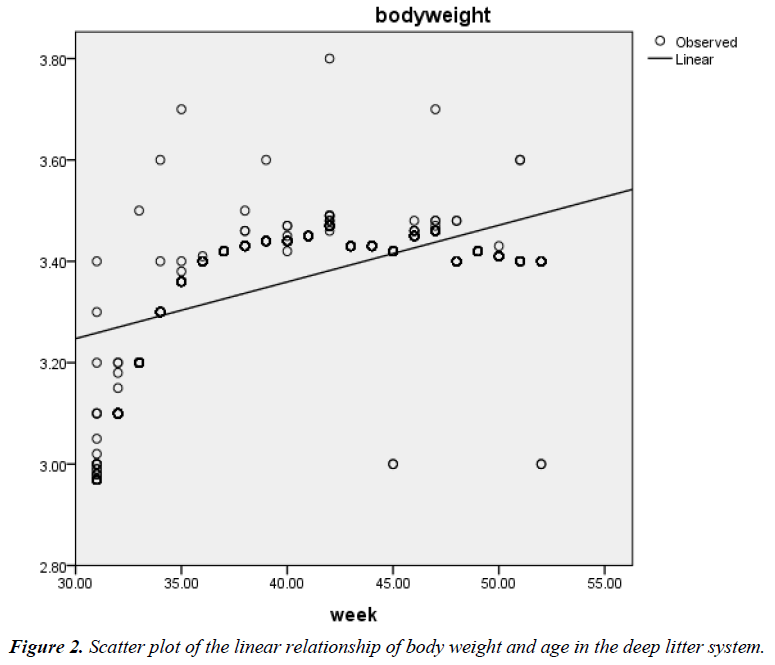
The correlation coefficient (r) between age (weeks of rearing) and BW of birds on deep litter was 0.58; P<0.01 while that of battery cage system was 0.63; P<0.01. The prediction of BW from age of hens on deep litter showed that the quadratic model fitted better (R2=0.758; Adjusted R2=0.757; RMSE=0.061) (Figure 1) than the linear model (R2=0.333; Adjusted R2=0.333; RMSE=0.100) (Figure 2). The respective regression equations were Y=2.912 + 0.011X (Linear) and Y=-0.842 + 0.196X – 0.002X2 (Quadratic).
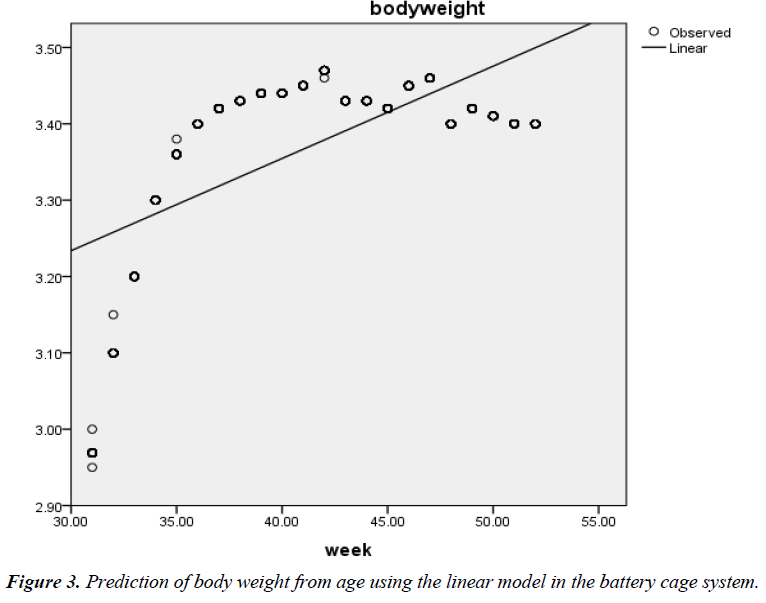
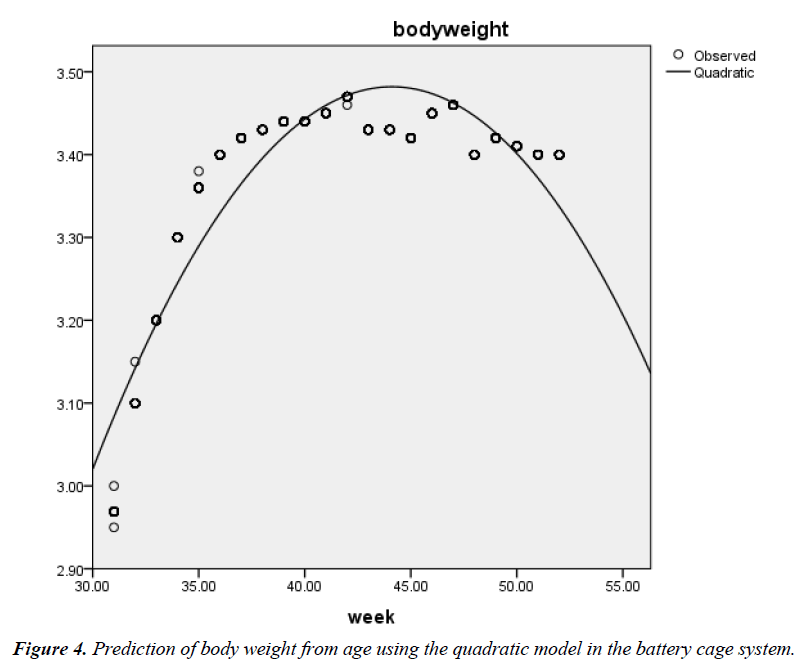
The phenotypic relationship between BW and age was also positive and highly significant (r=0.63; P<0.01) in the battery cage system. The quadratic function also gave the best fit (R2=0.852; Adjusted R2=0.852; RMSE=0.047) (Figure 3) when compared with the linear model (0.391; Adjusted R2=0.390; RMSE=0.096) (Figure 4) in the cage system. The associated regression models were Y=2.871 + 0.012X (Linear) and Y=- 1.032 + 0.205X – 0.002X2 (Quadratic).
The asymptotic weight and rate of maturity appear similar in both housing systems. Weights at the inflection point were 1.297 and 1.296 kg reached at about 6½ and 9 weeks of age by birds on deep litter and their counterparts in cages (Table 2). There was a strong negative correlation between parameters A and k in both systems (r=-0.966 and -0.959, respectively for birds on deep litter and those in cages). The correlation between the observed BW and its predicted counterpart was 0.731 (deep litter) and 0.798 (battery cage), respectively. The Gompertz model also predicted BW better in birds housed in battery cages than their counterparts kept on deep litter with high values of R2 (62.6%) and Adjusted R2 (62.5 versus 52.8%) and lower MSE (0.006 versus 0.007) and RMSE (0.077 versus 0.084) estimates.
| Parameters | Housing system | |
|---|---|---|
| Deep litter Estimates |
Battery cage Estimates |
|
| A | 3.526 (0.023) | 3.523 (0.018) |
| B | 1.863 (0.508) | 2.580 (0.603) |
| k | 0.096 (0.013) | 0.105 (0.012) |
| R2 | 52.8% | 62.6% |
| Adjusted R2 | 52.6% | 62.5% |
| MSE | 0.007 | 0.006 |
| RMSE | 0.084 | 0.077 |
| Weight at the inflection point (kg) | 1.297 | 1.296 |
| Age at the inflection point (weeks) | 6.481 | 9.027 |
| Maximum weight gain at inflection point (kg) | 0.125 | 0.136 |
| Correlation between A and k | -0.966 | -0.959 |
| Correlation between observed and predicted BW | 0.731 | 0.798 |
Note: Numbers in parentheses are standard errors
Table 2: Gompertz parameters and model performance criteria for the estimation of body weight of Sasso hens from age in two housing systems.
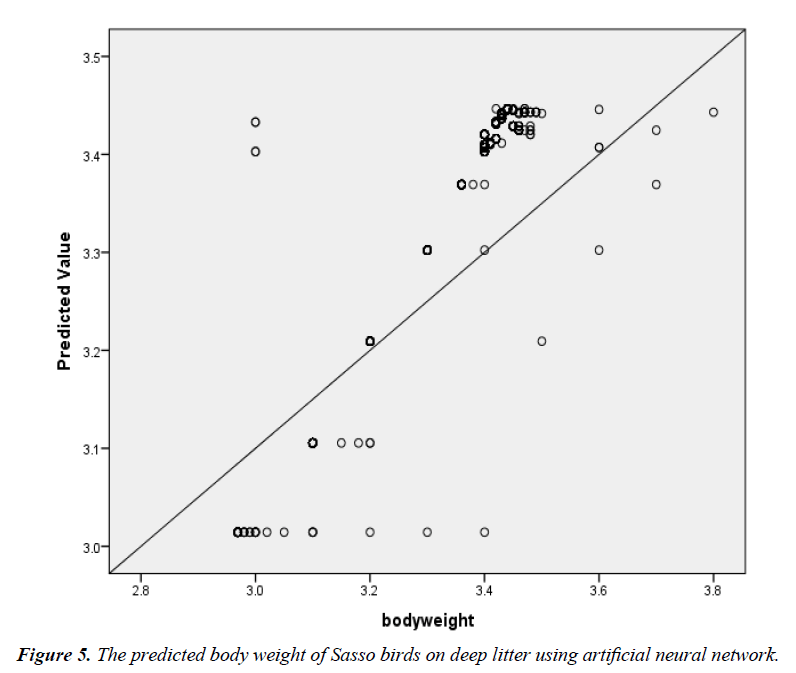
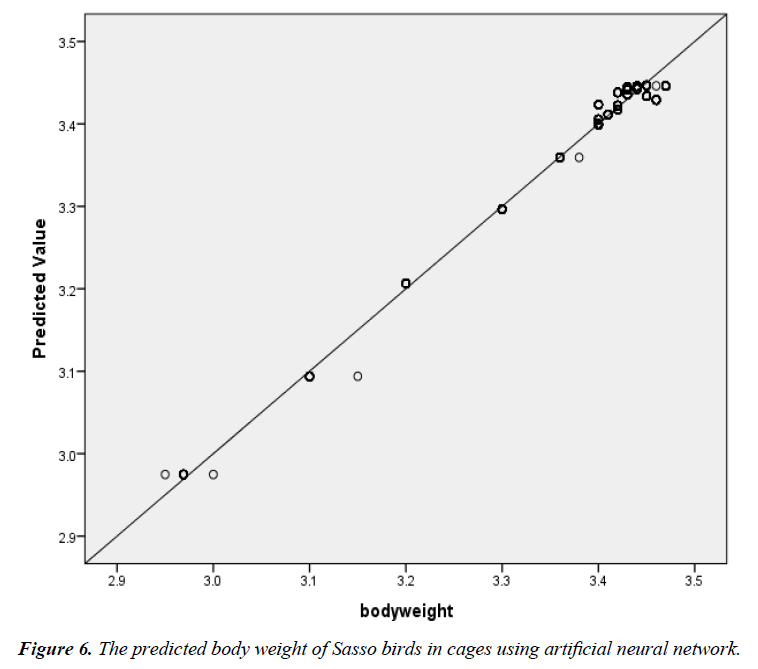
The scatter plot of the relationship between the actual BW and the predicted BW of birds in the deep litter system using ANN is shown in Figure 5. The regression line indicated a good fit. R2, adjusted R2, RMSE and significance level were 87.0%, 87.0%, 0.04 and 0.000 between the actual egg number and the predicted egg number. The corresponding R2, adjusted R2, RMSE and significance level for the battery cage system were 99.0%, 99.0%, 0.01 and 0.000 (Figure 6).
The summary statistics of observed and predicted BW of Sasso hens using ANN in both deep litter and battery cage systems are shown in Table 3. The predicted mean weekly BW value using ANN for birds on deep litter (3.377 ± 0.004) appeared similar to the observed value of 3.376 ± 0.004. On the other hand, the observed and predicted BWs of birds in cages were the same (3.373 ± 0.004).
| Body weight | Sample size | Minimum | Maximum | Mean | Standard error | |
|---|---|---|---|---|---|---|
| Deep litter | Observed | 946 | 2.970 | 3.800 | 3.376 | 0.004 |
| ANN Predicted | 946 | 3.010 | 3.450 | 3.377 | 0.004 | |
| Battery cage | Observed | 880 | 2.950 | 3.470 | 3.373 | 0.004 |
| ANN Predicted | 880 | 2.970 | 3.450 | 3.373 | 0.004 | |
Table 3: Descriptive statistics of the actual and predicted body weight of Sasso hens using artificial neural network.
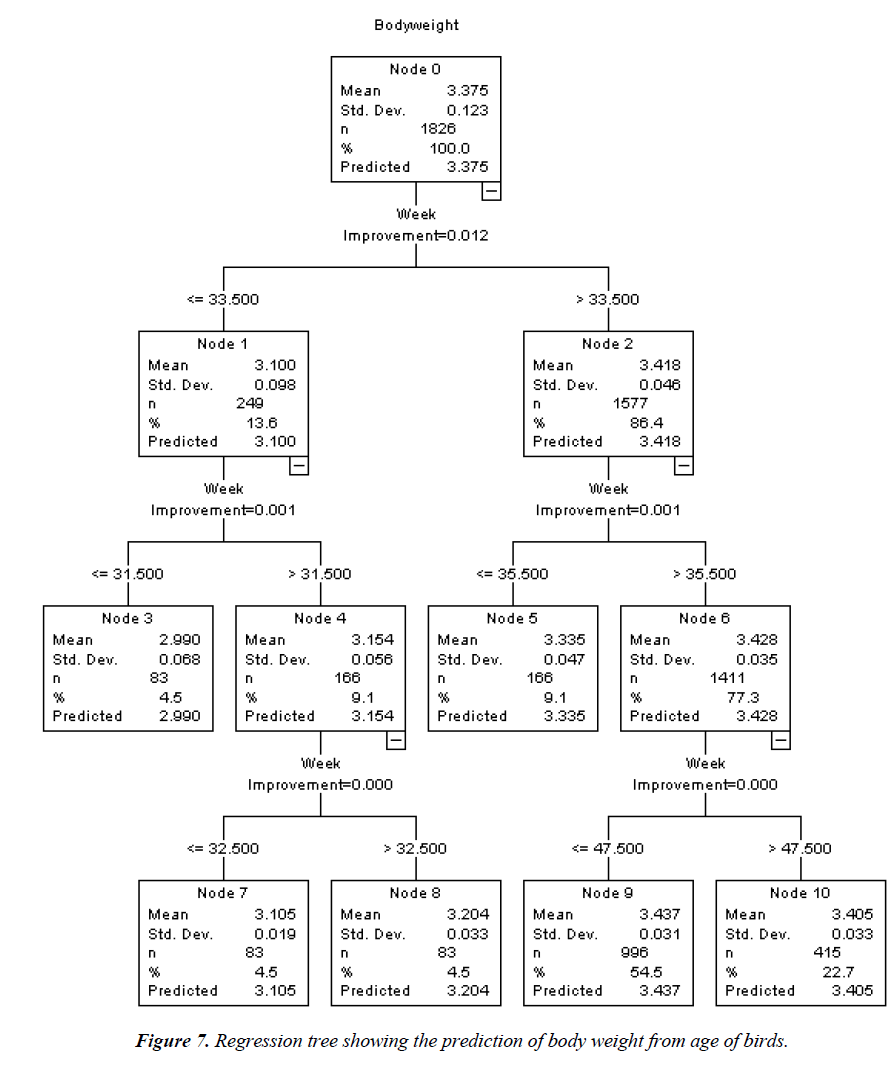
The CRT model (Figure 7) yielded one root node (Node 0) which indicates BW and six terminal nodes (Nodes 3, 5, 7, 8, 9 and 10). Of these terminal nodes which did not branch further, Node 9 (age=less than or equal to 47.5 weeks) had the highest prediction for BW (3.437 kg). The respective percentage gain for each terminal node was 54.5% (Node 9), 22.7% (Node 10), 9.1% (Node 5) with Nodes 8, 7 and 3 having 4.5% each. The R2, risk value and the associated standard error of the CRT model were 93.4%, 0.001 and 0.000, respectively.
Discussion
It is interesting to note that the Sasso birds used in the present study are of dual-purpose (meat and egg production) and were originally developed to be reared under the low-input scavenging system of the smallholder farmers. This is reflected in the total average weekly BW of the Sasso birds. The current BW values (3.37-3.38 kg) are higher than the 1.69 kg BW reported for a commercial laying strain (Lohmann White hens) that were 40-54 weeks old in Turkey [21] as well as the average weekly weights of 1.69 kg and I.75 kg, respectively reported for Bovans Brown and Lohmann Brown birds in Nigeria [1]. There was no significant total average weekly body weight difference in the present study when birds in the two management systems were compared. Contrastingly, Yousaf and Ahmad [22] reported that BW loss was higher in cages compared to the deep litter system.
The quadratic model, which was parabolic in shape, described better the actual pattern of BW compared to the linear model. The superiority of the quadratic model in this study is congruous to the submission of Song [23] where R2 value of 0.926 was recorded for the quadratic function as against 0.865 of the linear model for layers between 21 and 75 weeks of age.
A point of inflection during growth phases is coincident with maximum growth rate [24]. The flexibility in the location of one or more inflection points therefore provides the opportunity to analyze the time of the maximum or minimum rate of change. In general, the point of inflexion occurs at weights less than half of final weight and varies depending on age, sex, breed, type of animal feeding regimes amongst other factors. Therefore, it has been reported in many cases that growth models with a flexible inflexion point as observed in the present study, fit growth data better [25]. In their own submissions, asymptotic or adult weight of an animal, the rate at which the adult weight is attained [16] and the standardized age at the inflection point of the growth curve [26] are parameters of importance that can be exploited by geneticist and breeders alike to increase productivity. The maturing rate (k) values of 0.096 and 0.105 of the current study appear to be close to the 0.137 reported for an Italian nondescript chicken breed from 2-24 weeks of age [7]. The negative relationship between the asymptotic weight and rate of maturity implies that as the mature weight increases, the maturity rate decreases. This is consistent with the findings of Raji et al. [4] in a related study on quails were females with lower maturity rate had higher mature weights. Although the R2 and adjusted R2 values of the Gompertz model are not as high as those of quadratic model in the present study, it should be noted that they actually do not represent a good metric for assessing the performance of nonlinear models as they do not account for the number of parameters amongst others. Hence, it was proposed that they should not be used in isolation, but in combination with other Goodness of fit algorithms [27,28]. In this wise, the low MSE and RMSE values obtained in the present study showed that the Gompertz model fitted well and was better with respect to birds in cages. Knowing the pattern of growth of birds enables producers to plan ahead in the aspects of amount of feeds that will be required to sustain the birds at particular ages, predict body size, and also enables selection of elite birds through growth parameter values which may be fitted in the subsequent selection index. However, the differences in values of Gompertz parameters observed between the current study and others may be attributed to breed, age of measurements, environment, management practices, sample size, estimation method and number of model parameters.
BW is a veritable measure of growth with its successive measurements forming a growth curve [29]. It is opined that statistical algorithms that are required at a particular point in time depends on the nature of growth. In the current study, the ANN algorithm appears to estimate growth better from week 31 to week 52 than the linear, quadratic and Gompertz functions. For the modelling of biological growth, neural networks have been recommended as alternative to regression analysis as they produced in chickens little or no overestimation of the observed BW responses [30]. The present near perfection R2 value is similar to the 0.998 reported by Ahmad [9] in a related study on the growth of broilers.
From the CRT model, it can be inferred that the optimal BW is greater than 32.5, but not above 47.5 weeks of age. The predicted weight of 3.437 kg under the CRT model is close to the mature (asymptotic) weights of 3.526 and 3.523 kg recorded in the Gompertz model for birds in deep litter and battery cage, respectively. This may equally be considered when making decisions on how to optimize feeding and genetically improve the stock. The present result is comparable to that of Okoro et al. [31] where BW optimality was attained at week 34 of age (>32.5<47.5 weeks of the present study). In a related study, Oguntunji [16] estimated BW from some biometric parameters of Muscovy ducks using CRT, with high prediction accuracy.
Conclusion
Although mean total weekly BW of Sasso birds was not significantly influenced by housing system, the trajectory of its growth from week 31-week 52 of age varied. The ANN model appeared to perform better than the linear, quadratic and Gompertz equations in the prediction of BW from age. The growth estimations were also higher in birds kept in cages than their counterparts reared on deep litter. However, the optimal BW was predicted to be greater than 32.5, but not above 47.5 weeks of age as revealed by the CRT model. The present information may be used by farmers to work out the best feeding practices and selection strategies to improve the performance of the birds.
Acknowledgement
We thank Prof. E.B. Sonaiya, Principal Investigator (PI), the Co-PI, Prof. Mrs O.A. Adebambo and the National Project Coordinator, Dr. Oladeji Bamidele of African Chicken Genetic Gains-Nigeria (ACGG-Ng) project for the donation of the Sasso birds.
References
- Yakubu A, Salako AE, Ige AO. Effects of genotype and housing system on the laying performance of chickens in different seasons in the Semi-Humid Tropics. Int J Poult Sci. 2007;6:434-9.
- Narinç D, Oksüz N, Aygün A. Growth curve analyses in poultry science. World's Poult Sci J. 2017;73:395-408.
- Bates DM, Watts DG. Nonlinear regression analysis and its applications. Wiley Ser. Probab Stat John Wiley and Sons, New York, USA. 2007.
- Raji AO, Alade NK, Duwa H. Estimation of model parameters of the Japanese quail growth curve using Gompertz model. Arch. Zootec. 2014;63:429-35.
- Tjørve KMC, Tjørve E. The use of Gompertz models in growth analyses, and new Gompertz-model approach: An addition to the Unified-Richards family. PLoS One. 2017;12:e0178691.
- Mignon-Grasteau S, Beaumont C, Ricard FH. Genetic analysis of a selection experiment on the growth curve of chickens. Poult Sci. 2001;80:849-54.
- Selvaggi M, Laudadio V, Dario C, et al. Modelling growth curves in a nondescript Italian chicken breed: An opportunity to improve genetic and feeding strategies. J Poult Sci. 2015;52:288-94.
- Marks HL. Genetics of growth and development. In: World Animal Science, Poultry Production (P. Hunton ed.). Elsevier, Amsterdam. 1995:170-82.
- Ahmad HA. Poultry growth modeling using neural networks and simulated data. J Appl Poult Res. 2009;18:440-6.
- Raja TV, Ruhil AP, Gandhi RS. Comparison of connectionist and multiple regression approaches for prediction of body weight of goats. Neural Comput Applic. 2012;21:119-24.
- Ghazanfar S. Application of linear regression and artificial neural network for broiler chicken growth performance prediction. Iran J Appl Anim Sci. 2014;4:411-6.
- Felipe VPS, Silva MS, Valente BD, et al. Using multiple regression, Bayesian networks and artificial neural networks for prediction of total egg production in European quails based on earlier expressed phenotypes. Poult Sci. 2015;94:772-80.
- Semsarian, S, Nasab MPE, Zarehdaran S, et al. Prediction of the weight and number of eggs in Mazandaran native fowl using artificial neural network. Int J Adv Biol Biomed Res. 2013;5:532-7.
- Faridi A, Golian A. Use of neural network models to estimate early egg production in broiler breeder hens through dietary nutrient intake. Poult Sci. 2011;90:2897-903.
- Mendes M, Akkartal E. Regression tree analysis for predicting slaughter weight in broilers. Ital J Anim Sci. 2009;8:615-24.
- Oguntunji AO. Regression tree analysis for predicting body weight of Nigerian muscovy duck (Cairina moschata). Genetika 2017;49:743-53.
- Yakubu A, Ari MM. Principal component and discriminant analyses of body weight and conformation traits of Sasso, Kuroiler and indigenous Fulani chickens in Nigeria. J Anim Plant Sci. 2018 (in press).
- Yakubu A, Musa-Azara IS. Evaluation of three mathematical functions to describe the relationship between body weight, body condition and testicular dimensions in Yankasa sheep. Int J Morphol 2013;31:1376-82.
- Yakubu A. Application of regression tree methodology in predicting the body weight of Uda sheep. Scientific Papers Anim Sci Biotech. 2012;45:484-90.
- SPSS. Statistical Package for Social Sciences. SPSS Inc., Chicago, IL60611, USA. 2015.
- Lacin E, Yildiz A, Esenbuga N, et al. Effects of differences in the initial body weight of groups on laying performance and egg quality parameters of Lohmann laying hens. Czech J Anim Sci. 2008;53:466-71.
- Yousaf M, Ahmad N. Effects of housing systems on productive performance of commercial layers following induced molting by aluminium oxide supplementation. Pak Vet J. 2006;26:101-4.
- Song E. Statistical interpretation of experiments with laying hens (Dissertation). University of Georgia, USA. 2012.
- Crawford RD. Poultry Breeding and Genetics. Elsevier Science Publishers, Amsterdam. 1990.
- Kuhi HD, Porter T, López S, et al. A review of mathematical functions for the analysis of growth in poultry. World's Poult Sci J. 2010;66:227-39.
- Brody S. Bioenergetics and Growth. Reinhold Publishing Corp. NY, USA. 1945.
- Wallach D. Evaluating crop models. In: Wallach D, et al. (eds). Working with dynamic crop models: Evaluations, analysis, parameterization, and applications. Elsevier, Amsterdam; 2006:11-53.
- Archontoulis SV, Miguez FE. Nonlinear Regression Models and Applications in Agricultural Research. Agron J. 2015;107:786-98.
- Honkatukia M, Tuiskula-Haavisto M, Vilkki J. Chromosome regions affecting body weight in egg layers. Agric Food Sci. 2011;16:177-8.
- Roush WB, Branton SL. Comparison of Gompertz and neural network models of broiler growth. Poult Sci. 2006;85:794-7.
- Okoro VMO, Ravhuhali KE, Mapholi TH, et al. Effect of age on production characteristics of Boschveld indigenous chickens of South Africa reared intensively. S Afr J Anim Sci. 2017;47:157-67.
