Research Article - Environmental Risk Assessment and Remediation (2017) Volume 1, Issue 1
Modeling of Nucleation Rate of Supersaturated Calcium Sulfate Solutions.
David Jonathas*
Department of Chemical and Environmental Engineering, Master of Science in Environmental Engineering, the University of Arizona, USA
- *Corresponding Author:
- David Jonathas
Department of Chemical and Environmental Engineering
Master of Science in Environmental Engineering
The University of Arizona
USA
Tel: +15202455391
E-mail: johndave2009@gmail.com
Accepted date: January 19, 2017
Citation: Jonathas D. Modeling of Nucleation Rate of Supersaturated Calcium Sulfate Solutions. Environ Risk Assess Remediat. 2017;1(1):30-39
Abstract
Reverse osmosis treatment of the Central Arizona Project (CAP) water provokes scaling because of its high content in salt. Experiments simulating various solutions of calcium sulfate (CaSO4) made by mixing of sodium sulfate (Na2SO4) and calcium chloride (CaCl2) reinforced this idea. An increase of the degree of supersaturation of the solution from 8.67 to 42.08 decreased the induction time for precipitation of calcium sulfate solutions. The use of Flocon® 135 as antiscalant increased the induction time. The increase was directly related to the concentration of antiscalant. Working with 11.06 degree of supersaturation, a dose 0 ppm of antiscalant has an induction time of 217 minutes. A dose of 0.5 ppm of Flocon 135 inhibits completely the crystal growth in solution. The use of 21.07 degree of supersaturation showed an induction time of 36 minutes for 0 ppm of antiscalant, 78 minutes for 0.25 ppm of antiscalant, 91 minutes for 0.5 ppm of antiscalant, 119 minutes for 0.75 ppm of antiscalant, 139 minutes for 1 ppm of antiscalant, 243 minutes for 1.25 ppm of antiscalant, and crystal growth and nucleation rate are completely inhibited by use from 2 ppm or more of antiscalant. The use of a solution of 42.08 degree of supersaturation gave the following results: 11 minutes to nucleation for 0 ppm of antiscalant, 19 minutes for 0.5 ppm of antiscalant, 24 minutes for 1 ppm of antiscalant, 36 minutes for 1.5 ppm of antiscalant, 84 minutes for 2 ppm of antiscalant, and 123 minutes for 2.5 ppm of antiscalant. The nucleation rate was 2.1 × 10⁹ nuclei/cm3.min for 8.67 degree of supersaturation to 1.26 × 1027 nuclei/cm3.min for 42.06 degree of supersaturation. Logarithmic plots of the induction time (tind ) as function of 1/[ln(S)]2 for calcium sulfate without and with addition of antiscalant for fixed temperature provides a linear trend with slope B as a constant proportional to the surface tension and molar volume. Modeling of the nucleation rate allows predicting the induction time by knowing a unique constant value (C=22.86) associated to each nucleation rate (from 5.05 × 10¹¹ to 1.22 × 1028). Each nucleation rate values are related to a specific degree of supersaturation (from 8.67 to 42.06) by this equation:
Keywords
Nucleation, Supersaturated.
Introduction
Arizona has a desert climate and water is a big issue here. About 2.5 million acre-feet of groundwater are mined each year in the state in order to satisfy demand. Without any long-term solution, there are risks of serious structural damage to homes, agricultural lands and industry from groundwater overdraft. The Central Arizona Project (CAP) project was authorized to counteract the overdraft by providing an alternative source of surface water. The canal is 336 miles extending from Lake Havasu City to the Tucson Active Management Area (TAMA). Water demand in the TAMA is about 400,000 AFY. It is satisfied through contradictory natural groundwater replenishment (15%) CAP deliveries (60%) and incidental reused of water (Figure 1).

Figure 1. Water demand/supply projections in the TAMA.
The CAP water has a high concentration in total dissolved solids (Table 1). A straight forward mass balance indicts that CAP water brings about 200,000 metric tons of salt into the TAMA each year. Without any salt management program, there will be an increase of about 5 mg/L-year of salt in the regional aquifer. The salt content of the aquifer will double over the next 50 years. Reverse osmosis (RO) is used to separate salt from water. Water is forced through a semi-permeable membrane under sufficient pressure to overcome osmotic pressure of the feed water source. Required pressure depends on feed water salinity, the fraction of water recovered and the membrane type itself. Recovery is the percentage of influent water recovered as reverse osmosis permeates. Scaling problems during the reverse osmosis process decrease the percentage of recovery, lead to higher pressure requirements and reduce the permeability of the membrane. Scaling problems during reverse osmosis process can be avoided by use of antiscalant.
| Precipitate | Ion Concentration | Log (ion product) | log Kso | Degree of Saturation(b) |
|---|---|---|---|---|
| BaSO4(s) | [Ba+2]=1.17 × 10⁻⁶M [SO4-2]=2.81 × 10⁻³M |
-8.48 | -10.0 | 827.83 |
| CaSO4(s) | [Ca+2]=2.0 × 10⁻³M | -5.25 | -4.85 | 9.95 |
| CaCO3(s) | [CO3-2]=1.0 × 10⁻³ M(a) | -7.7 | -8.48 | 150.64 |
Table 1. Concentration and solubility data for CAP water species that may contribute to membrane scaling [1].
Chemical composition of many known antiscalant is not welldefined by the manufacturer. So, their rational selection for membrane separations is difficult. The need of direct antiscalant testing on the water to be treated is more than necessary [2].
Understanding the effect of amino trismethylenephosphonic acid (ATMP) on calcium sulfate dehydrate (gypsum) was accrued out (Table 2) [3]. Mahmoud et al. [4] studied the effect of surfactants on the crystallization of gypsum under conditions of the simulated dehydrate process of phosphoric acid production. Experimental determination of antiscalant effectiveness has been limited to quantification of scaling behavior based on flux decline measurements or determining the extent of surface area coverage by mineral scale [5]. However, efforts to date have not yield quantitative information regarding the impact of antiscalants on mineral crystal nucleation rate. Investigation of the nucleation rate without and with addition of antiscalant should give a more fundamental and means of prediction of the induction time [6].
| Water Quality Constituent (mg/L) | Tucson Water Production Wells | CAP Water |
|---|---|---|
| Total Dissolved Solids | 259 | 666 |
| Hardness (as CaCO3) | 119 | 270 |
| Sodium | 40 | 112 |
| Chloride | 17 | 104 |
| Calcium | 39 | 56 |
| Magnesium | 5 | 31 |
| Sulfate | 45 | 280 |
| Alkalinity (as CaCO3) | 126 | 98 |
| TOC | <1 | 3.5 |
Table 2. Water quality comparison between Tucson groundwater and CAP water.
Materials and Methods
The experiment
The basis of the experiment is to determine the induction time for precipitation of calcium sulfate in solution using a jar tester. Different degrees of supersaturation of the solution are used based on the activities of calcium and sulfate ions present in solution. Addition of antiscalant and the impact on the induction time for precipitation of calcium sulfate where studied as well.
Preparation of CaCl2·2H2O and Na2SO4 solutions
One molar calcium chloride solution was prepared by diluting 147.02 grams of CaCl2.2H2O in one liter of distilled water. A volumetric flask of 1 liter was used to prepare the solution. Also, one molar sodium sulfate was prepared by adding 111 grams of Na2SO4 to a liter of water. A volumetric flask of 1 liter was used again to dissolve the chemical. These were stock solutions for the experiments that followed.
Preparation of 5 g/L antiscalant stock solution
Flocon® 135 is a pure antiscalant in liquid form. Its impact on induction time was evaluated here. Five grams of pure liquid antiscalant was added to 1 liter volumetric flask and diluted with deionized water a final volume of 1 liter. Calculation was made to end up to 0.25 ppm until 4 ppm concentration of antiscalant to use.
About 1 mL was taken from the 1 L stock solution of antiscalant and put in a 100 mL volumetric flask and completed with DI water. The new concentration was then 50 mg/L from this calculation:
C1V1=C2V2
(5 g/L) × (1 mL)=C2 × (100 mL)
C2=50 mg/L
So, to know the volume to take from the 1 L stock solution of antiscalant and to end up to 0.5 ppm (0.5 mg/L) concentration of antiscalant, this calculation was made:
C1V1=C2V2
(50 mg/L) × (V1)=(0.5 mg/L) × (1 L)
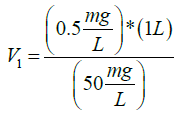
V1=10 mL
Preparation of supersaturated CaSO4 solution
To prepare a solution with a degree of supersaturation of 31.7, the followed were carried out. About 92 mL from the 1 liter of stock solution of Na2SO4 was transferred to a 500 mL volumetric flask. Water was added to the volumetric flask to reach a final volume of 500 mL. The same procedure was followed with CaCl2·2H2O.
Mixing of prepared solutions
A beaker of 2 liter capacity was used to mix the two solutions which was 1 liter total. The sodium sulfate solution was added first to the beaker. And then, the calcium sulfate was poured in the calcium sulfate solution in the beaker. Reactors were duplicated in parallels in each experiment to establish reproducibility (Figure 2).

Figure 2. Jar tester for calcium sulfate precipitation during the experiment.
Data measurement
Two solutions in the beaker marked the beginning of each experiment. Time after mixing was monitored and recorded. The solution-stirring was performed at constant speed using a jar tester with mechanic stirrers. Other author used instead to steer the solution magnetic stirrer at constant speed [7]. A dual-path spectrophotometer (Shimadzu UV-160A) was used to record the time-dependent absorbance of the stirred solutions (Figure 3). The spectrophotometer was zeroed with distilled water. The wavelength used for the measurement was 600 nm. Absorbances of samples were measured against distilled water. Each 5 minutes 2-3 ml of CaSO4 solution were withdrawn for absorbance measurements.

Figure 3. Spectrophometer for data measurement about turbidity of the calcium sulfate solutions.
Determination of the degree of supersaturation of calcium sulfate
Defined volumes of sodium sulfate and calcium chloride were withdrawn from the 1 molar stock solution to produce specific degrees of supersaturation of calcium sulfate after mixing (Table 3). The calculation provided illustrates details for preparing a solution of 31.7 degree of supersaturation of calcium sulfate (Figure 4).
| 21.07 degree of supersaturation of calcium sulfate with 0 ppm antiscalant | |||
|---|---|---|---|
| Test 1 | Test 2 | ||
| Time (min) | Absorbance | Time (min) | Absorbance |
| 1 | 0.068 | 2 | 0.07 |
| 6 | 0.054 | 7 | 0.08 |
| 12 | 0.083 | 14 | 0.063 |
| 19 | 0.058 | 20 | 0.063 |
| 25 | 0.061 | 26 | 0.064 |
| 29 | 0.064 | 32 | 0.072 |
| 32 | 0.07 | 34 | 0.071 |
| 39 | 0.077 | 40 | 0.075 |
| 47 | 0.095 | 49 | 0.096 |
| 55 | 0.117 | 56 | 0.118 |
| 58 | 0.14 | 59 | 0.15 |
| 69 | 0.276 | 70 | 0.229 |
| 74 | 0.382 | 76 | 0.283 |
| 77 | 0.44 | 77 | 0.359 |
| 83 | 0.635 | 84 | 0.5 |
| 96 | 0.803 | 97 | 0.688 |
| 116 | 0.988 | 116 | 0.99 |
| 134 | 1.146 | 135 | 1.1 |
Table 3. Data of the 21.07 degree of supersaturation of calcium sulfate with 0 ppm of antiscalant.

Figure 4. Graphs presenting the exponential equations to calculate the induction time of the 21.07 degree of supersaturation of calcium sulfate with 0 ppm of antiscalant.
Calculation for Na2SO4
V1 * C1=V2 * C2
C1=142 g/L
V1=92 mL
V2=500 mL
C2=26.13 g/L
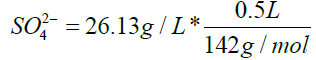
SO4 2-=0.092 mol
Calculation for CaCl2
V1 * C1=V2 * C2
C1=111 g/L
V1=92 mL
V2=500 mL
C2=20.42 g/L
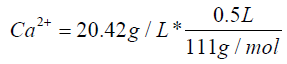
Ca2+=0.092 mol
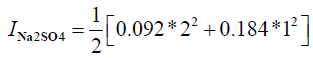
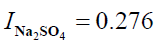
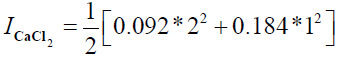
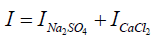
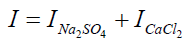
I=0.276+0.276
I = 0.552
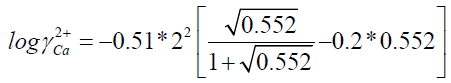
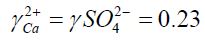
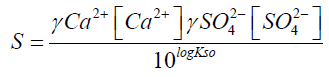
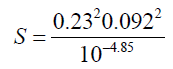
S = 31.7
I: Ionic strength
?: activity coefficient
S: supersaturation of a solution
Determination of the induction time of precipitation of calcium sulfate
The bold data was used to calculate the average ÿ value which served to determine the induction time.
The induction time was determined by calculation using each of the graphs presented. Data from the flat part of the graph before precipitation reactions were evident are used to calculate an average value of ÿ. Five times the standard deviation (σ) was added to the average data of the flat part of the curve. Following the onset of precipitation, solution absorbance values generally increased exponentially for at least a few minutes (Table 4). The induction time for each experiment was arbitrarily calculated from: 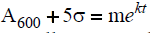 after m, k and σ were determined experimentally. A tind value was determined in this manner from each experiment. Values showed in summary tables and figures are the average y duplicate experiments in parallels.
| 21.07 supersaturated calcium sulfate with 0 ppm of antiscalant | |||
|---|---|---|---|
| Test 1 | Test 2 | ||
| Time (min) | Absorbance | Time (min) | Absorbance |
| 1 | 0.068 | 2 | 0.07 |
| 6 | 0.054 | 7 | 0.08 |
| 12 | 0.083 | 14 | 0.063 |
| 19 | 0.058 | 20 | 0.063 |
| 25 | 0.061 | 26 | 0.064 |
| 29 | 0.064 | 32 | 0.072 |
| 32 | 0.07 | 34 | 0.071 |
| 39 | 0.077 | 40 | 0.075 |
| Average (ÿ) | 0.066875 | Average (ÿ) | 0.06975 |
| Standard deviation (σ) | 0.009717 | Standard deviation (σ) | 0.006135 |
| y value (y=ÿ+5*σ) | 0.194607 | y value (y=ÿ+5*σ) | 0.168833 |
| y=0.0089 | y=0.0117 | ||
| 0.194607=0.0089 | 0.168833=0.0117 | ||
| x=61 | x=62 | ||
Table 4. Methodology to calculate the induction time of the 21.07 degree of supersaturation of calcium sulfate with 0 ppm of antiscalant.
Determination of the nucleation rate of calcium sulfate
The nucleation rate of calcium sulfate was calculated using equation 9 plotted in Excel. Most of the parameters used (pre-exponential value, surface tension, molar volume, Boltzmann constant, temperature) are constant and their value was plotted. The other values (degree of supersaturation and induction time) were determined by some methods explained earlier.
Results and Discussions
Various degrees of supersaturation of calcium sulfate without addition of antiscalant
Experiments were conducted with various degrees of supersaturation of calcium sulfate without addition of antiscalant. Those data show a decrease of the measured induction time when the degree of supersaturation increases. Crystal growth increases in a trend related to the degree of supersaturation. Scaling occurs faster during RO process when the salt concentration in the water is higher. Results from [8-10] experiments shown an increase of the degree of supersaturation of calcium sulfate when the Gibbs free energy change needed for the formation of critical nucleus size decreased.
Various degrees of supersaturation of calcium sulfate with addition of antiscalant
Experiments were also conducted with various degrees of supersaturation of calcium sulfate with addition of antiscalant. The results are combined in (Figure 5).

Figure 5. Absorbance for various degrees of supersaturation of calcium sulfate.
Various degrees of supersaturation of calcium sulfate in increase level are plotted versus the induction time in minutes. We see a gradual tendency for the graphs to go far to the right which correspond to higher induction time. This mean the induction time increases with a decrease of the degree of supersaturation [11]. That means during Reverse osmosis operation lower concentration of salt in the feed water is favorable to the treatment. And in case of increase of salt in the feed water like in the case of a brackish water an inhibition is needed like an antiscalant to push the system in the reverse mode of what it will intend to do. An antiscalant would increase the induction time by now allowing particles of salt like calcium sulfate to stick together and form bigger particles (Figure 6). Modeling of the addition of antiscalant in various supersaturated solutions of calcium sulfate.

Figure 6. Effect of antiscalant (Flocon 135) on 2 different supersaturated solutions of calcium sulfate.
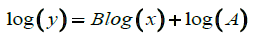
We are trying to find a model which can fit the relation between the concentration of antiscalant use to delay the salt deposit (induction time) during reverse osmosis process (RO) to get clean water. Modeling of the result can open broad perspective for the results [12].
We were able to find an equation in the form: y=AxB
with x: amount of antiscalant (ppm)
y: induction time (minutes)
This equation was picked because it can fit our data.
We can then write the equation in this form:
 (21)
(21)
which is related to the affine equation: y=mx+b
 (22)
(22)
Equation (22) fit the results of the close relation between induction time and amount of antiscalant (Figure 7) use during RO process. The result seems to support our conclusions of an increase of the amount of antiscalant impact.

Figure 7. Logarithmic of the concentration of antiscalant (log y) versus logarithmic of the induction time (log x) for 21.07 degree of supersaturated solution of calcium sulfate.
We can finalize the calculation and
We ended up with: log (A)=2.2752 and Blog(x)=0.8623log(x)
After calculation: A=188.45
and B=0.8623
So, the equation of the progressive addition of antiscalant in the 21.07 degree of supersaturation of calcium sulfate which has an impact on the induction time is:
Y=188.45x0.8623 (23)
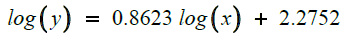
log(y)=1.1659 log(x) + 1.512 (14)
log (A)=1.512 and Blog(x)=1.1659log(x)
A=32.51
B=1.1659
y=32.51x1.1659 (24) (Figure 8)

Figure 8. Logarithmic of the concentration of antiscalant (log y) versus logarithmic of the induction time (log x) for 42.06 degree of supersaturated solution of calcium sulfate.
From all those figures above, it can be concluded that progressive addition of antiscalant delayed the crystal growth and the nucleation rate. Measurement of the induction time shows delays. And more addition of antiscalant provokes complete inhibition of precipitation of calcium sulfate. A form of y=AxB curve was used to model the amount of antiscalant added (x) and the measured induction time related (y) [13]. Logarithmic plots of the induction time versus degree of supersaturation of calcium sulfate solutions with different addition of antiscalant shows linear curves (Figure 9) with a gradual decrease of the slope.

Figure 9. Logarithmic plot of the induction time versus degree of supersaturation of calcium sulfate solutions with different addition of antiscalant.
Predicted nucleation rate and induction time of supersaturated calcium sulfate solutions at room temperature
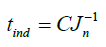
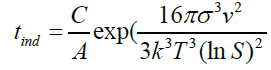
The nucleation rate equation allowed calculating the nucleation of various degree of supersaturated solution of calcium sulfate. The temperature was maintained constant at room temperature. It has been proved that the nucleation rate is controlled by three factors: supersaturation, temperature and interfacial tension [7]. The nucleation rate (nuclei/m3.min), the number of nuclei formed per unit time per volume has been calculated as follow (equation 19):
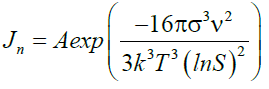
Figure 10 for a constant saturation level and temperature, the interfacial tension has a strong impact on the nucleation process. During the crystal growth, the solution becomes more stable while the degree of supersaturation decrease gradually until the solution reach equilibrium. Equilibrium of the solution is presented by the flat part of the graphs. The experiments showed that increase of the degree of supersaturation of calcium sulfate solutions in water medium decrease the induction time. Increase addition of antiscalant (Flocon 135) delays progressively the induction time until any precipitation occurs. Söhnel and Mullin [14] established a relationship between induction time and nucleation rate stating that

Figure 10. Nucleation rate versus supersaturation degree of calcium sulfate.
 (25)
(25)
 (26)
(26)
 (27)
(27)
 (28)
(28)
 (29) as slope
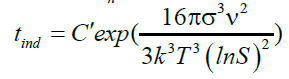
σ: surface energy (4.26 × 10⁻² J/m2)
ν: molar volume (7.47 × 10⁻⁵ m3/mol)
k: Boltzmann constant (1.3806503 × 10⁻²³ J/K)
T: absolute temperature (Kelvin)
S: degree of supersaturation of the water
A: pre-exponential factor (1036 nuclei/m3 × min)
Jn: Nucleation rate (nuclei/m3 × min)
B: Constant
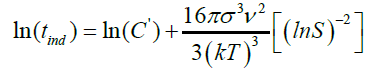
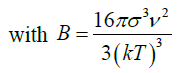
The induction time helps to evaluate the effect of supersaturation, temperature, organic or mineral additives on calcium sulfate crystallization. Based on the classic homogeneous nucleation theory, the induction time is related to the supersaturation (Table 5). Logarithmic plot of tind as function of 1/(ln S)2 for fixed temperature gives straight line with slope B [7]. A change in the slope of the linearization of experimental results may indicate a transition from homogeneous to heterogeneous nucleation mechanisms.
| ppm of antiscalant | S | Jn | tind | ln (S) | (ln S)2 | 1/(ln S)2 | ln (tind) |
|---|---|---|---|---|---|---|---|
| 0 | 8.67 | 2.10E+09 | 264 | 2.159869 | 4.66503319 | 0.21436075 | 5.575949103 |
| 0 | 9.4 | 1.63E+11 | 197 | 2.24071 | 5.02077991 | 0.19917224 | 5.283203729 |
| 0 | 11.06 | 2.85E+14 | 150 | 2.403335 | 5.7760191 | 0.17312962 | 5.010635294 |
| 0 | 14.79 | 7.11E+18 | 141 | 2.693951 | 7.25737348 | 0.1377909 | 4.94875989 |
| 0 | 21.07 | 4.02E+22 | 36 | 3.04785 | 9.28939101 | 0.10764968 | 3.583518938 |
| 0 | 25.29 | 1.19E+24 | 25 | 3.230409 | 10.4355427 | 0.09582635 | 3.218875825 |
| 0 | 31.7 | 3.83E+25 | 16 | 3.456317 | 11.946125 | 0.08370915 | 2.772588722 |
| 0 | 37.45 | 3.31E+26 | 8 | 3.623007 | 13.1261776 | 0.07618364 | 2.079441542 |
| 0 | 42.08 | 1.26E+27 | 10 | 3.739573 | 13.984403 | 0.07150824 | 2.302585093 |
Table 5. Nucleation rate of supersaturation of solutions of calcium sulfate without addition of antiscalant.
The calculated slope (B=287) differs from linear curve slope (23.538) by a factor of 10. It can indicate that there is a passage from homogeneous to heterogeneous nucleation.
Alimi [15] got similar results when plotting the log of the induction time versus various degree of supersaturation of calcium sulfate dihydrate for temperatures ranging between 20ºC and 70ºC (Figure 11). In the case of our study, the temperature was maintained constant. It seems that at high temperature, Prisciandaro [16] recorded also a passage of the slopes from homogeneous to heterogeneous nucleation which is consistent to results [15].

Figure 11. Logarithmic plot of the induction time versus degree of supersaturation of calcium sulfate solutions.
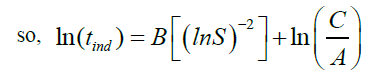
The induction time can be predicted base on values of the surface tension (σ), molar volume (ν), Boltzmann constant (k), room temperature (298 K), degree of supersaturation (S), pre-exponential factor (A). Value of the slope was calculated (Figure 12). This value (B) was then used to get the C value from equation (28).

Figure 12. log (tind)=f [(log S)2] for different temperature levels [15].
 (28)
(28)
we know that C?=C/A
 (30)
(30)
supersaturation of calcium sulfate solutions gives a linear curve related to this equation:
23.538x + 0.7915 (31)
So, we can conclude that :
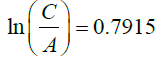 (32)
(32)
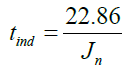
C =10.36e0.7915 (33)
we know that A=1036 nuclei/m3.min
C =10.36e0.7915 (34)
C=22.86 (35)
The C value is then used in this equation:
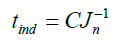 (25)
(25)
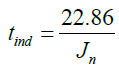 (35)
(35)
The induction time can be predicted by knowing the nucleation rate using equation (35). This result fit the model (equation 28).
Slopes of the logarithmic plots of the induction time versus degree of supersaturation of calcium sulfate solutions with different addition of antiscalant is associated to each dose of antiscalant (Table 6). A linear curve shows that those slopes increase gradually with the addition of antiscalant (Figure 13). The slope of the Logarithmic plot of the induction time versus degree of supersaturation of calcium sulfate solutions (equation 31) is equal to the linear curve.
| Slope of the antiscalant equation | Dose of antiscalant (ppm) |
|---|---|
| 23.674 | 0 |
| 41.423 | 0.5 |
| 45.755 | 1 |
| 53.628 | 1.25 |
Table 6. Relation between slopes of figure 30 and addition of antiscalant.

Figure 13. Plot of the relation between slopes of figure 30 and addition of antiscalant.
y = 23.538x + 0.7915 (31)
y = 22.152x + 25.89 (36)
Conclusion
The Tucson Active management Area (TAMA) is relying on the CAP water to satisfy 50% of the 400,000 AFY. This has strong consequences for the quality of the delivered water and concentrations of total dissolved solids (TDS). Membrane treatment via reverse osmosis process is most commonly used for separating salt from fresh water. During the process salt accumulates on the surface membrane and scaling occurring. The surface blockage of the scale results in permeate flux decline, reducing the efficiency of the process and increasing operating costs. Surface tension, temperature of the solution and the degree of supersaturation of the solution are key factors for crystal growth and nucleation rate. The use of antiscalant allows inhibition of the crystal growth in the feed water during the reverse osmosis process. Antiscalants are mixtures of various molecular weights of polycarboxylates and polyacrylates. The induction time, elapsed time between the onset of the supersaturation and the formation of the first critical nucleus, is delayed by addition of antiscalant. An increase of the degree of supersaturation of the solution decreases the induction time while an increase in the amount of antiscalant add in the feed water increases the induction time. A linear regression type was found between logarithmic values of the degree of supersaturation and the induction time without and with addition of antiscalant. The induction time is proportional to the inverse of the nucleation by a constant value named C. Each degree of supersaturation (S) is associated to a nucleation rate which is related to a C value. So, by knowing the C value for each degree of supersaturation (S) of calcium sulfate solutions, the induction time (tind) can be predicted. Calculation showed that the measured induction time is very close to the predicted induction time. Methods for increasing water recovery during salt removal can involve post-treatment of the brine deriving from the reverse osmosis process. The Vibratory Separation Enhanced Process (VSEP). VSEP system includes intense sheer waves, solids and foulants lifted off on the face of the membrane. Recovery by use of a combination of RO and VSEP treatments are in the range of 95-99%.
References
- Yenal U. Maximizing water recovery during reverse osmosis (RO) treatment of central Arizona project (CAP) water. The University of Arizona, Doctoral Dissertation. 2009.p 244.
- Dongxu Y. Study on strategies to reduce membrane scaling and fouling in drinking water and water reuse membrane systems. The University of Arizona, Doctoral Dissertation. 2011:268 pp.
- El-Shall H, M M Rashad and E A Abdel-Aal. Effect of cetyl pyridinium chloride additive on crystallization of gypsum in phosphoric and sulfuric acids medium. Crystal Research and Technology. 2005;40:860-66.
- Mahmoud MHH, Mohamed M Rashad, Ibrahim A Ibrahim, Abdel-Aal EA. Crystal modification of calcium sulfate dihydrate in the presence of some surface-active agents. Journal of Colloid and Interface Science. 2003;270:99-105.
- Lyster E, Myungman Kim, James Au, Yoram Cohen. A method for evaluating antiscalant retardation of crystal nucleation and growth on RO membranes. Journal of Membrane Science. 2010;364:122-31.
- Myerson A. Handbook of industrial crystallization. Butterworth-Heinemann, 1st ed. ISBN:0-7506-9155-7. 1992. 242 p.
- Ahmed S. Influence of a polyacrylates antiscalant on gypsum nucleation and growth. Crystal Research and Technology. 2008;43:935-42.
- Abdel-Aal E. New Findings about Nucleation and Crystal Growth of Reverse Osmosis Desalination Scales with and without Inhibitor. Crystal Growth & Design. 2015;15:5133-37.
- Wang F. Crystallization of calcium sulfate dihydrate in the presence of colloidal silica. Industrial and Engineering Chemistry Research. 2010;49:11344-350.
- Hasson D. Induction times induced in an RO system by antiscalants delaying CaSO4 precipitation. Elsevier Desalination 157. 2003:193-207.
- De Yoreo JJ, Vekilov P. Principles of crystal nucleation and growth. Reviews in Mineralogy and Geochemistry. 2003;54:57-93.
- Greenlee LF, Testa F, Lawler DF, et al. The effect of antiscalant addition on calcium carbonate precipitation for a simplified synthetic brackish water reverse osmosis concentrate. Elsevier Water Research. 2010;44:2957-69.
- Abdel-Aal E, Abdel-Ghafar HA, El-Syed D, et al. Crystallization study of reverse osmosis desalination scales at low salinity with and without inhibitors. Particulate Science and Technology. 2016;1-6.
- Söhnel O, Mullin JW. Interpretation of crystallization induction periods. Journal of colloid and interface science. 1988;123:43-50.
- Alimi F. Kinetics of the precipitation of calcium sulfate dihydrate in a desalination unit. Elsevier science, Desalination 157. 2003:9-16.
- Prisciandaro M, Amedeo L, Musmarra D. Gypsum nucleation into sodium chloride solutions. AIChE journal. 2001;47:929-34.