Research Article - Journal of Agricultural Science and Botany (2018) Volume 2, Issue 2
Low-maintenance turfgrass potential of crested, thickspike and western wheatgrass germplasm
Joseph G Robins* and B Shaun Bushman
United States Department of Agriculture, Agricultural Research Service Forage and Range Research, Utah State University, 6300 Old Main Hill, Logan, UT 84322 USA
- *Corresponding Author:
- Robins JG
Department of Agriculture
Agricultural Research Service Forage and Range Research
Utah State University
USDA-ARS Forage and Range, Logan, USA
E-mail: joseph.robins@ars.usda.gov
Accepted on May 10, 2018
Citation: Robins JG, Bushman SB. Low-maintenance turfgrass potential of crested, thickspike and western wheatgrass germplasm. J Agric Sci Bot 2018;2(2):22-28.
DOI: 10.35841/2591-7897.2.2.22-28
Visit for more related articles at Journal of Agricultural Science and BotanyAbstract
Traditional cool-season turfgrass species, such as Kentucky bluegrass (Poa pratensis L.), perennial ryegrass (Lolium perenne L.), and tall fescue (Lolium arundinaceum [Schreb.] Darbysh.), provide high quality turfgrass for athletic and aesthetic uses. Unfortunately, this high level of quality often comes at a cost of high levels of inputs in the forms of irrigation and fertilization. Therefore, there is a growing need and demand to produce turfgrass with lower inputs, particularly irrigation. Herein, we describe a study of the turfgrass potential of crested wheatgrass (Agropyron cristatum [L.] Gaertn.), thickspike wheatgrass (Elymus lanceolatus [Scribn. & J.G. Sm.] Gould) and western wheatgrass (Pascopyrum smithii [Rydb.] Á. Löve) when managed under low irrigation. We found that these species generally exhibited lower percent ground cover than tall fescue and Kentucky bluegrass under reduced irrigation, but that they exhibited darker green color. We identified a large range of phenotypic values and generally high narrow sense heritability (h2>0.5) for turf quality within these species, particularly for thickspike and western wheatgrass. Selection for increased turfgrass quality in these wheatgrass species has a high likelihood of developing improved turfgrass cultivar in these species.
Keywords
Deficit irrigation, Heritability, Kentucky bluegrass, Low maintenance turfgrass, Tall fescue, Wheatgrass.
Abbreviations
GCI: Green Color Index; PGC: Percent Ground Cover.
Introduction
Landscape irrigation, including turfgrass, in arid regions of western North America utilizes an estimated 45 to 60% of municipal freshwater resources [1,2]. Turfgrass alone covers an estimated 1.9% of the surface of the continental United States and is identified it as the single largest irrigated crop in the United States [3]. The sustainability of this level of landscape irrigation is already questionable. In dry years, irrigation restrictions ensure adequate water supply by limiting use on landscapes [4]. However, the increasing pressure placed on freshwater supplies by a growing population, climate change effects, and demand for industrial and agricultural purposes indicates that freshwater use for landscape irrigation will continue to be limited [5,6].
Ongoing research focuses on the need to decrease the use of freshwater for turfgrass irrigation. This research includes agronomic, physiological, management, and plant breeding and genetic approaches on more traditional turfgrass species, such as Kentucky bluegrass (Poa pratensis L.), tall fescue (Lolium arundinaceum [Schreb.] Darbysh.) and perennial ryegrass (Lolium perenne L.) among others for example [7-10]. There is also a place for additional turfgrass species that may be better adapted to arid growing conditions. These species include Eurasian and North American wheatgrasses such as crested wheatgrass (Agropyron cristatum [L.] Gaertn.), intermediate wheatgrass (Thinopyrum intermedium [Host] Barkworth & D.R. Dewey), thickspike wheatgrass (Elymus lanceolatus [Scribn. & J.G. Sm.] Gould), and western wheatgrass (Pascopyrum smithii [Rydb.] Á. Löve). These species evolved under harsh, arid conditions and possess the ability to persist via summer dormancy without supplemental irrigation [11,12], but their potential for functional turf quality is unknown.
Many current low-maintenance turf mixtures include older cultivars of these species. However, the included cultivars were bred for forage or re-vegetation purposes and are not intended for turf situations. To fully realize the potential of these species in turf situations, there needs to be concerted plant improvement for turf quality and production. The objective of this study was to determine the turf potential of half-sib families of crested, thickspike, and western wheatgrass under limited irrigation. We show the variation for color and quality among different sources of germplasm, and characterize the potential for genetic improvement of turf quality in these species.
Materials and Methods
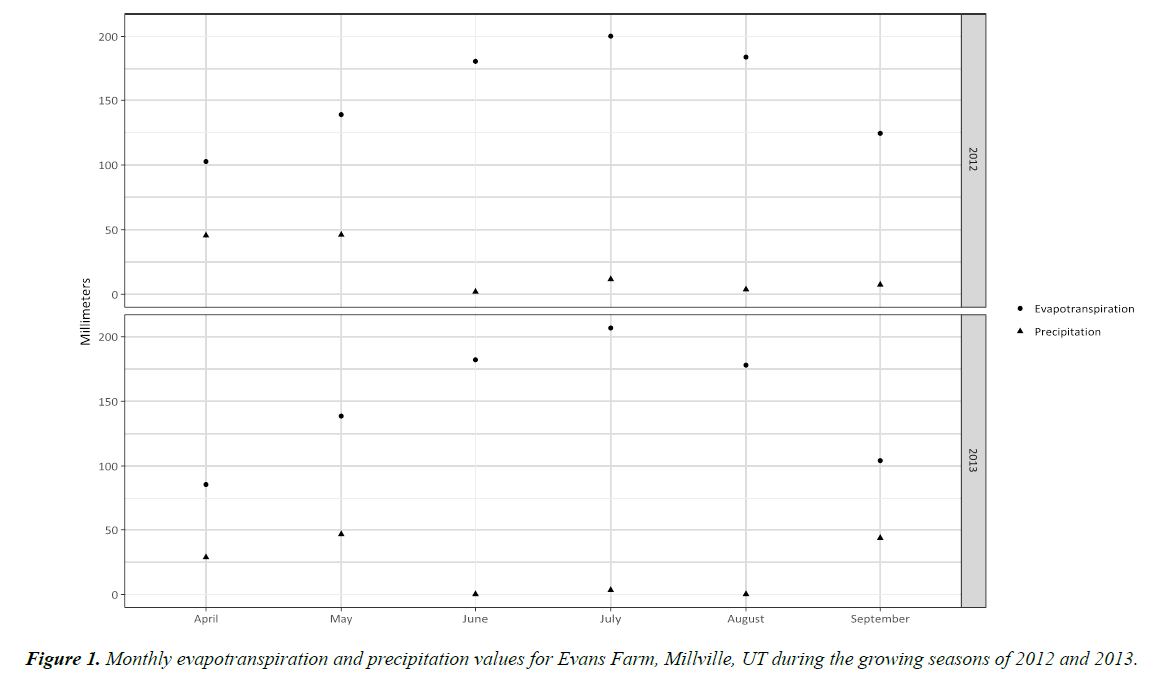
In August 2011, we seeded half-sib families (HSFs) of crested, thickspike, and western wheatgrass; and commercial check cultivars of intermediate wheatgrass, Kentucky bluegrass, and tall fescue. The experimental design was a randomized complete block design with two complete blocks. The experimental location was the Utah State University Evans Research Farm near Millville, UT (41°41’52” N, 111°49’53” W). The Evans Farm receives a mean of 432 mm of annual precipitation, is 1378 m above sea level, and consists of a Nibley silty, clay loam soil. The plots were 0.56 m x 0.56 m and the seeding rate was 244 kg ha-1 for all species but Kentucky bluegrass, for which the seeding rate was 146 kg ha-1. We scattered the seed to each plot by hand and then raked the plots to ensure seed-to-soil contact. Following seeding, we used overhead irrigation over the course of three weeks to maintain a moist soil surface until seedlings emerged from the soil and established. Beginning in spring 2012, we applied overhead supplemental irrigation on a weekly basis to replace 50% of the modeled evapotranspiration after accounting for any natural precipitation during that time period. Irrigation continued through September during both 2012 and 2013. We did not apply any supplemental fertilizer during the study. During the growing season, we mowed each plot with a rotary mower to a height of 7.6 cm on weekly basis (Figure 1).
There were 52 crested wheatgrass entries (48 HSFs, the cultivars ‘Hycrest II’ [13] and RoadCrest [14], and the turf breeding populations CWG-T1 and CWG-T2], 53 thickspike wheatgrass entries (49 HSFs and the cultivars ‘Bannock’ [15], ‘Bannock II’ [16], ‘Elbee’ [17], and ‘Sodar’ [18]), 53 western wheatgrass entries (49 HSFs and the cultivars ‘Arriba’ [19], ‘Recovery’ [20], ‘Rodan’ [21], and ‘Rosana’ [22]), and the cultivars ‘Park’ Kentucky bluegrass [23] and ‘Matador’ tall fescue [24].
We used digital imagery to measure the green color index (GCI) and the percent groundcover (PGC). We mounted an Olympus SP-500 UZ digital camera (Olympus Corporation of the Americas, Center Valley, PA) to a custom built chamber and then took pictures of each plot. The chamber excluded ambient light and was instead lighted internally with four 9 W IS-09 compact fluorescent light bulbs (UL, Camas, WA). We set the camera to a 1200 x 1600 pixel image size and the fluorescent white balance setting. We then fed the digital images to SigmaScan Pro v5 (Systat, San Jose, CA), which used the Turf Analysis macro [25] to convert the images to GCI [26] and PGC [27] values. The software used a color threshold of 30 to 100 and a saturation of 0 to 100 for the included pixels. The macro converted images to GCI by assigning numerical values based on the Munsell color system and to PGC by dividing the number of pixels meeting the threshold by the total number of pixels in the image.
We collected the first set of digital images in late October 2011. In subsequent years, depending on the weather and plant growth, we began collecting images in April (2013) or May (2012). We then continued taking images at approximately two week intervals through the remainder of the growing season (late September). We collected images on 19 separate dates during the study, including a final set of images at the end of the study in late October 2013. To facilitate analyses and interpretation, we grouped the collection dates into four time periods according to the collection date. The time periods, termed seasons, were spring (April and May), early summer (June and early July), late summer (late July and August), and fall (September and October). Each season consisted of five collection dates except for spring, which had only four collection dates.
We analyzed the data using the ASReml-R package [28] of R [29]. We modeled species, season, and their interaction as fixed effects; and HSFs, collection dates within season, complete blocks as random effects. We also modeled the repeated measures that corresponded to the multiple collection dates for each trait. The results are in the form of best linear unbiased estimates from the models. We also estimated Spearman correlations between the traits across seasons and between seasons for the same trait.
Results
Seasons and species
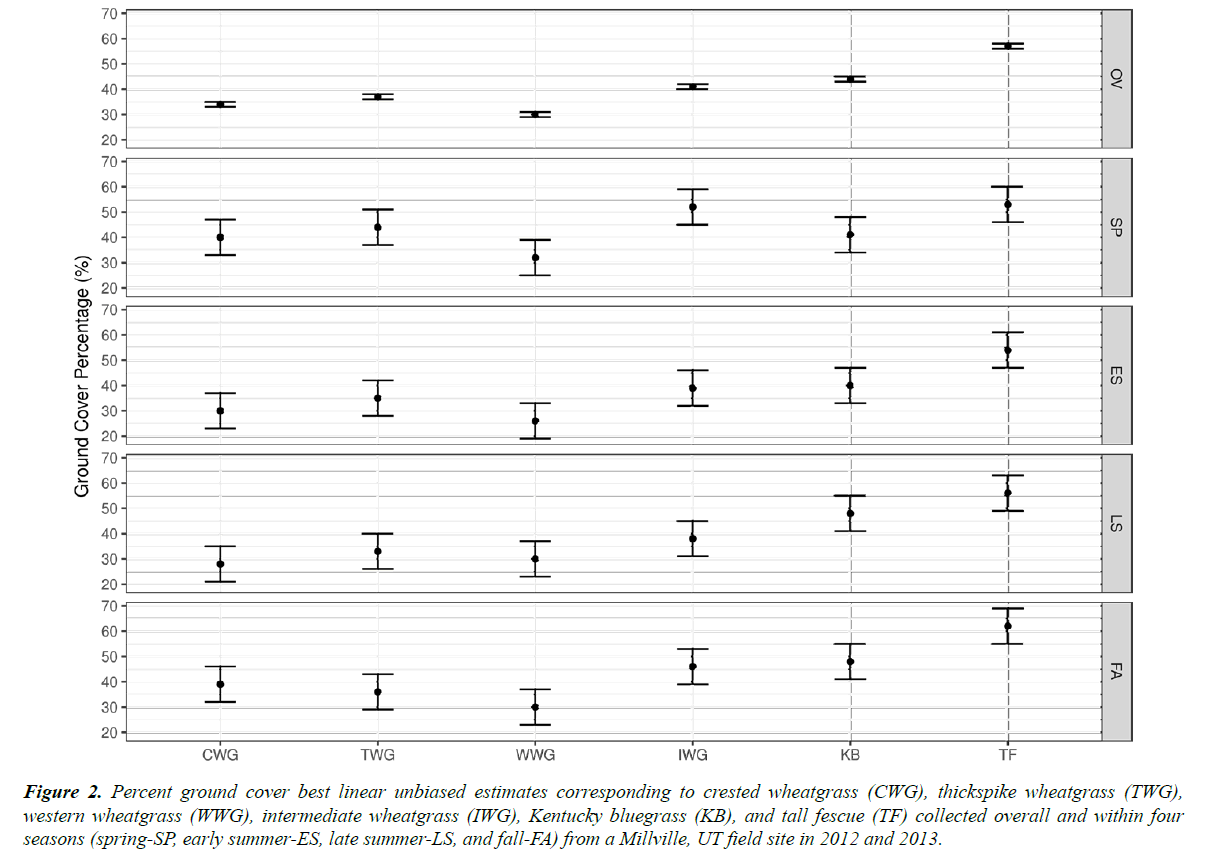
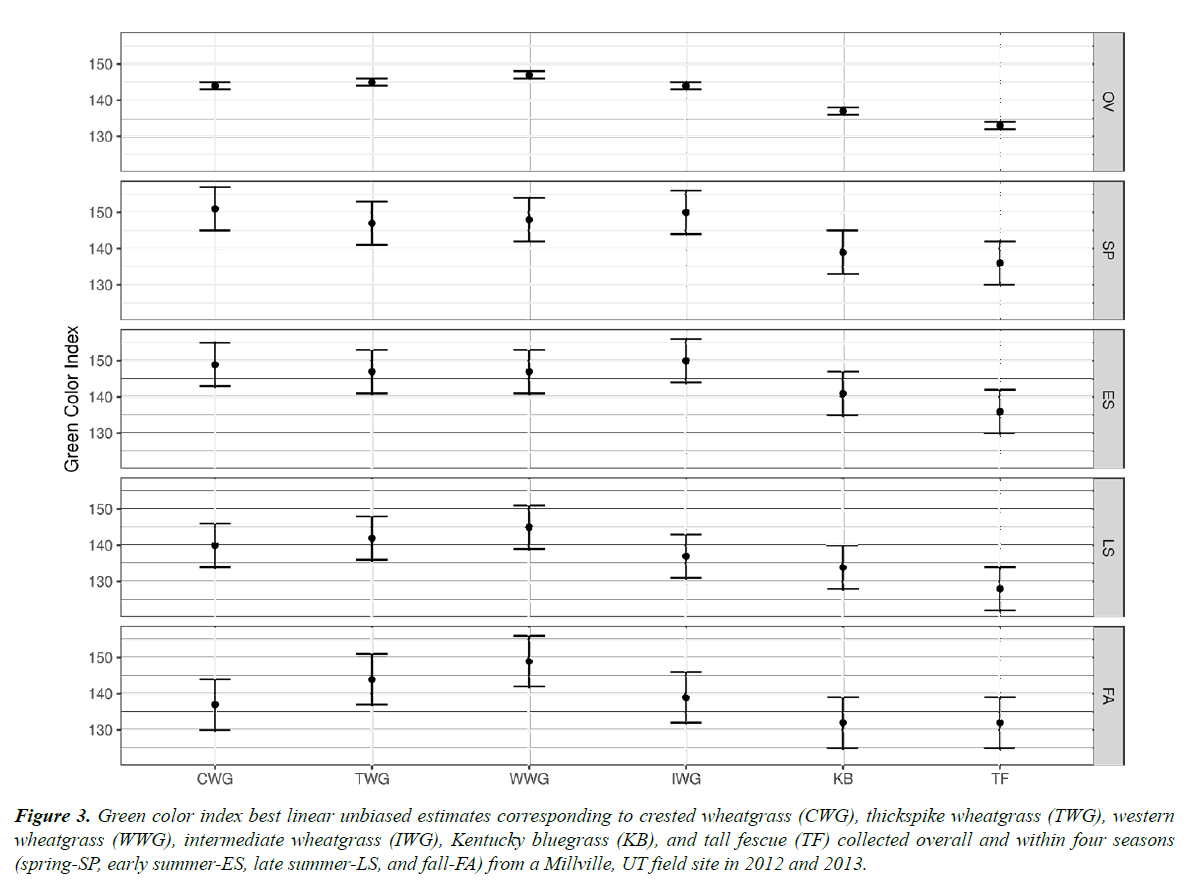
The main effects of season and species differed (P ≤ 0.002) from zero for PGC and GCI (Figures 2 and 3). The season-by-species interaction effect also differed (P < 0.001) from zero for both traits. Contribution to the total sums of squares for both traits were greatest by the species main effect, intermediate by the season-by-species interaction, and least by the season main effect.
Figure 2. Percent ground cover best linear unbiased estimates corresponding to crested wheatgrass (CWG), thickspike wheatgrass (TWG), western wheatgrass (WWG), intermediate wheatgrass (IWG), Kentucky bluegrass (KB), and tall fescue (TF) collected overall and within four seasons (spring-SP, early summer-ES, late summer-LS, and fall-FA) from a Millville, UT field site in 2012 and 2013.
Figure 3. Green color index best linear unbiased estimates corresponding to crested wheatgrass (CWG), thickspike wheatgrass (TWG), western wheatgrass (WWG), intermediate wheatgrass (IWG), Kentucky bluegrass (KB), and tall fescue (TF) collected overall and within four seasons (spring-SP, early summer-ES, late summer-LS, and fall-FA) from a Millville, UT field site in 2012 and 2013.
Based on the across season and species analysis, the greatest PGC values occurred in the spring (44%) and fall (43%). Late summer (39%) and early summer (36%) PGC values were lower. Tall fescue (57%) exhibited the highest PGC value, followed by Kentucky bluegrass (44%). Intermediate wheatgrass (41%), thickspike wheatgrass (37%), crested wheatgrass (34%), and western wheatgrass (30%) all differed from each other and exhibited lower PGC than tall fescue and Kentucky bluegrass (Figure 2).
The highest GCI values occurred in the spring and early summer (145) with lower values in late summer and fall (138) in Figure 3. Western wheatgrass exhibited the highest GCI (147). The three remaining wheatgrass species exhibited intermediate GCI values. Kentucky bluegrass (136) and tall fescue (133) exhibited the lowest GCI values.
The four wheatgrass species each exhibited the highest PGC values in the spring in Figure 2. In contrast, Kentucky bluegrass and tall fescue exhibited the highest PGC values in the late summer or fall. The highest GCI values for each species were in the spring and early summer (Figure 3).
The highest PGC values corresponded to intermediate wheatgrass and tall fescue in the spring; and to tall fescue in early summer, late summer, and fall. Aside from the spring season, Kentucky bluegrass exhibited the second highest PGC values. Intermediate and thickspike wheatgrass exhibited the highest PGC values among the wheatgrasses in each season. Western wheatgrass consistently exhibited the lowest PGC values in each season. Crested and intermediate wheatgrass exhibited the darkest GCI in spring and early summer. Western wheatgrass exhibited the darkest GCI in late summer and fall. Kentucky bluegrass and tall fescue exhibited the lightest GCI in each season.
Individual entries and half-sib families
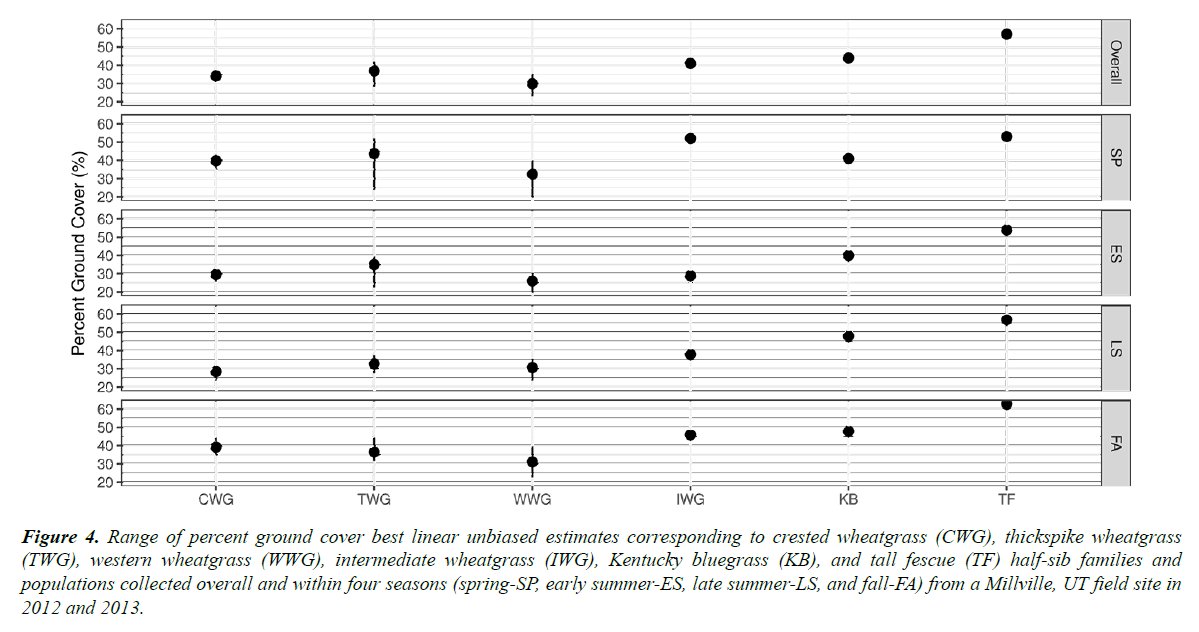
There were differences among the individual entries for PGC overall and within each season (Figure 4).
Figure 4. Range of percent ground cover best linear unbiased estimates corresponding to crested wheatgrass (CWG), thickspike wheatgrass (TWG), western wheatgrass (WWG), intermediate wheatgrass (IWG), Kentucky bluegrass (KB), and tall fescue (TF) half-sib families and populations collected overall and within four seasons (spring-SP, early summer-ES, late summer-LS, and fall-FA) from a Millville, UT field site in 2012 and 2013.
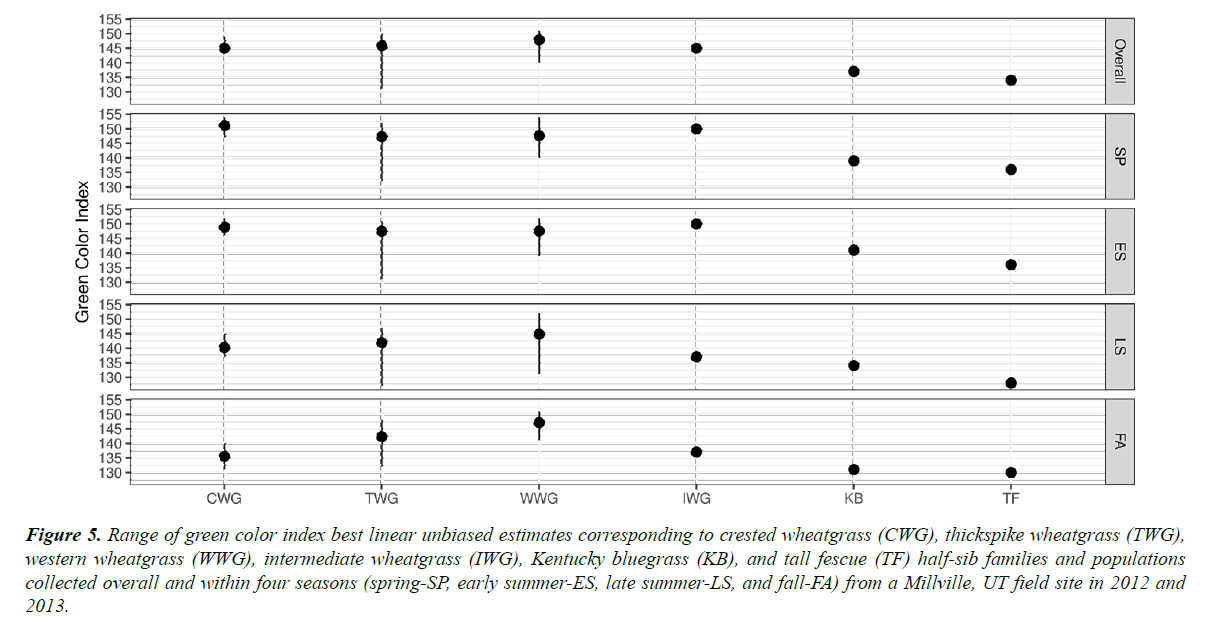
Overall and within each season, ‘Matador’ tall fescue exhibited the highest PGC. Overall, ‘Park’ Kentucky bluegrass (44%) and thickspike wheatgrass family 21.18 (42%) exhibited the next highest PGC values. In spring, ‘Tegmar’ intermediate wheatgrass (52%) and twelve thickspike wheatgrass families (47-52%) exhibited PGC similar to that of Matador. In early summer, fifteen thickspike wheatgrass families (37-40%) exhibited PGC similar to that of Park (40%), which exhibited the second highest PGC value. In late summer, none of the wheatgrass entries exhibited PGC similar to that of Park (48%) or Matador (57%). Yet, Tegmar, five thickspike wheatgrass families (36-38%), and the western wheatgrass family 71.8 (36%) formed the next tier of PGC values. In fall, Tegmar (46%), fourteen crested wheatgrass families (41-45%), and three thickspike wheatgrass families (41-45%) exhibited PGC similar to that of Park (48%). Ten thickspike wheatgrass families exhibited relatively high PGC in more than one season. There were also differences among the entries for GCI overall and within each season (Figure 5).
Figure 5. Range of green color index best linear unbiased estimates corresponding to crested wheatgrass (CWG), thickspike wheatgrass (TWG), western wheatgrass (WWG), intermediate wheatgrass (IWG), Kentucky bluegrass (KB), and tall fescue (TF) half-sib families and populations collected overall and within four seasons (spring-SP, early summer-ES, late summer-LS, and fall-FA) from a Millville, UT field site in 2012 and 2013.
The crested and thickspike wheatgrass generally exhibited darker color in spring and early summer. The crested wheatgrasses exhibited light color in the fall. The western wheatgrass exhibited dark color across the growing season. Matador tall fescue and Elbee thickspike wheatgrass consistently exhibited light color across seasons.
Considering HSFs within each species separately as random effects allowed the estimation of narrow-sense heritability values. The overall narrow-sense heritability estimates of crested, thickspike, and western wheatgrass for PGC were 0.36, 0.81, and 0.91, respectively. The corresponding estimates for GCI were 0.70, 0.87, and 0.89. Within season estimates ranged from 0.27 to 0.78 and 0.42 to 0.71 for crested wheatgrass PGC and GCI; 0.51 to 0.72 and 0.34 to 0.78 for thickspike wheatgrass PGC and GCI; and 0.54 to 0.78 and 0.23 to 0.83 for western wheatgrass PGC and GCI. With few exceptions, all heritability estimates differed from zero.
Across species correlations between PGC and GCI did not differ from zero, or were biologically meaningless, for all seasons but fall when the correlation was -0.74 (P<0.001).
Correlations among season for the same trait were generally moderate to high and positive. Spring and early summer PGC values were highly correlated to each other and to the overall values (ρ ≥ 0.87, P<0.001). Correlations between late summer, fall, and the remaining seasons for PGC all differed from zero (P<0.001), but were moderate in magnitude (ρ=0.40 to 0.67) with the exception of the late summer and fall correlation which did not differ from zero. The highest correlations between seasons for GCI occurred between the overall, late summer, and fall values (ρ=0.74 to 0.90). Other values were low to moderate for this trait.
Discussion and Conclusion
Diesburg et al. [30] defined the necessary characteristics for a low-maintenance turf species as persistence and uniformity under abiotic and biotic stress conditions. Based on these criteria, tall fescue was clearly the species best adapted to the conditions of this study. Only during the spring did intermediate wheatgrass exhibit PGC comparable to that of tall fescue. The thickspike and crested wheatgrasses compared more favorably to Kentucky bluegrass. Despite its rhizomatous growth habit [11], western wheatgrass exhibited consistently poor PGC overall and within seasons. In contrast, the wheatgrasses, particularly thickspike and western wheatgrass, exhibited darker color, based on higher GCI, than either tall fescue or Kentucky bluegrass. Nevertheless, at this point, the wheatgrasses are not ready to replace tall fescue or Kentucky bluegrass in higher maintenance production situations. Ultimately, we included the tall fescue and Kentucky bluegrass cultivars to determine how far separated the turf performance of the wheatgrass species was from traditional turf species, and not because we felt their performance would be comparable.
Within the wheatgrass species, the PGC values were generally comparable within seasons, although in the overall analysis the PGC of intermediate wheatgrass > thickspike wheatgrass > crested wheatgrass > western wheatgrass. Still, the PGC of western wheatgrass was low even when the value did not statistically differ those of the other wheatgrass species. For the overall analysis the GCI (darker green) of western wheatgrass was higher than that of the other wheatgrass species, which all exhibited similar GCI. The generally consistent ranking of species suggested that the small interaction with season was due to magnitude, rather than ranking, changes among the species [31].
While the species results point to trends and are of interest, the main objective was to identify variation within HSFs of crested, thickspike, and western wheatgrass for advancement in the low-maintenance turf improvement program. For both PGC and GCI, the differences among the HSFs revealed opportunities for selection to develop germplasm sources with better phenotypes than current commercially available cultivars of each species. However, for both traits there was a larger range of phenotypic values for thickspike and western wheatgrass as compared to crested wheatgrass. Narrow sense heritability values were also typically higher for thickspike and western wheatgrass than for crested wheatgrass. The heritability results indicated generally high levels of genetic variation for each species-trait combination with the exception of crested wheatgrass PGC. Under similar conditions, a crested wheatgrass population from a different genetic background exhibited similar to higher levels of genetic variation for turfgrass production [32]. Thus, the population evaluated in the current study may need an influx of genetic variation from different populations for sustained turfgrass improvement. To the best of our knowledge, this work represents the first evaluation of heritability in thickspike and western wheatgrass for turfgrass traits. Therefore, we cannot compare the resulting values with previous work.
The same traits, such as high establishment and persistence, that make crested wheatgrass an invaluable species for dryland agriculture and rangeland revegetation [11], also make it an attractive alternative for low-maintenance turfgrass production. Despite these advantages, its use in low-maintenance turfgrass situation is generally limited to roadsides and wildland recreation properties. As pressure increases to use freshwater supplies more carefully, there will be an increasing need to use supplemental irrigation more efficiently. Both Eurasian and native North American wheatgrasses have potential to be used to maintain turfgrass aesthetics with limited to no supplemental irrigation. Before this becomes a reality there is a need to improve each of these species to ensure acceptable turfgrass quality and function. This study represents a description of the available genetic variation within three wheatgrass populations specifically developed for turfgrass improvement. The results indicated genetic variation among HSFs in each species for turfgrass improvement and relatively high correlation across seasons, at least for PGC. This makes genetic improvement through selection likely for each species. Nevertheless, the usefulness of this germplasm will ultimately correspond to its adaptation to a wider range of target environments. High performing HSFs need to be evaluated and selected across a wider range of environments in western North America. However, these results clearly indicate the potential of these populations as base populations in an applied breeding program to improve wheatgrass for low-maintenance production. Finally, there is a need to identify best management practices, including seeding rate and germination procedures to ensure dense stands of wheatgrass turf.
References
- Kopp KL, Cerny-Koenig T, Lopez R. Educating large landscape water users. J Ext. 2007;45(1).
- McCammon TA, Marquart-Pyatt ST, Kopp KL. Water-conserving landscapes: an evaluation of homeowner preference. J Ext. 2009;47(2).
- Milesi C, Running SW, Elvidge CD, et al. Mapping and modeling the biogeochemical cycling of turf grasses in the United States. Environ Manage. 2005;36(3):426-38.
- Kenney DS, Klein RA, Clark MP. Use and effectiveness of municipal water restrictions during drought in Colorado. J Am Water Resour Assoc. 2004;40(1):77-87.
- Feldhake CM, Danielson RE, Butler JD. Turfgrass Evapotranspiration I. Factors influencing rate in urban environments. Agron J. 1983;75(5):824-30.
- Pimentel D, Berger B, Filiberto D, et al. Water resources: agricultural and environmental issues. BioScience. 2004;54(10):909-18.
- Bushman SB, Waldron BL, Robins JG, et al. Summer percent green cover among Kentucky bluegrass cultivars, accessions, and other Poa species managed under deficit irrigation. Crop Sci. 2012;52(1):400-7.
- Goldsby AL, Bremer DJ, Fry JD, et al. Response and recovery characteristics of Kentucky bluegrass cultivars to extended drought. Crop, Forage & Turfgrass Management. 2015;1(1).
- Richie WE, Green RL, Klein GJ, et al. Tall fescue performance influenced by irrigation scheduling, cultivar, and mowing height. Crop Sci. 2002;42(6):2011-7.
- Sevostianova E, Leinauer B. Subsurface-applied tailored water: Combining nutrient benefits with efficient turfgrass irrigation. Crop Sci. 2014;54(5):1926-38.
- Asay KH, Jensen KB. Wheatgrasses Cool season forage grasses, (coolseasonforag). 1996:691-724.
- Robins JG, Jensen KB, Jones TA, et al. Stand establishment and persistence of perennial cool-season grasses in the Intermountain West and the Central and Northern Great Plains. Rangel Ecol Manage. 2013;66(2):181-90.
- Jensen KB, Larson SR, Waldron BL, et al. ‘Hycrest II’, a new crested wheatgrass with improved seedling establishment. J Plant Reg. 2009;3(1):57-60.
- Asay KH, Jensen KB, Horton WH, et al. Registration of ‘RoadCrest’ crested wheatgrass. Crop Sci. 1999;39:1535.
- USDA-NRCS. Release brochure for ‘Bannock’ thickspike wheatgrass (Elymus lanceolatus spp. lanceolatus). Aberdeen Plant Materials Center, Aberdeen, ID 83210. 2012.
- Robins JG, Jensen KB, Bushman BS. Notice of release of ‘Bannock II’ thickspike wheatgrass. Native Plants J. 2015;16(3):259-64.
- Smoliak S, Johnston A. Registration of Elbee thickspike wheatgrass1. Crop Sci. 1982;22(1):162-3.
- USDA-NRCS. Release brochure for ‘Sodar thickspike wheatgrass (Elymus lanceolatus spp. lanceolatus). Aberdeen Plant Materials Center, Aberdeen, ID 83210. 2012.
- USDA-NRCS. Release brochure for ‘Arriba’ western wheatgrass (Pascopyrum smithii). Los Lunas Plant Materials Center, Los Lunas, NM 87031. 1977.
- Waldron BL, Jensen KB, Palazzo AJ, et al. ‘Recovery’, a new western wheatgrass with improved seedling establishment on rangelands. J Plant Reg. 2011;5(3):363-73.
- USDA-NRCS. Release brochure for ‘Rodan’ western wheatgrass (Pascopyrum smithii). Bismarck Plant Materials Center, Bismarck, ND. 1988.
- Winslow SR. Rosana western wheatgrass. A conservation plant for Montana and Wyoming. Bridger Plant Materials Center, Bridger, MT 59014. 2010.
- Thomas HL. Registration of Park Kentucky bluegrass1. Crop Sci. 1969;9(4):521.
- Fraser ML, Rose-Fricker CA, Meyer WA. Registration of ‘Matador’ tall fescue. Crop Sci. 1999;39(3):871.
- Karcher DE, Richardson MD. Batch analysis of digital images to evaluate turfgrass characteristics. Crop Sci. 2005;45(4):1536-9.
- Karcher DE, Richardson MD. Quantifying turfgrass color using digital image analysis. Crop Sci. 2003;43(3):943-51.
- Richardson MD, Karcher DE, Purcell LC. Quantifying turfgrass cover using digital image analysis. Crop Sci. 2001;41(6):1884-8.
- Butler DG, Cullis BR, Gilmour AR, et al. ASReml-R reference manual. The state of Queensland, Department of Primary Industries and Fisheries. Training series QE02001. 2009.
- R Core Team. R: a language and environment for statistical computing. R Foundation for Statistical Computing, Vienna, Austria. 2017. Date of access Nov. 2017.
- Diesburg KL, Christians NE, Moore R, et al. Species for low-input sustainable turf in the U.S. Upper Midwest. Agron J. 1997;89(4):690-4.
- Falconer DS, Mackay TFC. Introduction to quantitative genetics. 4th ed. Harlow, UK: Longmans, Green Co; 1996.
- Robins JG, Waldron BL, Johnson PG. Potential for the improvement of turf quality in crested wheatgrass for low-maintenance conditions. Hort Sci. 2007;42(7):1526-9.
