Research Article - Biomedical Research (2017) Volume 28, Issue 2
Localization of neurodegenerative brain MRI image for gene expression evaluation
Babu Gopal* and Sivakumar RajagopalR.M.K. Engineering College, Kavaraipettai-601206, Tamil Nadu, India
Accepted date: May 11, 2016
Abstract
The soft computing techniques solve the major localization problems in optimization of biomedical images. We have developed an automatic method aimed first at segmentation of MRI brain images by denoising with Discrete Curvelet Transform. Then clustering of denoised images using Fuzzy C-means clustering localized the abnormality by simulating the anatomical structure. The statistical analysis confirmed the validity of the algorithm. The abnormality in localization compared with microarray gene expression evaluation also showed variations which will be helpful for the development of gene module based neuroimaging advancements.
Keywords
Neuro degeneration, Discrete curvelet decomposition, Spatial fuzzy clustering, Brain MRI image, Gene expression evaluation.
Introduction
Magnetic Resonance Imaging (MRI) is routinely used in the diagnosis, characterization and clinical management of neurodegenerative disorders of brain [1,2]. It is a dynamic noninvasive diagnostic imaging tool that allows global assessment of brain images and their interaction with their local environment [3]. Noise is an ingrained phenomenon in the medical images which may increase the root mean square error and reduce the peak signal to noise ratio [4-7].
Curvelet based approach is used for the denoising of Magnetic Resonance (MR) and Computer Tomography (CT) images [6]. Image fusion of MRI and CT images is also possible by this analysis for better interpretation [7]. Curvelet transform is a new multiscale representation suited for objects which are smooth away from discontinuities across curves, which was developed by Candies and Donoho [8] and this digital transforms is applied for the denoising of some standard MR and CT images embedded in random noise [9,10]. The Curvelet reconstructions exhibit higher perceptual quality than wavelet based reconstructions, offering visually sharper images and, in particular, higher quality recovery of edges and of faint linear and curvilinear features. Curvelets will be superior over wavelets in the following cases [11]
• Optimal sparse representation in object with edges
• Optimal image reconstruction of severely ill-posed problems
• Optimal sparse representation in wave propagators
Since the brain images have several objects and curved shapes, it is expected that Curvelet transform would be better in their denoising [12].
The proposed filtering technique is used along with the Curvelet transform and Wavelet transform and it is observed that the Curvelet transform produces better result when compared with the Wavelet transform [13]. The simulation results have proved that this method actively removes the noise and reduces the root mean square error while increasing the image enhancement factor and peak signal to noise ratio [14,15]. Major denoising methods include Gaussian filtering [16], Wiener filtering, and wavelet thresholding [17]. Many more methods make assumptions about the image that can lead to blurring.
A new method called the non-local means algorithm is presented that does not make the assumptions that lead to blurring [18]. Non local means filter uses all the possible selfpredictions and self-similarities that the image can provide to determine the pixel weights for filtering the noisy image, with the assumption that the image contains an extensive amount of self-similarity [19,20]. Fuzzy clustering has a major role in solving problems in the areas of pattern recognition and fuzzy model identification. A variety of fuzzy clustering methods have been proposed and most of them are based upon distance criteria as described by Krinidis et al. [21].
It uses reciprocal distance to compute fuzzy weights. A more efficient algorithm is the new FCM. It computes the cluster centre using Gaussian weights as described by Yang et al. [22] and Despotovic et al. [23]. The FCM technique reduces the noise effect, because no similar cluster is present in the neighbourhood, the weight of the noisy cluster is greatly reduced with FCM which is not the case in K means as described [24]. Furthermore, the membership of the correct cluster is enhanced by the cluster distribution in the neighbouring pixels [25].
The level of cellular and molecular complexity of the nervous system creates unique problems for the neuroscientist in the design and implementation of functional genomics studies [26]. Reasons for major drawbacks of microarray data is its voluminous analysis [27,28]. Recently, several studies have attempted to correlate imaging findings with molecular markers, but no consistent associations have emerged and many of the imaging features that characterize neurodegeneration currently lack biological or molecular correlates [29].
Much of the information encoded within neuroimaging studies therefore remains unaccounted and incompletely characterized at the molecular level. We reasoned that the phenotypic neurodegeneration captured by neuroimaging reflects underlying could be uncovered by combining genome-scale gene expression and MRI [1].
Materials and Methods
Subjects
Experiments were carried out with 50 normal and 100 abnormal subjects with neurodegenerative symptoms (Age group of 40-70 years) due to alcoholic history. The MRI Images were obtained from the radiology department, Stanley medical college. Reference MRI images of individuals used in this study received from Allen Brain Atlas (www.allenbrainatlas.com) (Table 1). Brain specimens of case no. 1015 showed histopathology as modest numbers of hemosiderin laden macrophages noted in Virchow-Robin spaces in cerebral lobes. Brain specimens of case no.s 1009 (age: 57 years) and 2001 (age: 24 years) had normal microneuropathology and were taken as controls for this study.
| case | Age | Clinical history | Neuromicropathology |
|---|---|---|---|
| 1009 | 57 years | atherosclerosis | Normal |
| 1015 | 49 years | hypothyroidism | Haemosiderosis |
| 2001 | 24 years | asthma | Normal |
Table.1. The description of MRI image references used in this study.
Experimental methods
Image independent noise can often be described by an additive noise model, where the recorded image f (i, j) is the sum of the true image s (i, j) and the noise n (i, j) and is denoted by [7],
f (i,j) = s (i,j) +n (i,j) → (1)
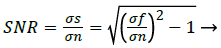
The noise n (i, j) is often zero mean and described by its variance. The impact of the noise on the image is often described by the Signal to Noise Ratio (SNR), which is as expressed as [7]
 (2)
(2)
Where σs and σf are the variances of the true image and the recorded image, respectively. Curvelets are designed to handle curves using only a small number of coefficients. Hence the Curvelet handles curve discontinuities well. The procedure to denoise an image using Curvelet transform can be expressed as [7]
Restored Image g (i, j) = DCT-1[DCT(f(i,j))]→(3)
The MRI brain images samples are denoised and restored by curvelet decomposing and compositions as restored image as shown in Figure 1. For performing curvelet transform, the curvelet transformation is applied to the noisy image instead of the wavelet transform [7].

Figure 1: Flow chart of discrete curvelet transform with spatial fuzzy clustering.
Dct (n) = C.T [f (i,j)] = {D1 (n) + D11 (n) + D12 (n) + D13 (n) + D14 (n) + D15 (n) + D16 (n) + D17 (n) + D18 (n) + D2 (n)}→(4)
The filter is applied to the decomposed components.
DF1 (n) = Fnlm (D1 (n))→ (5)
DF11 (n) = Ft (D11 (n)) → (6)
DF12 (n) = Ft (D12 (n)) → (7)
DF13 (n) = Ft (D13 (n)) → (8)
DF14 (n) = Ft (D14 (n)) → (9)
DF15 (n) = Ft (D15 (n)) → (10)
DF16 (n) = Ft (D16 (n)) → (11)
DF17 (n) = Ft (D17 (n)) → (12)
DF18 (n) = Ft (D18 (n)) → (13)
DF2 (n) = Ft (D2 (n)) → (14)
After applying the inverse transformation, the Restored Image is obtained as O (n) [7]
O (n) = I.C.T [DF1 (n) + DF11 (n) + DF12 (n) + DF13 (n) + DF14 (n) + DF15 (n) + DF16 (n) + DF17 (n) + DF18 (n) + D2 (n)]→(15)
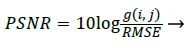
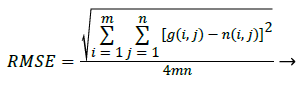
The Performance Parameter, Peak Signal to Noise ratio (PSNR) can be derived as [7]
 (16)
(16)
Where the Performance Parameter RMSE can be obtained by [7]
 (17)
(17)
Spatial Fuzzy C Means method incorporates spatial information [30] and the membership weighting of each cluster is altered based on the neighbourhood (Figure 2). The first pass is the same as that in standard FCM to calculate the membership function in the spectral domain. In the second pass, the membership information of each pixel is mapped to the spatial domain and the spatial function is computed from that. The FCM iteration proceeds with the new membership that is incorporated with the spatial function and it has been described by Lui et al. [25] and Xiang et al. [31]. The idea of FCM is using the weights that minimize the total weighted mean square error as described by Ahmed et al. [32].

Figure 2: Flow chart of spatial fuzzy clustering.
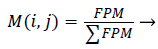
Initializing the Fuzzy Partition Matrix takes place initially. The weights are initialized using feature vectors or randomly [33]. The process of initializing the Fuzzy Partition Matrix (FPM) is done randomly and the size of it must be equal to the number of clusters and length of the image as rows and columns respectively [34].
Second the membership function M (i,j) is determined from the initialized Fuzzy Partition matrix as [34],
 (18)
(18)
Third the Centre Cij for each cluster is determined based on the input pixel intensity and the membership function determined using the expressed as [32],
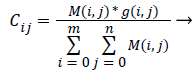 (19)
(19)
Then, the distance is calculated by finding the difference between the centre and the input image. The Distance is given by [33],
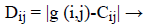 (20)
(20)
Finally updated Membership matrix is to be determined. New membership matrix is inversely proportional to the square of distance matrix and updated during iterations.
Microarray analysis
Genes associated with neurogeneration in iron accumulation were identified as ATPase type 13A2 (ATP13A2), Phospholipase A2, group V1 (PLA2G6), Pantothenate kinase 2 (PANK2), DDB1 and CUL4 associated factor 17 (DCAF17), Fatty acid 2-hydroxylase (FA2H), Ferritin light polypeptide (FTL) and Ceruloplasmin (ferroxidase) (CP) [29]. Their microarray expression data were acquired from Allen brain atlas website and compared in Tables 4-6.
| Coronal Plane | %RD | %Sen | %Spe | %Acc | RMSE | PSNR | CC | SSI |
|---|---|---|---|---|---|---|---|---|
| -97 | 2.9086 | 39.9335 | 99.9967 | 94.7571 | 5.6457 | 40.6136 | 0.9753 | 0.0576 |
| -93 | 2.4408 | 74.4621 | 98.2430 | 96.1685 | 5.6556 | 40.6137 | 0.9762 | 0.0821 |
| -86 | 1.9891 | 45.2125 | 99.9851 | 90.0955 | 5.6457 | 40.6136 | 0.9740 | 0.1185 |
| -75 | 1.6420 | 28.7983 | 100 | 80.0430 | 5.6457 | 40.6136 | 0.9755 | 0.1659 |
| -66 | 1.4926 | 41.1329 | 99.9651 | 79.7424 | 5.6457 | 40.6136 | 0.9736 | 0.2025 |
| -55 | 1.3950 | 30.1337 | 99.9520 | 72.3053 | 5.6457 | 40.6136 | 0.9720 | 0.2475 |
| -44 | 1.3759 | 37.7875 | 100 | 73.6649 | 5.6457 | 40.6136 | 0.9713 | 0.2660 |
| -34 | 1.4155 | 43.8620 | 100 | 77.3849 | 5.6457 | 40.6136 | 0.9719 | 0.2620 |
| -25 | 1.4572 | 63.8922 | 99.2335 | 85.4919 | 5.6457 | 40.6136 | 0.9750 | 0.2642 |
| -19 | 1.4637 | 60.8328 | 99.4975 | 84.5505 | 5.6456 | 40.6137 | 0.9751 | 0.2621 |
| -13 | 1.4784 | 59.8750 | 99.9065 | 85.3485 | 5.6457 | 40.6136 | 0.9744 | 0.2523 |
| 0 | 1.5272 | 58.8570 | 99.3294 | 85.5621 | 5.6457 | 40.6136 | 0.9747 | 0.2328 |
| 8 | 1.5824 | 42.1302 | 100 | 82.8720 | 5.6457 | 40.6136 | 0.9735 | 0.2132 |
| 18 | 1.6602 | 43.5137 | 100 | 84.9976 | 5.6457 | 40.6136 | 0.9740 | 0.1892 |
| 24 | 1.7647 | 42.0204 | 100 | 86.3907 | 5.6457 | 40.6136 | 0.9735 | 0.1639 |
| 35 | 1.9043 | 50.1957 | 99.8660 | 89.7964 | 5.6457 | 40.6136 | 0.9740 | 0.1381 |
| 43 | 1.9043 | 59.4738 | 99.8481 | 91.5115 | 5.6457 | 40.6136 | 0.9740 | 0.1377 |
| 50 | 2.1747 | 49.7313 | 99.9668 | 93.5486 | 5.6457 | 40.6136 | 0.9681 | 0.0988 |
| 58 | 2.4257 | 34.3820 | 99.9842 | 91.5527 | 5.6456 | 40.6137 | 0.9699 | 0.0776 |
| 64 | 2.8098 | 26.1394 | 100 | 95.3262 | 5.6457 | 40.6136 | 0.9688 | 0.0594 |
Table 2. Evaluation of performance parameters of coronal axes brain images.
| Axial Plane | %RD | %Sen | %Spe | %Acc | RMSE | PSNR | CC | SSI |
|---|---|---|---|---|---|---|---|---|
| -45 | 2.3143 | 43.0611 | 100 | 93.0008 | 5.6457 | 40.6137 | 0.9719 | 0.0999 |
| -35 | 1.8256 | 42.3746 | 99.6355 | 87.6846 | 5.6457 | 40.6136 | 0.9731 | 0.1599 |
| -29 | 1.6333 | 25.9270 | 99.8060 | 80.5618 | 5.6457 | 40.6136 | 0.9720 | 0.1897 |
| -23 | 1.5119 | 18.9072 | 100 | 74.4110 | 5.6458 | 40.6136 | 0.9728 | 0.2062 |
| -17 | 1.4217 | 20.9665 | 99.9121 | 71.6446 | 5.6457 | 40.6136 | 0.9693 | 0.2223 |
| -11 | 1.3892 | 24.7301 | 99.7721 | 69.4397 | 5.6457 | 40.6136 | 0.9702 | 0.2379 |
| -4 | 1.3706 | 49.3072 | 100 | 79.8462 | 5.6457 | 40.6136 | 0.9653 | 0.2686 |
| 0 | 1.3676 | 49.3802 | 99.9687 | 78.9841 | 5.6457 | 40.6136 | 0.9667 | 0.2753 |
| 7 | 1.3680 | 65.0304 | 95.7717 | 82.3364 | 5.6457 | 40.6136 | 0.9695 | 0.2742 |
| 9 | 1.3698 | 62.4724 | 96.2724 | 81.7871 | 5.6458 | 40.6136 | 0.9692 | 0.2745 |
| 11 | 1.3711 | 62.2585 | 96.4885 | 81.5948 | 5.6457 | 40.6136 | 0.9699 | 0.2716 |
| 21 | 1.4019 | 57.1018 | 99.0230 | 81.6528 | 5.6457 | 40.6136 | 0.9722 | 0.2664 |
| 28 | 1.4360 | 60.9955 | 99.8524 | 84.2957 | 5.6457 | 40.6136 | 0.9739 | 0.2641 |
| 31 | 1.4557 | 59.1488 | 99.9281 | 84.2545 | 5.6457 | 40.6136 | 0.9730 | 0.2526 |
| 37 | 1.5096 | 53.3040 | 99.7876 | 83.3649 | 5.6457 | 40.6136 | 0.9731 | 0.2171 |
| 45 | 1.6093 | 51.4073 | 99.5319 | 84.5047 | 5.6457 | 40.6136 | 0.9733 | 0.1630 |
| 52 | 1.7381 | 43.7377 | 99.9544 | 85.196 | 5.6457 | 40.6137 | 0.9740 | 0.1311 |
| 59 | 1.9320 | 42.9188 | 99.9477 | 87.8555 | 5.6456 | 40.6137 | 0.9741 | 0.1058 |
| 66 | 2.2419 | 46.2605 | 99.9596 | 90.8554 | 5.6457 | 40.6136 | 0.9744 | 0.0140 |
| 74 | 2.9112 | 35.3337 | 100 | 94.4260 | 5.6456 | 40.6137 | 0.9703 | 0.0472 |
Table 3. Evaluation of performance parameters of axial axes brain images.
| Gene-symbol | Gene-name | Temporal lobe (1009) | |||||||
|---|---|---|---|---|---|---|---|---|---|
| FuG | HG | ITG | MTG | PLP | STG | TP | TG | ||
| ATP13A2 | ATPase type 13A2 | 0.7348 | 0.4904 | 0.436 | 0.7994 | 0.7385 | 0.9103 | 0.394 | 0.7095 |
| ATP13A2 | ATPase type 13A2 | 0.1763 | 0.0362 | 0.2209 | 0.4997 | 0.1901 | 0.2735 | -0.3926 | -0.4575 |
| ATP13A2 | ATPase type 13A2 | 0.5915 | 0.1901 | 0.393 | 0.6296 | 0.5416 | 0.6172 | -0.1019 | 0.6599 |
| PLA2G6 | phospholipase A2, group VI | 0.5474 | 0.3094 | 0.7145 | 0.8728 | -0.01 | 0.3704 | 0.1645 | 1.45 |
| PLA2G6 | phospholipase A2, group VI | 0.6242 | 0.8049 | 0.8018 | 1.037 | 0.792 | 0.8634 | 0.3632 | 0.7755 |
| PANK2 | pantothenate kinase 2 | 0.7498 | 0.3183 | 0.8637 | 1.0426 | 0.8359 | 1.138 | 0.3497 | 1.1843 |
| PANK2 | pantothenate kinase 2 | 0.0383 | -0.039 | 0.3525 | 0.4041 | 0.1649 | 0.3654 | -0.2511 | 0.9139 |
| DCAF17 | DDB1 and CUL4 associated factor 17 | -1.111 | -0.685 | -0.4477 | -0.459 | -0.7618 | -0.7368 | -1.671 | -1.5145 |
| DCAF17 | DDB1 and CUL4 associated factor 17 | -0.857 | 1.1656 | -0.0664 | 0.1936 | 0.3913 | -0.1311 | -0.7693 | -1.5939 |
| FA2H | fatty acid 2-hydroxylase | 0.4312 | 0.646 | 0.491 | 0.7335 | 0.2482 | 0.3291 | -0.5366 | 1.0275 |
| FTL | ferritin, light polypeptide | 0.0957 | -0.394 | 0.4807 | 0.8951 | -0.1633 | -0.14 | 0.9766 | 0.5527 |
| FTL | ferritin, light polypeptide | -0.5385 | -0.268 | -0.3583 | -0.463 | -0.9754 | -0.8111 | -0.355 | -1.3685 |
| FTL | ferritin, light polypeptide | 0.1397 | -0.139 | 0.4189 | 0.7713 | 0.3844 | -0.0619 | 1.0032 | 0.1818 |
| FTL | ferritin, light polypeptide | 0.49 | 0.1431 | 0.7961 | 1.2327 | 0.7149 | 0.4299 | 1.0536 | -0.0534 |
| FTL | ferritin, light polypeptide | 0.7504 | 0.0252 | 0.8003 | 1.2034 | 0.841 | 0.5291 | 1.3541 | 1.3565 |
| CP | ceruloplasmin (ferroxidase) | -0.3291 | -0.333 | -0.0529 | 0.2578 | -0.5072 | -0.5076 | -0.6631 | 1.4698 |
| CP | ceruloplasmin (ferroxidase) | 0.0816 | 0.3987 | 0.3147 | 0.6051 | -0.0262 | 0.1535 | -0.3762 | 0.4853 |
| PANK2 | pantothenate kinase 2 | -0.3028 | -0.43 | -0.3236 | -0.26 | -0.6733 | -0.2603 | -0.4188 | -1.2405 |
Table 4. Microarray expression data of genes associated with neurogeneration in iron accumulation for case no. 1009.
| Gene-symbol | Gene-name | Temperoal lobe (1015) | ||||||
|---|---|---|---|---|---|---|---|---|
| FuG | HG | ITG | MTG | PLP | STG | TG | ||
| ATP13A2 | ATPase type 13A2 | 0.5445 | -0.357 | 0.0875 | 0.4397 | 0.1961 | 0.1982 | 0.2435 |
| ATP13A2 | ATPase type 13A2 | 0.0618 | -0.872 | -0.1538 | -0.039 | -0.2016 | -0.1477 | -0.2584 |
| ATP13A2 | ATPase type 13A2 | 0.3145 | -0.626 | -0.0904 | 0.1857 | -0.0088 | -0.0123 | -0.095 |
| PLA2G6 | phospholipase A2, group VI | 0.5189 | 0.3871 | 0.1641 | 0.2536 | -0.0653 | -0.2302 | 0.1514 |
| PLA2G6 | phospholipase A2, group VI | 1.2103 | 0.9949 | 0.5537 | 0.9645 | 0.7989 | 0.6287 | 1.003 |
| PANK2 | pantothenate kinase 2 | 1.6748 | -0.238 | 0.5908 | 0.9414 | 0.4263 | 0.9184 | 0.4067 |
| PANK2 | pantothenate kinase 2 | 1.5868 | -0.552 | 0.5726 | 0.9894 | 0.5368 | 0.9837 | 0.757 |
| DCAF17 | DDB1 and CUL4 | -0.6786 | -0.307 | -0.897 | -0.839 | -0.6765 | -1.027 | -1.1944 |
| DCAF17 | DDB1 and CUL4 | -0.0529 | 0.6431 | -0.4059 | 0.224 | -0.0494 | -0.4334 | -0.4133 |
| FA2H | fatty acid 2-hydroxylase | 0.3648 | 0.8213 | 0.1307 | 0.5309 | 0.3536 | 0.1045 | 0.3888 |
| FA2H | fatty acid 2-hydroxylase | 0.3977 | 0.6857 | 0.1061 | 0.5587 | 0.3349 | 0.0303 | 0.2702 |
| FTL | ferritin, light polypeptide | 0.6052 | 0.2921 | 0.1319 | 0.4078 | 0.5027 | 0.3071 | 0.2215 |
| FTL | ferritin, light polypeptide | -0.4181 | -0.675 | -0.4477 | -0.352 | -0.5527 | -0.3973 | -0.4697 |
| FTL | ferritin, light polypeptide | 0.2633 | -0.416 | -0.1057 | 0.1049 | 0.218 | 0.03 | -0.1148 |
| FTL | ferritin, light polypeptide | 0.5806 | -0.301 | 0.1932 | 0.4578 | 0.4752 | 0.3117 | 0.191 |
| FTL | ferritin, light polypeptide | 0.7636 | -0.093 | 0.3041 | 0.5845 | 0.6223 | 0.4706 | 0.3029 |
| CP | ceruloplasmin (ferroxidase) | -0.4257 | -0.536 | -0.5864 | -0.497 | -0.2763 | -0.3394 | -0.3451 |
| CP | ceruloplasmin (ferroxidase) | 0.0435 | -1.051 | -0.55 | -0.344 | -0.3693 | -0.5069 | -0.6194 |
| PANK2 | pantothenate kinase 2 | 0.2862 | -0.194 | 0.1842 | 0.0878 | 0.2759 | 0.0815 | -0.8658 |
Table 5. Microarray expression data of Genes associated with neurogeneration in iron accumulation for case no. 1015.
| Gene-symbol | Gene-name | Temporal lobe (2001) | ||||||||
|---|---|---|---|---|---|---|---|---|---|---|
| FuG | HG | ITG | MTG | PLP | PLT | STG | TP | TG | ||
| ATP13A2 | ATPase type 13A2 | 0.4312 | -0.193 | 0.1939 | 0.4136 | -0.0757 | -0.5313 | 0.1666 | 1.4838 | -0.3189 |
| ATP13A2 | ATPase type 13A2 | 0.4754 | 0.1328 | 0.1887 | 0.2792 | -0.3373 | -0.1249 | 0.1649 | 0.6876 | -0.1354 |
| ATP13A2 | ATPase type 13A2 | 0.4523 | -0.007 | 0.2082 | 0.3749 | -0.2643 | -0.3199 | 0.2253 | 0.9642 | -0.2922 |
| PLA2G6 | phospholipase A2, group VI | -0.3846 | -0.423 | -0.5133 | -0.28 | 0.0998 | -0.9799 | -0.3964 | -0.3111 | -0.8777 |
| PLA2G6 | phospholipase A2, group VI | 0.3276 | -0.245 | 0.1529 | 0.409 | 0.113 | -0.077 | 0.1013 | 1.2151 | 0.0264 |
| PANK2 | pantothenate kinase 2 | 0.8085 | 0.1588 | 0.4921 | 0.6789 | 0.5108 | -0.1138 | 0.2951 | 1.8381 | -0.2699 |
| PANK2 | pantothenate kinase 2 | 0.0704 | 0.239 | 0.0691 | 0.1224 | 0.3284 | 0.1294 | 0.1837 | 0.8949 | -0.4588 |
| DCAF17 | DDB1 and CUL4 associated factor 17 | -0.8383 | 0.0647 | -0.7526 | -0.698 | -1.2485 | -0.4934 | -0.4171 | -1.4248 | -0.0066 |
| DCAF17 | DDB1 and CUL4 associated factor 17 | -1.134 | 0.1027 | 0.1722 | -0.392 | 0.4119 | 1.0846 | 0.7262 | -0.4074 | -0.7103 |
| FA2H | fatty acid 2-hydroxylase | -0.6818 | -0.098 | -0.5762 | -0.48 | -0.1964 | -0.5395 | -0.4046 | -0.6577 | 0.329 |
| FA2H | fatty acid 2-hydroxylase | -0.8646 | 0.1281 | -0.8381 | -0.698 | -0.6267 | -0.6973 | -0.7474 | -0.8164 | -0.2664 |
| FTL | ferritin, light polypeptide | 0.2459 | -0.052 | 0.0545 | 0.2693 | 1.3181 | 0.1233 | 0.2861 | 0.0608 | -0.248 |
| FTL | ferritin, light polypeptide | -0.3841 | -0.643 | -0.4763 | -0.378 | -0.0175 | -1.0062 | -0.4945 | -0.0522 | -1.0955 |
| FTL | ferritin, light polypeptide | 0.2257 | 0.0631 | 0.1845 | 0.2094 | 0.7076 | -0.0336 | 0.3506 | 0.2684 | -0.5253 |
| FTL | ferritin, light polypeptide | 0.456 | 0.186 | 0.2243 | 0.4459 | 0.9101 | -0.2046 | 0.2801 | 1.1545 | -0.476 |
| FTL | ferritin, light polypeptide | 0.6271 | 0.2876 | 0.3862 | 0.6438 | 1.1675 | -0.0769 | 0.3875 | 1.354 | -0.5252 |
| CP | ceruloplasmin (ferroxidase) | -0.5654 | -0.829 | -0.6971 | -0.843 | -0.976 | -0.9208 | -0.8784 | 1.2616 | -0.5649 |
| CP | ceruloplasmin (ferroxidase) | -0.2464 | -0.238 | -0.0513 | 0.1402 | 0.0332 | -0.2134 | -0.0372 | 0.8696 | -0.5955 |
| PANK2 | pantothenate kinase 2 | 0.0413 | -0.378 | -0.176 | -0.213 | -0.6247 | -0.0137 | -0.2085 | -0.0399 | -0.2607 |
Table 6. Microarray expression data of genes associated with neurogeneration in iron accumulation for case no. 2001.
Results
Image segmentation using discrete curvelet transform with minimum RMSE score (Tables 2 and 3) was done for all MRI images including reference images (case no. 1015, 2001 and 1009). As per shown in Figure 3, DCT is advantageous over DWT based on PSNR and RMSE values. Fuzzy C-means Clustering of images standardized with different clusters. 82% of abnormal images showed temporal lobe localizations (Figures 4 and 6).

Figure 3: RMSE and PSNR comparison values between DWT and DCT.

Figure 4: Results for abnormality of patient brain sample on temporal lobe due to neurodegeneration localization in coronal slices of brain images using DCT with spatial fuzzy c means clustering (patient history : aged 42 years with severe alcoholic degeneration).

Figure 5: Evaluation graph of performance parameters of coronal plane neurdegeneration brain images.

Figure 6: Results for abnormality of patient brain sample on temporal lobe due to neurodegeneration localization in axial slices of brain images using DCT with spatial fuzzy c means clustering (patient history : aged 42 years with severe alcoholic degeneration).
Reference case 1015 with history of neurodegeneration also showed clustering localization as abnormal cells with temporal lobe in both axial and coronal planes. Hence, the main objective is to reduce Root Mean Square Error (RMSE) and also to increase Peak Signal to Noise Ratio (PSNR) and Correlation Coefficient (Tables 2 and 3).
It leads to the accurate measurement of Cerebral Blood Volume, Cerebral Blood Flow and Mean Transmit Time and hence the analysis of brain becomes more accurate. The restored image is segmented into various clusters by using Spatial Fuzzy Clustering. The clusters are formed based on the intensity of the pixels present in the image. The intensity of grey matter, white matter, CSF and neurodegeneration area in the brain will be different and based on which the segmentation is done and grouped into various clusters. Evaluation of performance parameters of Coronal and axial Brain Images were tabulated in Tables 2 and 3. Percentage accuracy, sensitivity, specificity and Residual Difference (RD) were graphed in Figures 5 and 7. Pank2 gene expression of temporal lobe of reference case: 1015 for both axial and coronal MRI images was shown in Figure 8. Microarray gene expression data of all three cases with temporal lobe for particular genes of iron accumulation based neurodegeneration clearly showed variation in expression (Figure 9). The up regulated genes are PANK2, FTL, PLA2G6 and the down regulated genes are CP, ATP13A2. Similar expression patterns are also functionally correlated.

Figure 7: Evaluation graph of performance parameters of axial plane neurodegeneration brain images.

Figure 8: Pank2 gene expression of temporal lobe of reference case: 1015 for both axial and coronal MRI images.

Figure 9: Microarray gene expression data of all three cases with temporal lobe for particular genes of iron accumulation based neurodegeneration.
Discussion and Conclusion
In this work, we have presented an algorithm aimed at automatically localizing the abnormal cells in MRI images. The first phase roughly segments the brain structure using Discrete Curvelet transform by denoising under consideration with images. In the second phase, the structure is more precisely localized abnormalities using a fuzzy C-means clustering based deformable model that adapts its shape to match the anatomical structure of interest. The method is able to deal with imprecise and incomplete images, and our tests on actual images have been successful with statistically valid up to 90%. Image quality is often affected by various artefacts, such as noise which could make it difficult to analyse or to extract useful information. Basically, the goal of image denoising is to reduce the noise as much as possible, while retaining important features such as edges and fine details. Sensitivity measures the proportion of actual positives which are correctly identified as present in the image. Specificity measures the proportion of actual negatives as present in the image. Accuracy is the measurement of the degree to which the result of measurement is equal to the correct or standard value. From the Tables 2 and 3, it has been observed that the Sensitivity, Specificity and Accuracy are more for the proposed work. Microarray gene expression analysis of localized area also confirms the variations in expression comparatively. It will be helpful in the development of gene modules which will be very needful for molecular studies in the present day neuroimaging advancements. Over the past years, there has been exponential growth in the power and clinical utility of imaging modalities such as MRI to diagnose and characterize disease and to guide clinical management. In parallel, the development of functional genomics tools such as DNA microarrays has provided powerful methods for explaining the molecular basis of disease on a genome-wide level.
Discrete Curvelet transform (DCT) can overcome the disadvantages i.e. isotropic and less coefficients are needed to account for edge and reach better approximation rates. But it is not a mature technology and will be improved in future for reducing complexity and better thresholding function [35]. Similarly the improvements of fuzzy C means are important tool in segmentation of brain images. Various diagnostic studies like mammogram analysis, MRI brain analysis, bone and retinal analysis etc., using neural network approach result in use of back propagation network, probabilistic neural network, and extreme learning machine recurrently [36]. The major limitations of many microarray-based studies continue to be the difficulty of translating molecular findings into clinically useful assays or interventions [2]. As shown in this study, the fusion of imaging and functional genomic datasets offers the potential for a more rapid clinical translation [37]. This non-invasive prognostic biomarker may be useful in clinical management; individuals are shown to differ in their susceptibility to therapies [38]. Although these findings will need to be further characterized and validated the power of the combined radiologic and genomic approach provide a paradigm for rapidly identifying test in the clinical setting. Future work includes automating the configuration step which sets the algorithm parameters. The automatic segmentation of the structure and clustering the segmented areas will lead, to identifying sets of genes whose expression generates similar textural patterns in corresponding regions, since it can be argued that genes with similar expression patterns are also functionally correlated.
Acknowledgement
We gratefully acknowledge Dr. S Balaji, MD in Radiology and Dr. G Suresh, MBBS, DCH, Stanley Medical College, Chennai, Tamilnadu, India for their contribution in providing MRI Images for subjects and also necessary inputs for this work. We also acknowledge Dr. G Sathish, MVSc (Animal Biotechnology), Veterinary Department, Govt. Of Tamilnadu, India for providing inputs for gene expression analysis to complete the work successfully.
References
- Henson JW, Gaviani P, Gonzalez RG. MRI in treatment of adult gliomas. Lancet Oncol 2005; 6: 167-175.
- Diehn M, Nardini C, Wang DS, McGovern S, Jayaraman M, Liang Y, Aldape K, Cha S, Kuo MD. Identification of noninvasive imaging surrogates for brain tumor gene-expression modules. Proc Natl Acad Sci USA 2008; 105: 5213-5218.
- Babu G, Sivakumar R. Automatic 3D Brain Image Registration-Survey. Int J Innovat Manage Technol 2013; 4: 5.
- Gonzalez RC, Woods RE. Digital Image Processing, 2nd Ed Prentice Hall, 2002.
- Rahman ZU, Jobson DJ, Woodell GA. Investigating the relationship between image enhancement and image compression in the context of the multi-scale retinex. J Vis Comun Image Represent 2011; 22: 237-250.
- Sivakumar R. Denoising of computer tomography images using curvelet transform. ARPN J Eng Appl Sci 2007; 2: 21-26.
- Babu G, Sivakumar R, Praveena B. Design of Spatial Filter for Fused CT and MRI Brain Images. International Conference on Advanced Computing and Communication Systems (ICACCS -2015), Coimbatore, INDIA. 2015; 05-07.
- Candès E, Demanet L, Donoho D, Ying L. Fast Discrete CurveletTransforms, Technical report, California Institute of Technology, 2005.
- Starck JL, Candès EJ, Donoho DL. The Curvelet Transform for Image Denoising. IEEE Transact Image Process 2002; 11: 6.
- Donoho DL. De-Noising by Soft Thresholding. IEEE Transact Info Theory 1995; 41: 613-627.
- Ding K. Wavelets, curvelets and Wave Atoms for Image Denoising. 3rd International Congress on Image & Signal Processing, CISP 2010.
- Borsdorf A, Raupach R, Flohr T, Hornegger J. Wavelet based Noise Reduction in CT-Images using Correlation Analysis. IEEE Transact Med Imag 2008; 27: 12.
- Kaur D, Mann PS. Medical Image Fusion Using Gaussian Filter, Wavelet Transform and Curvelet Transform Filtering. Int J Eng Sci Adv Technol 2014; 4: 252-256.
- Freiman M, Werman M, Joskowicz L. A curve let based passion-specific prior for accurate multi model brain image rigid registration. Med Image Anal 2011; 15: 3.
- Yu Y, Acton ST. Speckle Reducing Anisotropic Diffusion. IEEE Transact Image Process 2011; 11: 1260-1270.
- Kaur D, Mann PS. Medical Image Fusion Using Gaussian Filter, Wavelet Transform and Curvelet Transform Filtering. Int J Eng Sci Adv Technol 2014; 4: 252-256.
- Sidhu KS, Khaira BS, Virk IS. Medical Image Denoising in the Wavelet Domain Using Haar and DB3 Filtering. Int Ref J Eng Sci 2012; 1: 1-8.
- Hemalatha N. Image Denoising and Deblurring Using Non-Local Means Algorithm in Monochrome Images. Int J Eng Res Gen Sci 2014.
- Raghuvanshi D, Jain D, Jain P. Performance Analysis of Non Local Means Algorithm for Denoising of Dig