Mini Review - Journal of Finance and Marketing (2019) Volume 3, Issue 2
Jordanian infrastructure sub-index returns and optimal portfolio selection
Omar Gharaibeh*
Department of Finance and Banking, Al-albayt University, Mafraq City, Jordan
- *Corresponding Author:
- Gharaibeh O
Department of Finance and Banking
Al-albayt University, Mafraq City Jordan
Tel: +962-772661030
E-mail: omar_k_gharaibeh@yahoo.com
Accepted Date: March 07, 2019
Citation: Gharaibeh O. Jordanian infrastructure sub-index returns and optimal portfolio selection. J Fin Mark. 2019;3(2):19-27.
Abstract
Industry professional and institutional investors want to understand return behaviour and portfolio attributes of infrastructure investment. However, there are limited empirical analyses that support these investments. The scarcity of infrastructure research motivates this study to apply finance theory to this investment. In this paper by collecting monthly Jordanian infrastructure sub-index returns over the period from January 2010 to February 2017, we address two objectives. The first objective is to examine the importance of listed infrastructure sectors by evaluating the investment characteristics as well as performance of various infrastructure subindexes in Jordan. Second, this paper investigates the strategy of infrastructure investors. That is, if the investor obtains diversification benefits by investing in a portfolio including various infrastructure sub-indexes or invests in only a single infrastructure sub-indexes. The results of this study find that Jordanian infrastructure sub-indexes perform differently and provide dissimilarity in monthly returns and volatilities. The current study finds that listed infrastructure sub-indexes are strongly related to general stock market while weakly related to bonds. This study also shows that some infrastructure sub-indexes such as Health Care and Educational Sub-indexes dominate optimal portfolio selection while others such as Hotels and Transportation Sub-indexes are undesirable. This paper presents a first light of Jordanian infrastructure returns and provides the foundation for the evaluation of infrastructure in other countries.
Keywords
Infrastructure, Sub-index, Optimal, Portfolio.
Introduction
The infrastructure is the system of public works in a country, including economic and social infrastructure. Economic infrastructure consists of Transport (roads, tunnels, bridges, ports, parking), utilities (water, power generation, storage, sewage, waste, energy distribution), communications (towers, cable networks, satellites, transmission) and renewable energy, while the social infrastructure consists of schools, educational facilities, health care facilities, senior homes, prisons and stadiums [1].
The importance of infrastructure to the country economies and society is recognized among governments and institutional investors. Good quality infrastructure plays an important role in economic growth and increasing living standards. Pension funds are also paying close attention to recognize the characteristics of infrastructure as an investment. Beeferman declares that there is a scarcity of research on the portfolio advantages of infrastructure asset [2]. Finkenzeller, Dechant, and Schäfers documents that the investment characteristics and economic importance of infrastructure are examined mostly at the global level, with scarce studies of various infrastructure sub-indexes [3]. RREEF reports that infrastructure subindexes have the distinctive investment characteristics and they help to absorb financial crisis [4].
The growing interest in infrastructure has seen a number of studies indicating that infrastructure investments are an asset class in themselves. For example, Idzorek and Armstrong argue that these types of assets are a logical set of assets that share similar characteristics and should be considered as an asset class [5]. Studies such as Rothballer and Kaserer realize infrastructure as low-risk investments because of their regular income flow on the basis of higher organizational structure and low competitive environment with infrastructure companies [6]. Despite the arguments of infrastructure as a class of assets and counter-claims, there is scarcity of finance theory used in literature to address this issue.
Oyedele confirm that infrastructure includes many heterogeneous sub-indexes such as, gas, utilities, ports, power generation, electricity, telecommunication, roads and bridges with no two having identical attributes [7]. Hall, Henriques, Hickford, Nicholls, Baruah, Birkin claim one of the main challenges in recognizing the infrastructure performance is the complexity of the sector [8]. Kakushadze and Serur point out that infrastructure investment strategy improve the risk-adjusted returns of traditional portfolios and generate stable cash flows [9]. Infrastructure is a new great asset class including of many various sub-indexes, each with its own attributes and historical performance. Addressing the current knowledge gap by investigating the characteristics of Jordanian infrastructure sub-indexes to form optimal portfolio selection is the purpose of this study.
Motivated by the importance of infrastructure asset in the economy and the presence of heterogeneity among various infrastructure sub-indexes, as well as a scarcity of study on the portfolio advantage of these types of investments, this paper attempts to understand the performance of six Jordanian listed infrastructure sub-indexes, namely, Health Care, Education, Hotels & Tourism, Transportation, Technology & Communication, and Utilities & Energy Sub-indexes. Therefore, this paper aims to recognize the investment profile of each infrastructure sub-index. In addition, the current study addresses the importance of containing infrastructure in a mixed asset portfolio and attempts to recognize the best way to form portfolio by employing a Jordanian infrastructure sub-indexes.
The results of the Jordanian sub-index analysis show that these sub-indexes perform differently and exhibit difference in monthly returns and volatilities. The strongest reward/ risk profile is shown by the Health Care and Education Subindexes with the largest mean return. Therefore, investing in these Sub-indexes would earn the highest economic value of all the infrastructure sub-indexes. This study shows that listed infrastructure sub-indexes statistically correlated to Jordanian stocks. On the other hand, the results of the cross listed infrastructure sub-indexes correlation matrix with each other and with Jordanian bonds are weakly correlated. The current study also shows that some infrastructure sub-indexes such as Health Care and Educational sub-indexes dominate MV and M-CVaR optimal portfolio selection while other such as Hotels and Transportation sub-indexes do not.
This paper is organized in the following way: Section 2 reviews the relevant literature. Section 3 describes the data and outlines the methodology used in the current study. Section 4 discusses the analysis results and Section 5 provides concluding remarks.
Literature Review
Markowitz assumes that investors gauge risk by the volatility of expected returns of a portfolio [10]. The obstacles of applying the variability of returns as a measure of risk is that it does not take into consideration for tail-risk or the extreme losses that happens during times of financial crisis. Therefore, to overcome the obstacles of the mean-variance, the mean- VaR portfolio selection frameworks has been developed by Alexander and Baptista and Campbell, Huisman, and Koedijk [11,12]. However, the mean-VaR approach shows discontinuities in the loss distributions, therefore, it cannot yield a coherent gauge of risk. Uryasev, Krokhmal, Palmquist, and Uryasev, and Topaloglou, Vladimirou, and Zenios provide a mean-conditional value-at-risk (M-CVaR) depending on algorithms to overcome the limitations of the mean-VaR framework [13-15]. Due to limitations of VaR in the tail-risk, the current study applies CVaR within a portfolio optimization model.
Infrastructure assets have many attractive investment characteristics such as low correlation with other assets and macroeconomic conditions, as well as relatively stable cash flows, therefore, based on these strong benefits in infrastructure, it is useful to investigate the investment characteristics of this asset class Oyedele, Peng & Newell. By examining the performance of funds in Australia, Peng and Newell compare the performance of both listed and unlisted infrastructure fund. They find that listed infrastructure achieves an average annual return of 22.4%, while unlisted infrastructure provides an average annual return of 14.1%. For the annual volatility, Peng and Newell show that listed infrastructure generates higher volatility than all other assets [16]. Comparing five various asset classes depending on asset-liability model, Stanley, Andrews, and Wahba show that infrastructure provides relatively similar volatility to bonds and generates relatively similar returns to stocks [17]. Rickards also compare the infrastructure performance to stock, emerging markets, and cash [18]. He finds that infrastructure outperforms other assets. His results also confirm that infrastructure is inherent attributes yield larger returns and lower volatility.
Using listed and unlisted infrastructure in the U.K., Hartigan, Prasad, and De Francesco show that infrastructure plays an important role for a balanced portfolio. employing Agarwal and Naik and Bianchi and Drew to form long-term monthly returns for the different U.S. infrastructure subindexes, Howard, Bianchi, Bornholt, and Drew show that some infrastructure sub-indexes dominate optimal portfolio selection whereas others are not [19-22]. They find that Utility Sub-index provide the strongest reward/risk profile with the largest average return and the smallest volatility. Panayiotou and Medda address the significance of listed infrastructure sectors by evaluating the investment features and performance of various European infrastructure sub-indexes. They find fluctuations in annual returns and volatilities among various infrastructure sub-indexes. Panayiotou and Medda conclude that when the infrastructure sub-index is jointed with other assets, the portfolio provide a higher Sharpe Sub-index than the Sharpe Sub-index attained by investing in any single asset [23].
Using an asset pricing method, Bianchi, Drew, and Whittaker investigate whether infrastructure is considered asset class. They provide evidence that listed infrastructure index returns are not indeed an asset class or a separate asset class. Their result proposes that listed infrastructure does not generate enough differences in their risk and return, as well as their correlation. Bianchi, et al. propose that listed infrastructure asset display harmonies with global listed stocks [24]. Panayiotou find that infrastructure comprise of different heterogeneous infrastructure indices [25]. Therefore, investors will be able to gain comprehensive knowledge of the performance of the index and still appreciate diversification benefits. A t-Copula-based Conditional Value-at-Risk model to simulate risk and returns, Chakkalakal, Hommel, and Li examine the transport sub-sector individually and in a multiasset, index-based portfolio [26]. Their results reveal that the transport sub-sector has a relatively low dependency on other stocks. By comparing Value-at-Risk (VaR) and Conditional Value-at-Risk (CVaR) scores for both the mean-variance framework and the t-Copula simulation, they also point out the limitations of traditional VaR methods.
The study contributes to the infrastructure finance literature in two ways. Firstly, Jordanian infrastructure sub-index returns perform differently and they have sufficient differences in their tail risks, monthly returns and volatilities which lead to large fluctuations when computing optimal portfolio selection. Therefore, fund managers must recognize these features related to infrastructure sub-indexes that play an important role in driving optimal portfolio decision marking. Secondly, based on Uryasev, Krokhmal, Palmquist, and Uryasev, and Topaloglou, Vladimirou, and Zenios methodology is that it allows us to gauge tail-risk at the level of Jordanian infrastructure sub-indexes by using this information in a MV and M-CVaR framework [13-15]. Thirdly, this paper employs a large sample that consists of all Jordanian infrastructure sub-indexes and it covers the period from January 2010 to February 2017. Therefore, it is providing a comprehensive view about computing optimal portfolio selection in Jordan and how this optimal portfolio should be constructed.
Data and Methodology
The sub-indexes data used in this paper are six monthly infrastructure returns over a time span of 7 years from January 2010 to February 2017 can be directly compared with investable Jordanian stock and bond indexes. All data are downloaded from Amman Stock Exchange (ASE) and Jordanian Central Bank (JCB). The sub-index analysis of the assets involved are Jordanian sub-indexes in Health Care, Education, Utilities & Energy, Technology & Communication, Hotel & Tourism, Transportation, Government Bonds, and Stocks. The current study uses monthly stock exchange general market returns as a proxy for market returns downloaded from ASE, while government bond index is downloaded from JCB. The riskfree monthly rates of returns from the same period are onemonth Treasury bill rate downloaded from JCB in order to compute the Sharp index of each asset. The analysis for sub-indexes pertains to ASE over the period January 2010 to February 2017 because the ASE database has a less comprehensive coverage of Jordanian sub-indexes prior to January 2010. The final sample is collected of 87 monthly returns on each sub-index.
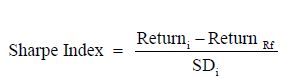
In order to address the first objective of this paper, the analysis of the Jordanian infrastructure asset performance is improved on the basis of two steps. Firstly, the paper computes the monthly return, monthly volatility, as well as Sharp Index for each sub-index. These three measures have been used to compare the performance among the various assets. The Sharp Index is computed by the following formula:
 (1)
(1)
Where:
Returni = Return of sub-index i,
ReturnRf = The return of a risk free rate which is Treasury monthly T-bills in this research,
SDi = Standard deviation of return of sub-index i.
Secondly, diversification benefits among infrastructure subindexes and with other traditional sub-indexes such as Stocks and Government bonds are estimated based on the subindexes’ returns matrix correlation.
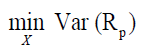
The second objective of this paper is to check the best way to form a portfolio that invests in infrastructure sub-indexes. This study will execute a variety of portfolio optimizations over the 2010-2017 sample periods. The standard Markowitz mean-variance portfolio optimization method is used consisting of stocks and bonds as well as a combination of each infrastructure sub-index. The mean-variance efficient portfolio can be computed by solving the following optimization:
 (2)
(2)
 (3)
(3)
Where:
RP = The n-assets portfolio return,
Var (RP) = X,VX is the n-assets variance,
 , The vector including the asset weighs in
the portfolio,
, The vector including the asset weighs in
the portfolio,
V = The n × n covariance matrix,
E(RP) = The expected return of the portfolio.
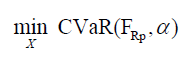
One of the debates against Markowitze method is that the Mean-Variance portfolio gauges the portfolio risk based on the standard deviation [27]. However, the standard deviation is only valid when the distribution of returns is normal. Therefore, to check robustness, this study adopts another portfolio optimisation method, the M-CVaR portfolio, which employs simulations and that don not essential assume that the returns are normally distributed. This estimate is used by Bianchi, Bornholt, Drew & Howard [28]. Another reason to compute mean-CVaR portfolio is that investors are interested in reducing their portfolio tail-risk. This measure will present the largest monthly return for a specific level of CVaR at the 99% confidence interval. Therefore, it is well-known that practitioners would set a minimum return before developing this final portfolio, accordingly the current study will execute a sensitivity analysis on an infrastructure sector with various targeted returns and reducing the CVaR levels.
 (4)
(4)
 (5)
(5)
 (6)
(6)
Where:
R = The portfolio return,
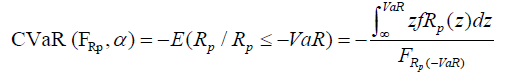
FRP = The cumulative distribution function,
α = The probability level,
fRP = The probability density function,
Results
This Table 1 reports the summary statistics for the data used in this study for the period from January 2010 to February 2017. The first column indicates the name of the sub-index being studied, risk factors used and asset class benchmarks. This is followed by the monthly means, monthly standard deviations (SD), Sharpe index, medians, skewness (Skew), kurtosis (Kurt), maximum values (Max), minimum values (Min) and number of firms for each data series. Panel A details the six infrastructure sub-indexes being investigated, namely, Health Care Sub-index, Educational Sub-index, Utilities & Energy Sub-index, Technology & Communication Sub-index, Hotels & Tourism and Transportation Sub-index. Panel B details the asset classes, namely, MSCI Jordanian Equity Sub-index, Government bonds, and Jordan T-Bills.
Jordanian infrastructure sub-index performance analysis
Table 1 demonstrates the performance of Jordanian assets for the period 2010-2017. Panel A of Table 1 displays the summary statistics of the infrastructure sub-indexes used in this study. The six listed infrastructure sub-indexes provide significant difference in their performance, showing that infrastructure should not be treated as singular asset. Therefore, the behavior and historical performance of infrastructure’s individual sub-indexes should be taking into consideration. Panel B of Table 1 presents the descriptive statistics for the two main investable asset classes. MSCI Jordan Equity Sub-index refers to the performance and investment opportunities that can be empirically generated by commonly investing in Jordanian stocks. The Jordanian bond proxy is a returns series of the Jordanian long-term interest rate on deposits. The current study uses the Jordanian long-term interest rate on deposit as a proxy of the Jordan bond Index because of insufficient data on Jordanian bonds over the sample period.
| Name | Mean% | SD% | Sharpe Index | Median% | Skew. | Kurt. | Max. | Min. | No. of Firms |
|---|---|---|---|---|---|---|---|---|---|
| Panel A: Infrastructure | |||||||||
| Health Care Sub-index | 0.34 | 3.19 | 0.60 | 0.48 | -0.22 | 1.04 | 0.08 | -0.11 | 4 |
| Educational Sub-index | 0.25 | 2.80 | -2.54 | 0.20 | -0.07 | -0.13 | 0.07 | -0.07 | 6 |
| Utilities & Energy Sub-index | -0.55 | 6.34 | -13.74 | -0.78 | 1.32 | 4.98 | 0.26 | -0.15 | 4 |
| Technology & Communication Sub-index | -0.61 | 5.59 | -16.64 | 0.00 | 0.14 | 5.05 | 0.23 | -0.20 | 2 |
| Hotels & Tourism Sub-index | -0.62 | 2.52 | -37.48 | -0.27 | -0.39 | 0.14 | 0.05 | -0.07 | 11 |
| Transportation Sub-index | -1.06 | 4.44 | -31.08 | -1.44 | 0.43 | 0.63 | 0.11 | -0.11 | 12 |
| Panel B: Asset classes | |||||||||
| MSCI Jordan Sub-index | -0.13 | 2.51 | -17.78 | -0.28 | 0.30 | 1.05 | 0.07 | -0.07 | |
| Jordan bond Sub-index | -0.28 | 2.34 | -25.65 | 0.00 | 0.70 | 4.87 | 0.11 | -0.06 |
Table 1: Descriptive statistics
The results in Table 1 indicate that Health shows a strong performance over the sample period, with an average monthly return of 0.34% and volatility at 3.19%. Clearly, Health is the greatest performance infrastructure asset, with a Sharpe Index of 0.60. This is expected, as Jordanian health care is a very stable sector. On the other hand, Hotels and Tourism reveals the worst performance of all infrastructure assets, with an average monthly return of -0.62% and monthly volatility of 2.52%, with a Sharpe Index of -37.48. It can be seen that the Utilities & Energy, Technology & Communication, Hotels & Tourism and Transportation Sub-indexes shows a negative mean returns, while Utility and Energy Sub-index possesses one of the largest volatility statistics of all infrastructure subindex. Given the performance of all infrastructure sub-indexes with MSCI Jordanian Equity Sub-index and Government bonds we conclude that most infrastructure listed sectors (Health, Education, Utility & Energy, and Technology & Communication) perform better than Stocks and Bonds, as illustrated by a higher Sharp Index than Stocks and Bonds. In other words, most infrastructure listed sub-indexes have been affected less negatively than Stocks and Bonds. Although most infrastructures sub-index returns provide a smaller return than Stocks and Bonds, Health Care Sub-index and Educational Sub-index reports a larger historical mean return of 0.34% and 0.25% per month, respectively. Therefore, they have historically performed strongly in comparison to the other risky assets. Finally, Stocks and Bonds show a lower volatility than all of the infrastructure assets.
Diversification benefits among assets
Table 2 reports the statistical significant correlation coefficient of these listed infrastructure sub-indexes with Jordanian stocks. In general, these large correlations indicate the fact that these infrastructure sub-indexes are simply a sub-sector of Jordanian stocks. This high correlation between listed infrastructure sub-indexes with stocks proves that there is no interest achieved from forming a portfolio that invests only in different listed infrastructure sub-indexes with Jordanian stocks. This result is consistent with the literature, which is expected RREEF [4]. Thus, the low correlation, in this analysis, with Jordanian asset is not supported.
On the other hand, the results of the cross listed infrastructure sub-indexes correlation matrix with each other and with Jordanian bonds showed in Table 2 are weakly correlated. This low correlation among the different infrastructure sub-indexes with each other and with Jordanian bonds demonstrates that there is value added from building a portfolio that invests in various listed infrastructure subindexes and with Jordanian bonds. This result is inconsistent with the result of Bianchi, Drew, and Whittaker who provide evidence that listed infrastructure index returns are not separate asset class [24]. However, the Hotel & Tourism and Technology & Communication with Transport are strongly correlated at 1% level. This result is consistent with Hall et al. finding who confirm that demand for infrastructure is largely correlated based on the final demand related to population and economic growth as well as because of intermediated demands among infrastructure sub-indexes [8].
| Variables | Stocks | Bonds | Health | Edu. | Hotels and Tourism | Transport | Technology and Communication | Utilities and Energy |
|---|---|---|---|---|---|---|---|---|
| Stocks | 1 | -0.03 | 0.31*** | 0.06*** | 0.28*** | 0.52*** | 0.25*** | 0.35*** |
| Bonds | 1 | 0.02 | 0.08 | 0.01 | -0.04 | -0.02 | 0.02 | |
| Health | 1 | 0.09 | 0.04 | 0.18 | 0.2** | 0.1 | ||
| Education | 1 | 0.15 | 0.12 | 0.18 | 0.08 | |||
| Hot. &Tourism | 1 | 0.27*** | 0.19** | 0.03 | ||||
| Transport | 1 | 0.36*** | 0.19** | |||||
| Tech. &Comm. | 1 | 0.12 | ||||||
| Util. & Energy | 1 |
***, ** indicate statistical significant at 1%, 5% level, respectively.
Table 2: Cross asset correlation matrix for monthly returns
This table details the correlation coefficients used in meanvariance analyses for the period January 2010 to February 2017. This table displays the correlation coefficients between each investment.
Portfolio selection and infrastructure
Table 3 shows the mean-variance portfolio denoted by (MV) optimal portfolio that provides the minimum-variance portfolio (MVP), the optimal risky portfolio denoted by (ORP) which the portfolio that is tangent to the capital market line, and the optimal portfolio for minimizing the CVaR at the 99% confidence level. In general, Table 3 demonstrates that the Health Care, Educational, Technology & Communication, and Utilities & Energy Sub-indexes feature strongly in their ORPs, while the Hotels & Tourism and Transportation Subindexes do not. In particular, the Hotels & Tourism and Transportation Sub-indexes are not included in the ORP as its return is entirely identical to stocks. Thus, stocks dominate over these two infrastructure sub-indexes. Given the result in Table 3 is that the portfolios that minimize 99% CVaR all relatively hold infrastructure sub-indexes with the exception of the Utilities & Energy Sub-index. This result proposes that investors who prefer M-CVaR portfolio outcomes may take into consideration Jordanian infrastructure sub-indexes as part of their asset allocation.
| 95% | 99% | W% | W% | W% | ||||
|---|---|---|---|---|---|---|---|---|
| Portfolio | Ret. | SD. | Sharpe | CVaR | CVaR | Stocks | Bonds | Inf. |
| Panel A: Health Care Sub-index | ||||||||
| MVP | -0.13 | 1.6 | -26.94 | -2.75 | -3.10 | 35.6 | 47.9 | 16.5 |
| ORP | 0.34 | 3.19 | 0.60 | -6.49 | -10.55 | 0.0 | 0.0 | 100.0 |
| M%99CVaR | -0.16 | 1.70 | -28.22 | -2.84 | -3.07 | 56.32 | 38.37 | 5.31 |
| Panel B: Educational Sub-index | ||||||||
| MVP | -0.07 | 1.51 | -24.71 | -3.62 | -2.74 | 35.3 | 39.8 | 24.9 |
| ORP | 0.25 | 2.80 | -2.54 | -4.97 | -7.47 | 0.0 | 0.0 | 100.0 |
| M%99CVaR | -0.14 | 1.53 | -20.09 | -2.51 | -3.04 | 40.78 | 44.81 | 14.42 |
| Panel C: Hotels and Tourism Sub-index | ||||||||
| MVP | -0.33 | 1.51 | -41.29 | -3.46 | -2.74 | 29.9 | 42.4 | 27.7 |
| ORP | -0.13 | 2.51 | -16.99 | -6.75 | -5.27 | 100.0 | 0.0 | 0.0 |
| M%99CVaR | -0.33 | 1.51 | -41.16 | -3.46 | -2.74 | 30.0 | 42.9 | 27.1 |
| Panel D: Transportation Sub-index | ||||||||
| MVP | -0.24 | 1.68 | -31.79 | -3.67 | -3.06 | 43.5 | 53.5 | 3.1 |
| ORP | -0.13 | 2.51 | -16.99 | -6.75 | -5.27 | 100.0 | 0.0 | 0.0 |
| M%99CVaR | -0.65 | 2.35 | -39.67 | -5.04 | -4.7 | 2.7 | 50.9 | 46.4 |
| Panel E: Technology and Communication Sub-index | ||||||||
| MVP | -0.23 | 1.66 | -31.75 | -3.45 | -2.93 | 42.7 | 52.6 | 4.7 |
| ORP | -0.61 | 5.59 | -16.64 | -20.5 | -13.7 | 0.0 | 0.0 | 100.0 |
| M%99CVaR | -0.29 | 1.77 | -32.77 | -3.61 | -3.13 | 35.0 | 49.0 | 16.0 |
| Panel E: Utilities and Energy Sub-index | ||||||||
| MVP | -0.21 | 1.68 | -30.03 | -3.63 | -3.02 | 46.4 | 53.6 | 0.0 |
| ORP | -0.55 | 6.34 | -13.74 | -14.58 | -11.41 | 0.0 | 0.0 | 100.0 |
| M%99CVaR | -0.18 | 1.76 | -27.46 | -3.44 | -3.02 | 61.4 | 38.6 | 0.0 |
Table 3: Mean variance analysis.
This Table 3 details the mean-variance (MV) optimizations for the minimum variance portfolio (MVP), the optimal risky portfolio (ORP) which is the portfolio that is tangent to the Capital Market Line, and the portfolio that will minimize the Mean-Conditional-Value-at-Risk at the 99% confidence level computed from the monthly returns for the January 2010 to February 2017 period. These returns are derived by combining the actual monthly return observations and the simulated model’s monthly returns up to the commencement of the empirical returns. The investment universe in this analysis includes Jordanian stocks, Jordanian bonds and the five infrastructure indices. Ret. refers to the mean monthly portfolio return, SD. Refers to the portfolio standard deviation, Sharpe indicates the monthly Sharpe ratio of portfolio returns, and CVaR indicates the Conditional-Value-at-Risk at the 95% and 99% confidence levels, respectively. W% refers to the optimal portfolio weights distributed to each asset class and W% Inf. refers to the optimal portfolio weighting of the corresponding infrastructure sub-index.
This Table 4 details the minimum conditional-value-at-risk for a targeted portfolio average monthly return for the Jordanian Health care and Education Sub-indexes, Amman SE General and Jordanian bonds in Panel A and B, respectably. The portfolio analysis is based on the sample period January 2010 to February 2017. The table details the targeted portfolio average monthly return and the Mean- Conditional-Value-at- Risk that can be achieved, the portfolio standard deviation, the Sharpe ratio and W% indicates the portfolio weightings distributed to each asset class.
| Monthly Return % |
99% CVaR |
S.D. | Sharpe | W% Stocks |
W% Bonds |
W% Inf. |
|---|---|---|---|---|---|---|
| Panel A: Health Care Sub-index | ||||||
| -0.17 | -4.11 | 1.89 | -25.98 | 71.12 | 28.88 | 0.00 |
| -0.16 | -3.07 | 1.70 | -28.22 | 56.32 | 38.37 | 5.31 |
| -0.15 | -4.10 | 1.86 | -25.33 | 68.50 | 27.61 | 3.90 |
| -0.05 | -4.25 | 1.90 | -22.30 | 31.78 | 39.13 | 29.09 |
| 0.05 | -5.97 | 2.03 | -13.33 | 0.00 | 46.92 | 53.08 |
| 0.15 | -7.54 | 2.33 | -7.33 | 0.00 | 30.75 | 69.25 |
| 0.25 | -9.13 | 2.75 | -2.58 | 0.00 | 14.57 | 85.43 |
| 0.34 | -10.55 | 3.19 | 0.60 | 0.00 | 0.00 | 100.00 |
| Panel B: Education Sub-index | ||||||
| -0.16 | -3.07 | 1.57 | -30.69 | 43.51 | 46.66 | 9.82 |
| -0.14 | -3.04 | 1.53 | -30.09 | 40.78 | 44.81 | 14.42 |
| -0.10 | -3.61 | 1.55 | -28.06 | 35.31 | 41.10 | 23.59 |
| -0.05 | -4.85 | 1.57 | -23.64 | 22.62 | 40.67 | 36.71 |
| 0.05 | -6.27 | 1.89 | -14.30 | 9.01 | 31.44 | 59.55 |
| 0.15 | -7.28 | 2.35 | -7.28 | 0.00 | 18.89 | 81.11 |
| 0.25 | -7.47 | 2.80 | -2.54 | 0.0 | 0.0 | 100.0 |
Table 4: Mean conditional value at risk for a targeted return.
Mean-CVaR portfolio selection
This study continues to assess the optimal portfolio weights to reduce the 99%CVaR for targeted mean returns. Institutional investors attempt to maximize returns but are automatically forced by their investment governance to manage large unanticipated negative shocks or extreme left tail-risk to their portfolios. The M-CVaR portfolio optimizations detail a zero allocation to the Hotels & Tourism and Transportation Subindexes. The Technology & Communication and Utilities & Energy Sub-indexes show negative mean returns with relatively higher tail-risk. On the other hand, the M-CVaR portfolio optimization detailed in Table 4 demonstrates that the Health Care and Education Sub-indexes are desirable. The findings in Table 4 reveal that the Health Care and Education dominates Jordanian stocks in the M-CVaR framework.
The major finding from the M-CVaR portfolio analysis is the similar relationship among the MVP, the ORP distributions, and the minimization of the CVaR for a specified target portfolio return. This finding supports Alexander and Baptista’s and Fung and Hsieh’s finding who confirm that the optimal portfolio weightings under the MV framework do not take into consideration the larger than normal probability of extreme negative returns, although they are almost precise [11,29]. The justification for this result is the extreme outliers of stocks increase the standard deviation of portfolio and reduce the mean return of portfolio enough for it not to be involved in either the MVP or ORP.
Jordanian portfolio analysis with and without infrastructure
Panel A and B of Table 5 reports Jordanian portfolio with Government Bonds and MSCI Jordanian Equity, respectively. Given the Panel A of Table 5, by investing only in Jordanian portfolio with Government Bonds generates a Sharpe index of -25.65, while investing only in Jordanian stocks provides a Sharpe index of -17.78. By investing only in MSCI Jordanian Equity can achieve a Sharpe index higher than if we invest only in Jordanian Government Bonds. Based on this finding, it is more useful to invest only in MSCI Jordanian Equity Stocks than to invest in Jordanian Government Bonds.
By investing a portfolio that combines Jordanian Government Bonds and Jordanian stocks showed in Panel C of Table 5, this optimal return portfolio provides a Sharpe index of -17.78. Clearly, MSCI Jordanian Equity dominate over the Bonds and this finding confirms the previous result that there are no diversification benefits between Jordanian government bonds and MSCI Jordanian Equity Stocks for optimizing ORP. However, as a sensitivity analysis, Panel C of Table 5 shows that M99%CVaR can be reduced to -3.44 by holding Jordanian Government Bonds and MSCI Jordanian Equity Stocks. This result suggests that investors who prefer M-CVaR portfolio outcomes could be consider Government Bonds and MSCI Jordanian Equity as part of their asset distribution.
Panel D of Table 5 displays Jordanian portfolio with infrastructure sub-indexes. To save space, this paper adopts two infrastructure sub-indexes that provide the largest returns, Health and Education Sub-indexes, among listed infrastructure sub-indexes. Panel D of Table 5 reveals that the portfolio that maximizes the Sharpe index invests in Health Sub-index only. Thus, it is achieving a Sharpe index of 0.60 and a return of 0.34% and a volatility of 3.19%. As a sensitivity analysis, this paper commences a second optimization method, the M%99CVaR optimization, Panel D of Table 5 shows that M99%CVaR can be reduced to the lowest level of -2.55 by holding Jordanian Government Bonds, MSCI Jordanian Equity Stocks, and Education Infrastructure Sub-index. This result verifies our previous observation that there are diversification benefits among Government Bonds, MSCI Jordanian Equity and Education Infrastructure Sub-index and suggests that investors who prefer M-CVaR portfolio outcomes could be consider Government Bonds, MSCI Jordanian Equity and Education Sub-index as part of their asset distribution. These findings contradict with results of Bianchi, Drew, and Whittaker who propose that listed infrastructure does not provide adequate differences in their return, risk [24].
| 95% | 99% | W% | W% | W% | W% | ||||
|---|---|---|---|---|---|---|---|---|---|
| Portfolio | Ret. | SD. | Sharpe | CVaR | CVaR | Stocks | Bonds | Education | Health |
| Panel A: Jordanian portfolio with Government Bonds only | |||||||||
| -0.28 | 2.34 | -25.65 | -5.23 | -6.46 | 0.0 | 100Â Â Â Â Â Â Â 0.0% | 0.0 | 0.0 | |
| Panel B: Jordanian portfolio with MSCI Jordan Equity only | |||||||||
| -0.13 | 2.51 | -17.78 | -5.27 | -6.75 | 100 | 0.0 | 0.0 | 0.0 | |
| Panel C: Jordanian portfolio with Government Bonds and MSCI Jordan Equity | |||||||||
| MVP | -0.21 | 1.68 | -31.43 | -3.02 | -3.63 | 46.4 | 53.6 | ||
| ORP | -0.13 | 2.51 | -17.78 | -5.27 | -6.75 | 100 | 0.0 | ||
| M%99CVaR | -0.18 | 1.76 | -28.73 | -3.02 | -3.44 | 61.4 | 38.6 | ||
| Panel D: Jordanian portfolio with infrastructure sub-indexes | |||||||||
| MVP | -0.05 | 1.46 | -25.26 | -2.78 | -3.45 | 28.8 | 37.6 | 21.94 | 11.58 |
| ORP | 0.34 | 3.19 | 0.60 | -6.49 | -10.55 | 0.0 | 0.0 | 0.0 | 100.0 |
| M%99CVaR | -0.14 | 1.57 | -29.24 | -2.64 | -2.55 | 49.3 | 38.7 | 12.27 | 0.00 |
Table 5: Optimal portfolio selection across infrastructure sub-indexes.
Conclusion
This paper examines the performance of different six listed Jordanian infrastructure asset, namely, Health Care, Education, Hotels & Tourism, Transportation, Technology & Communication, and Utilities & Energy Sub-indexes. In addition, this study investigates the importance of comprising infrastructure in a mixed asset portfolio and endeavors to determine the best way to form and invest in an infrastructure portfolio.
The results of the Jordanian analysis reveal that infrastructure sub-indexes perform differently and demonstrate dissimilarity in monthly returns and volatilities and this result is consistent with most previous studies such as Inderst, Oyedele and Panayiotou. The Health Care Sub-index shows the strongest reward/risk profile with the largest mean return. Therefore, investing in this sector would provide the highest economic value of all the infrastructure sub-indexes. This study shows that there is a statistical significant correlation coefficient of listed infrastructure sub-indexes with Jordanian stocks. On the other hand, the results of the cross listed infrastructure sub-indexes correlation matrix with each other and with Jordanian bonds are weakly correlated. The current study also shows that some infrastructure sub-indexes such as Health Care and Educational sub-indexes dominate MV and M-CVaR optimal portfolio selection while other such as Hotels and Transportation sub-indexes do not. This paper shows that investing in some infrastructure sub-indexes with other traditional assets leads to a portfolio with a higher Sharpe index than a portfolio that does not contain these infrastructure sub-indexes. Although these results are consistent with the previous studies such as Kakushadze and Serur, These results are not consistent with results of Bianchi, Drew, and Whittaker who show that listed infrastructure does not generate ample differences in their risk and return.
The analysis of these infrastructure sub-index returns presents us with a number of significant implications for pension fund managers and institutional investors. First, infrastructure subindex returns perform differently and they have sufficient differences in their tail risks as well as in monthly returns and volatilities to cause large variations when computing optimal portfolio selection. Therefore, fund managers must recognize these characteristics related to infrastructure sub-indexes that play an important role in driving optimal portfolio decision marking. The second implication is that, for the same amount of risk, investors can obtain higher returns.
In regard to the findings in this empirical study, the strongest results were accomplished with the optimal portfolio. A second research area would be to discover the performance of Jordanian infrastructure at the level of individual stocks rather than at the level of sub-indexes to check if stock infrastructure level can determine the best way to form and invest in a stock infrastructure optimal portfolio. In addition, it can be useful to find out why some Jordanian infrastructure sub-indexes are performing poorly.
References
- Inderst G. Infrastructure as an asset class. EIB papers. 2010;15(1);70-105.
- Beeferman L. Pension fund investment in infrastructure: A resource paper. Occasional Paper. 2008;3.
- Finkenzeller K, Dechant T, Schäfers W. Infrastructure: A new dimension of real estate? An asset allocation analysis. J Property Invest Fin. 2010;28(4);263-274.
- RREEF. Performance characteristics of infrastructure investments. San Francisco, California 2011.
- Idzorek T, Armstrong C. Infrastructure and strategic asset allocation: Is infrastructure an asset class. Ibbotson Associates 2009.
- Rothballer C, Kaserer C. The risk profile of infrastructure investments: Challenging conventional wisdom. J Structured Fin. 2012;18(2);95.
- Oyedele JB. Performance and significance of united kingdom listed infrastructure in mixed-asset portfolio: European Real Estate Society 2013.
- Hall JW, Henriques JJ, Hickford AJ, et al. Assessing the long-term performance of cross-sectoral strategies for national infrastructure. J Infrastructure Systems. 2014;20(3);04014014.
- Kakushadze Z, Serur JA. Infrastructure 151 trading strategies. Springer Nature. 2018;1;269-273.
- Markowitz H. Portfolio selection, efficent diversification of investments: J Fin. 1959;15(3);305-314.
- Alexander GJ, Baptista AM. Economic implications of using a mean-VaR model for portfolio selection: A comparison with mean-variance analysis. J Econ Dyn Control. 2002;26(7);1159-1193.
- Campbell R, Huisman R, Koedijk K. Optimal portfolio selection in a Value-at-Risk framework. J bank Fin. 2001;25(9);1789-1804.
- 0Uryasev S. Conditional value-at-risk: Optimization algorithms and applications. Paper presented at the Computational Intelligence for Financial Engineering, 2000.(CIFEr) Proceedings of the IEEE/IAFE/INFORMS 2000 Conference on.
- Krokhmal P, Palmquist J, Uryasev S. Portfolio optimization with conditional value-at-risk objective and constraints. J risk. 2002;4(2);43-68.
- Topaloglou N, Vladimirou H, Zenios SA. CVaR models with selective hedging for international asset allocation. J bankFin. 2002;26(7);1535-1561.
- Peng W, Newell G. The significance of infrastructure in australian investment portfolios. Pacific Rim Property Res J. 2007;13(4);423-450.
- Stanley M, Andrews A, Wahba S. Investing in infrastructure: a primer. Infrastructure Paper Series. 2007;2.
- Rickards D. Global infrastructure?a growth story. Infrastructure Finance: Trends and Techniques. 2008;1-47.
- Hartigan LR, Prasad R, Francesco DAJ. Constructing an investment return series for the UK unlisted infrastructure market: Estimation and application. J Property Res. 2011;28(1);35-58.
- Agarwal V, Naik NY. Risks and portfolio decisions involving hedge funds. Rev Financ Stud. 2004;17(1);63-98.
- Bianchi RJ, Drew ME. Sustainable stock indices and long-term portfolio decisions. J Sustain Fin Investment. 2012;2(4);303-317.
- Howard MF, Bianchi RJ, Bornholt GN, et al. Long-term US infrastructure returns and portfolio selection. J bank Fin. 2011.
- Panayiotou A, Medda F. Portfolio of Infrastructure Investments: Analysis of European Infrastructure. J Infrastructure Sys. 2016;22(3);04016011.
- Bianchi R, Drew M, Whittaker T. Is ?ListedInfrastructure? a fake asset class?.2017
- Panayiotou A. Infrastructure as a Financial Asset Class. UCL (University College London.2017;22(3).
- Chakkalakal L, Hommel U, Li W. Transport infrastructure equities in mixed-asset portfolios: estimating risk with a Garch-Copula CVaR model. J Property Res. 2018;35(2):117-138.
- Markowitz H. Portfolio selection. J Fin. 1952;7(1);77-91.
- Bianchi RJ, Bornholt G, Drew ME, et al. Long-term US infrastructure returns and portfolio selection. J Bank Fin. 2014;42;314-325.
- Fung W, Hsieh DA. Is mean-variance analysis applicable to hedge funds? Economics Letters. 1999;62(1);53-58.