Research Article - Journal of Agricultural Science and Botany (2021) Volume 5, Issue 12
Impact of soil types on vegetation cover (herbaceous, grasses &trees) and rangelands management process in south kordofan state, sudan.
Abdelrahim Omer Abdelrahim Ibrahim1, Mulik Abbaker Ibrahim1,2*, Mohammed Abdelmanan2
1Department of Forestery Sciences, University of Zalingei, Sudan
2Department of Forestry, College of Forest Sciences, University of Zalingei, Sudan
- *Corresponding Author:
- Mulik Abbaker Ibrahim
Department of Forestery Sciences, University of Zalingei Sudan
E-mail: mulikabaker@yahoo.com
Accepted on December 17, 2021
Abstract
This research was conducted in South Kordofan State in general and the vegetation measurements were focusing at Eldebeibat area for the two rainy seasons (2013 – 2014). It aimed to assess the impact of soil types on vegetation cover (herbaceous, grasses and trees). According to soil types, the study area divided into the three sites namely: sandy, clay and gardud. To determine the vegetation cover (herbaceous and grasses) measurements, the Parker Loop Methods [1] were used to obtain plant composition%, relative plant composition% and Quadrat Method was used to determine frequency and plant cover%. The Nearest Individual Method [2] was used to measure the trees density and relative trees density. The socio-economic survey for sedentary and the nomadic families to identify the plants species the three sites was done. Eight transects (100m length) were laid out randomly in each site and then ten quadrats (1x1m) were taken along each transect and vegetation measurements were taken at 10 m interval. Each quadrat represented point to identify the nearest species of trees. The standard equations were used to calculate parameters of vegetation measurements and data of socio – economic calculated to obtain frequency and percentage. The results showed there were variations between the three sites in vegetation cover. Sandy had the highest plant composition, compared to the clay and gardud sites. Nevertheless, the three sites recorded different plant cover% and the three sites were dominated by different species in both understory and overstory respectively. Sandy dominated by Zornia glochidiata and Guiera senegalensis, clay dominated by Schoenfeldia gracilis and Acacia oerfota and gardud was dominated by Vossia cuspidata and Acacia mellifera. The pastoralists confirmed the three sites dominated with different species. Schoenfeldia gracilis considered dominant species in the clay site, Sandy sites was dominated by Zornia glochidiata , clay dominated by Shoenfeldia gracilis and gardud dominated by Eragrostis spp and sedentary communities through investigated about plants species occurrence around their villages were different such as Zornia glochidiata, Eragrostis spp and Schoenfeldia gracilis.
Keywords
Plant attributes dominant species, herbaceous, clay site, sandy site, gardud site, plant composition, frequency, relative plant composition, plant cover, overstory, and understory
Introduction
Rangelands are these areas of the world which by reasons of physical limitations such as low and erratic precipitation, rough topography, poor drainage, and high or cold temperatures - are unsuited to cultivation and which are a source of forage for freeroaming native and domestic animals, as well as a source of wood products, water and habitats of wildlife [3]. About half of the terrestrial land resource on the globe can be classified as range. In Sudan over thousands years, grazing has been one of the major land use activities and continue to remain an important activity. Often grazing have been poorly managed and has led to a large - scale soil loss. Currently, many rangelands show signs of either degradation or overgrazing; both conditions lead to reduced vegetation cover and water absorption in the soil, this in turn, leads to accelerated rangelands environmental degradation. According to Musa (2001) the high number of animals concentrated in some places during rainy season, causes overgrazing. In the Sudan rangelands form an immense natural resource, occupy an area of 110 million hectares before country secession and provide about 86% of feed for livestock [4]. South Kordofan state has a wide area of rangeland, about 11.335.000 feddan, 15% of the Sudan rangelands. These rangelands give about 23.6% with total fodders produce from natural rangelands. The rangelands in Sudan are varied from poor to rich according to the ecological zones, especially in South Kordofan State in Western and central regions, including Nuba mountains area [5]. Livestock in El Dilling locality depend mainly on rangelands vegetation (herbaceous, grasses and woody species) and on crop residues as second animals’ feeding source during dry seasons; these may be due to the availability of crop residues in the area of rangelands [6]. Livelihood in the area depends mainly on livestock raising and farming, these problems enforced large numbers of farmers and herders to migrate from their villages to search for water and fodder. Very heavy grazing results in a decline in the number of species; changes in vegetation also have an impact on soil properties, including soil fauna. In addition to, concentrating a large number of animals in smaller grazing area that have recently received high intensity can cause soil compaction and decrease infiltration rates of water [7]. Many studies have shown that biotic environmental factors, such as topographic parameters, can be important sources of variation of plant diversity [8,9]. Grassland diversity is strongly affected by environmental factors; e.g. soil and topography [10].
In order to understand the relationships between ecological elements of rangeland and improved principles of rangelands management, it is necessary to study plant species diversity [9]. Species diversity of plants can be divided into two main components: ‘richness’, which represents the number of species in a given area, and ‘evenness’, which represents the variability in species abundance [11]. Species richness is considered as a prominent factor of productivity and stability [10,12] and predominantly controlled by local factors, and only secondarily by factors operating at the landscape level [9]. Species diversity is regarded as one of the most central criteria in biodiversity assessments and in decisions about management priorities for grasslands. However, the majority of studies on the impact of landscape and environmental variables on plant species diversity in grasslands have focused on the assessment of species richness. On slopes, differences in species composition were explained by resource availability, especially water [12]. By monitoring long-term vegetation change, due to the edaphic factors, south-facing slopes maintained more stress-tolerant and light-demanding flora in British chalk grasslands [8,12]. The difference of plant species composition and productivity, long-term operating soil weathering, and erosion processes are usually accelerated on south facing slopes, resulting in different soil properties of north- and south directed slopes [12]. Given this background, in order to assess the relevance of the environmental factors (soil properties and aspects) and species diversity, we surveyed vegetation parameters and soil characteristics of northern, eastern, southern and western slopes of Zagros mountainous rangelands (vegetation type: grass-shrub) under local management practices in 2009. We hypothesized that species diversity depended strongly not only on soil characteristics, but also on topography. Rangelands are grazed heavily by their animals since no rule to recognize grazing practices, which lead to rangeland deterioration. Grazing is not simply the removal of leaf material from grass plants. But the impacts of leaf material by grazing are complex. In this manner different grazing management treatment causes diverse change in plants growth, and these changes affect the quantity and quality of the aboveground biomass produced on rangelands. Grazing can change plant species composition, manipulate some plant and ecosystem processes, and alter levels and rates of plant growth. Repeated heavy grazing removes a great amount of the leaf area and causes long- term reductions in the total rangeland production. Livestock have a major impact on rangeland vegetation composition and stability of grassland, if over exploitation by grazing animals desired plants could change by other undesired plants species. There is a need to understand the responds of plants to the intensity and frequency of livestock impacts in relation to rangeland environmental conditions and the animal factors, which affects not only the intensity and frequency of impact, but also the distribution of those impacts.
Materials and Methods
The study area
The study area lies between latitude 11° 45′ – 12° 49′ N and longitude 25º 29′ – 30° 0 E. The area is about 5700Km2 and constitute 7.3% of the total area of the South Kordofan State [13], (Figure 1).

Figure 1. Administrative map of Sudan illustrates the study area.
Sampling procedures
Three rangelands sites were identified in the study area based on soil types identified during First a visit conducted in October 2012; the area included sandy, clay and gardud (Plates.1,2and 3) respectively. The three sites represented the main types of rangelands in the study area based on the minimal area theory. Each site was divided in two blocks, area of each block 500m2. Four transects were laid randomly within each block, the length of each transect was100m to come up with eight transects in each site and ten quadrats were distributed along each transect (interval 10m) to come up with 40 quadrats in each block (Figure 2). Two questioners were designed for both groups (pastoralists and sedentary communities) to collect information about species of plants occurrences in the three sites, date of entering and existing from each site and preference of sites to grazing practices by pastoral communities.
Data analysis
The standard equations were used to determine the data of vegetation measurements, which mentioned bellow in part no. (3) Measurements of vegetation cover. The frequency and percentage of Socio – economic data were calculated.
Measurements of Vegetation Cover
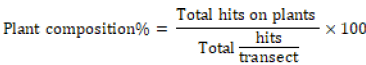
Plant composition
Plant composition refers to the total plants observed from total number of hits; while the relative plants composition refer to the contribution of each individual plant species in the total plants percent. Parker loop method [1] was used. A total of 100 hits per transect were taken, then distribution of the species, litters, bare soil and rocks along each transect were identified. The total hits of each parameter were calculated. The following equations were used to calculate per cent of certain parameters such as (Plants composition%, relative plants species composition%, litter%, bare soil% and rocks %).
 (1)
(1)
 (2)
(2)
 (3)
(3)
Parameter = If it is present refer to litters or bare soil or rocks.
Frequency
Frequency is the quantization expression of the presence or absence of individual of species in population. Frequency is typically used to evaluate plant species distribution over an area and/or change in abundance of species over time due to management.
Ten quadrats per transect at interval of 10 m that give (40) quadrat per block and (80) quadrat per site to estimate plant distribution at the study area.
Plant frequency was calculated by counting species, which occur within each quadrat and recorded their names only not their number in form of frequency. The following equation was used to calculate frequency [14].
 (4)
(4)
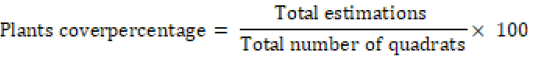
Plant cover percentages
Plant cover is defined as the area of ground that is occupied by the above-ground parts of each species when viewed from above. It was estimated as a visual percentage of the quadrat covered by plant material [15]. Plants rooted outside the quadrat are included in cover measurements to the extent that their canopy projects into the quadrat space.
Plant cover percentage usually estimated by looking at the quadrat from the above and estimate approximately the part covered by plants. Plant cover per cent was estimated for each quadrat and recorded in form of plant cover%. The total cover for all quadrats determined total cover for each block, which is divided by the number of quadrats taken in each block to obtain one average. The following equation was used to calculate plants cover%.
 (5)
(5)
The Socio - economic aspect in the area
The data of the socio-economic depend on distribution of questionnaires for sedentary and nomadic families were utilized rangelands in the study area, the information which collected from them included plants species growing in the three sites, time of entering and existing from different rangeland’s sites and preference of sites for using by nomadic families particularly in the rainy season.
Data analysis
The standard equations were used to analyse data of vegetation measurements and for socio-economic data, the percentage and frequency of results gathered through distribution questionnaires were tabled.
Results and discussion
Sites’ preference
In the study area, 73% of the nomads preferred sandy site to practice grazing particularly in the rainy season compared to 64% of sedentary (Table 1). In contrary, both the nomads and sedentary preferred clay site (8% and 11%) and gardud site (19% and 25%) respectively. According to the reasons of selecting certain sites for grazing 43% of the nomads stated the reason was due to availability of plants, 37% due to livestock’s movement was easy in rainy season, followed by 20% free from insects (Table 2).
| Site | Frequency | % | ||
|---|---|---|---|---|
| Sedentary | Mobile pastoralists | Sedentary | Mobile pastoralists | |
| Sandy | 178 | 82 | 73 | 64 |
| Clay | 20 | 14 | 8 | 11 |
| Gardud | 45 | 33 | 19 | 25 |
Table 1. Sites types and preference for grazing in the rainy season by both respondents at the study area.
| Reasons | Frequency | % |
|---|---|---|
| Availability of palatable plants | 56 | 43 |
| Easy animals movement | 47 | 37 |
| Free from insects | 26 | 20 |
Table 2. Reasons for the sites’ preference for grazing in the rainy
season by the nomads at the study area.
During rainy season more than half of the nomads enter to the sandy site in early June. 58% of the nomads starting entering the sandy site compared to 24% and 18% for clay and gardud sites respectively. By the end of the rainy season (October) 44% of the nomads exist in gardud compared to 39% and 17% from sandy and clay site respectively (Table 3). The early entering could be attributed to the characteristics of sandy site which lead to facilitate and accelerate germination process of plants species seeds and create vegetation cover earlier than other sites (clay and gardud) and livestock movement is easy. For all of these factors, sandy site encourages herders to graze it early before other sites. On the other hand, the early existing could be due to the drying of grasses and shortage of water in gardud site. Grasses remain green until the end of rainy season in the clay site that encourages the nomads to stay longer in this site, which leads to intensive grazing which could affect vegetation cover.
| Sites | Frequency | % | ||
|---|---|---|---|---|
| June (+) | October(-) | June (+) | October(-) | |
| Sandy | 75 | 50 | 58 | 39 |
| Clay | 31 | 22 | 24 | 17 |
| Gardud | 23 | 57 | 18 | 44 |
| (+) starting date and (-) starting existing date | ||||
Table 3. Time of entering and exiting to the three sites by the nomads
at the study area.
Land cover
Herbaceous and grasses cover (understory) at the study area
Plants composition
Plant composition at the three rangelands’ sites for the two rainy seasons (2013/2014) showed no systematic trend. Sandy site scored the highest plant composition compared to the other sites that was 95% and 87% for year 2013 and 2014 respectively, with small difference within the two rainy seasons. Gardud site had high plant composition (76%) compared to (66%) for clay site in the rainy season of 2013. In the rainy season of 2014 the trend was reversed, gardud had low plant composition relative to clay that was 44% and 67% respectively (Table 4). However, the plant composition highly decreased at gardud site in the rainy season of 2014 which was 32% compared to 8% and 1% for sandy and clay respectively.
| Sites | Seasons | |
|---|---|---|
| 2013 | 2014 | |
| Sandy | 95 | 87 |
| Clay | 66 | 67 |
| Gardud | 76 | 44 |
Table 4. plant composition at the three site in the two rainy seasons
(2013 -2014).
Plant cover
The three sites at the study area scored low plant cover percentage, sandy had (16% and 27%), and the clay (11% and 16%) and the gardud (11% and 16%) for the (2013/2014) respectively (Table 5). This could be due to intensive and early grazing, expansion of agriculture, deforestation and compaction soil surface causes by repetition of livestock’s movement. All these lead to loss of the vegetation cover for both (overstory and understory) in the area. [16, 17] reported that both natural (floods, fires, droughts, volcanoes, etc.) and human activities such as (deforestation, overgrazing, urbanization and pollution) influences are known to cause massive changes in vegetation cover and dynamics. Overgrazing was considered as the main biotic factor responsible for the low vegetation cover besides overgrazing or un-controlled grazing, trampling by domestic livestock in semi-arid regions always reduces plant cover that protects the soil and generally results in soil erosion and soil compaction [18]. All sites did not reach the standard percentage of plant cover needed to protect soil and reduce the erosion in the area, the percentage of plant cover in the study area ranging from 11% – 27%. [19] Reported that when the per cent of vegetation cover is less than 30% – 40%, run-off and soil loss dramatically increase.
| Parameter | Sites | |||||
|---|---|---|---|---|---|---|
| Sandy | Clay | Gardud | ||||
| 2013 | 2014 | 2013 | 2014 | 2013 | 2014 | |
| Plant cover% | 16 | 27 | 11 | 16 | 11 | 16 |
Table 5. Plant cover/m2 at the three sites for the rainy seasons
(2013/2014) at the study area.
Relative plants species composition
The estimation of this parameter is important to investigate the increment distribution of the species in the rangeland and to assess the structure of the plant community. (Table 6) shows average relative plants species composition at the three sites for the two rainy seasons (2013/2014). The plants species which measured by Loop method in the sandy site included Zornia glochidiata (27% and 75%), Eragrostis spp (22% and 9%), Echinochloa colonom (25% and 5%), Aristida spp (7% and 4%), Oldenlandia senegalensis (5% and 3%), the species in the clay included Schoenfeldia gracilis scored (53% and 53%), (Chloris gayana (2% and 15%), Eragrostis spp (4% and 13%), Dactyloctenium aegyptium(10% and 2%), Chloris preiurii (11% and 1%) and gardud site integrated the following species Vossia cuspidata (44% and 46%), Schoenfeldia gracilis (38% and 15%), Zornia glochidiata (0.0% and 16%), Dactyloctenium aegyptium (4% and 5%), Echinochloa colonom (5% and 3%). The spatial variation of plants species in the three sites could be due to variation of rainfall and soil topography, the three sites dominated by different species in both rainy seasons such as sandy site dominated by Zornia glochidiata (27% and 75%) respectively, clay site dominated by Schoenfeldia gracilis (53% and 53%) in both two seasons respectively and gardud site Vossia cuspidata considered dominant species for two rainy seasons (44% and 46%) respectively. [20] Reported that spatial and temporal variability of rainfall in dry lands results in a complex association between vegetation and soils, notably organic matter, nutrients and microbial activity. [21] Found that rainfall variability over 1 or 2 years could induce substantial changes in composition. In addition to rainfall, spatial variation between sites potentialities which was affected by topographic variation can influence species composition. [22] Reported that the availability of soil resources may act as an environmental filter, selectively determining the establishment of annual species according to their growth requirements.”
| Scientific name | Habit | Plants species composition% | |||||
|---|---|---|---|---|---|---|---|
| Clay | Sandy | Gardud | |||||
| Season 2013 |
Season 2014 |
Season 2013 |
Season 2014 |
Season 2013 |
Season 2014 |
||
| Schoenfeldia gracilis | Grass | 53 | 53 | 0.6 | 0.0 | 38.2 | 15 |
| Dactyloctenium aegyptium | Grass | 10 | 2.3 | 8.5 | 0.0 | 4 | 5 |
| Zornia glochidiata | Forbs | 2 | 6.7 | 27.3 | 75.4 | 0.2 | 16 |
| Solanum dubium | Forbs | 0.3 | 2.5 | 0.0 | 0.0 | 0.0 | 0.0 |
| Echinochloa colona | Grass | 8 | 2.9 | 24.6 | 5.3 | 5.1 | 3 |
| Chloris gayana | Grass | 2 | 15.4 | 0.2 | 0.0 | 0.6 | 7 |
| Ipomea spp | Forbs | 0.0 | 0.0 | 0.9 | 0.3 | 0.0 | 0.0 |
| Eragrostis spp | Grass | 16 | 13.9 | 22.2 | 9.1 | 2.3 | 5.3 |
| Sida cordofolia | Forbs | 0.0 | 0.4 | 1.2 | 1.8 | 0.0 | 0.0 |
| Pennisetum pedicellatum | Grass | 0.0 | 0.0 | 0.0 | 0.5 | 0.0 | 0.0 |
| Oldenlandia senegalensis | Forbs | 0.0 | 1.1 | 5.3 | 3 | 0.0 | 0.0 |
| Waltheria indica | Forbs | 00 | 0.7 | 0.0 | 0.2 | 0.0 | 0.0 |
| Aristida spp | Grass | 4 | 2 | 7 | 4 | 4 | 0.0 |
| Cenchrus biflorus | Grass | 0.0 | 0.0 | 0.0 | 1 | 0.2 | 0.0 |
| Alycicarpus vaginalis | Forbs | 0.0 | 0.2 | 0.0 | 0.2 | 0.0 | 0.0 |
| Fimbristylis dicotomo | Grass -Like | 0.0 | 0.0 | 0.0 | 0.6 | 0.2 | 0.0 |
| Vossia cuspidata | Grass | 0.0 | 0.0 | 0.0 | 0.0 | 44.3 | 45.6 |
| Digitaria gayana | Grass | 0.0 | 0.2 | 0.0 | 0.0 | 0.0 | 0.0 |
| Acanthospermum hispidum | Forbs | 0.0 | 0.0 | 0.0 | 0.2 | 0.0 | 0.0 |
| Senna obtusifolia | Forbs | 4 | 1.2 | 0.0 | 0.0 | 2.3 | 3.8 |
| Cenchrus ciliaris | Grass | 0.0 | 0.0 | 0.2 | 0.0 | 0.2 | 3.8 |
Table 6. Average relative plants species composition in the three range sites for the two seasons.
Plant frequency%
The sandy site dominated by Zornia glochidiata (91% and 88%) for the two rainy seasons, but this species not preferred by most animals in the area, this site needs to replace the less palatable species with other more palatable to avoid gathering animals at one site which could lead to overgrazing and causes rangelands deterioration.
(Table 7) showed the dominant species at the three sites for the two rainy seasons (2013/2014), sandy site dominated by Zornia glochidiata(91% and 88%), in the clay site the species Schoenfeldia gracilis (62% and 59%) considered dominant species and gardud site dominant by Vossia cuspidata (71% and 46%) for the two rainy seasons. Frequency of each species reduced in the second season, the species in sandy and clay sites their frequency reduced in the same percent 3% but the dominant species in the gardud site the frequency of it declined more than other species in the different sites, recorded 25%, that due to degree of preference of each species for livestock in the study area. Sandy and clay sites had 3% reduction compared to 25% at gardud. This due to the fact that species Vossia cuspidata is more palatable compared to species Zornia glochidiata and Schoenfeldia gracilis in the sandy and clay respectively.
| Sites | Species | Frequency% | |
|---|---|---|---|
| 2013 | 2014 | ||
| Sandy | Zornia glochidiata | 91 | 88 |
| Clay | Schoenfeldia gracilis | 62 | 59 |
| Gardud | Vossia cuspidata | 71 | 46 |
Table 7. Dominant species (in %) at the three sites for the two rainy
seasons (2013/2014) at the study area.
Trees and shrubs cover (overstory)
Tree and shrubs density
(Table 8) illustrates average of total trees and shrubs density/ha in the three sites for the two seasons. In clay site trees density was recorded (423tree/ha and 728tree/ha) respectively, in sand site trees density (425 tree/ha and 960 tree/ha), while gardud site was scored the lowest tress density for two seasons (229tree/ha and 382tree/ha), when compared with other. The variation of trees and shrubs density could be related with level of utilization, distance of sites from villages or camps of mobile pastoralists in the study area, topography, the species which occurs in the each site and palatability of them for the animals are different, and human activities such as deforestation, expansion of mechanized agriculture and cutting of trees for local utilization such as materials building and fuel wood also contribute of reduction trees and shrubs density. In general spatial distribution of the different woody species depends on precipitation, where very low precipitation or drought provoked an overall mortality of 30 to 50% of shrubs and trees
| Parameter | Sites | |||||
|---|---|---|---|---|---|---|
| Clay | Sandy | Gardud | ||||
| 2013 | 2014 | 2013 | 2014 | 2013 | 2014 | |
| Trees density/ha | 423 tree/ha | 728 tree/ha | 425 tree/ha | 960 tree/ha | 229 tree/ha | 382 tree/ha |
Table 8. Average total trees density/hectare in the three sites for the two seasons.
“The spatial distribution of the different woody species may be caused by spatial sites potentialities and variable species requirements.” [23] Stated that human activities and the natural variability of rainfall and climate change as the main causes of degradation. The removal of economically important trees and shrubs by people, usually for wood fuel and construction of houses is regarded as the first type of vegetation degradation and as the main factors responsible for the decrease and/or the disappearance of woody species [24]. Besides clearing for agricultural purposes, more than 548 million trees and shrubs were uprooted annually by mobile pastoralists and villagers and used as fuel or building materials. Heavy browsing can also affect woody species density. It affects populations of trees and shrubs negatively through increased decimate of trees and shrubs and decreased reproduction and recruitment [25].
Relative trees and shrubs density
(Tables 9, Tables 10) illustrates relative trees density in the three sites for the two seasons (2013-2014) respectively the results indicated that three sites dominated by different species in the two seasons respectively. Clay site was dominated by Acacia oerfota (131 and 446%) and sandy dominated with Guiera senegalensis for two seasons respectively (315 and 88.5%), while gardud was dominated by Acacia mellifera for two seasons respectively (133.5 and 90.5%). This variation of trees and shrubs density at the three sites for the two seasons may be due to different in soil topography, soil types, rainfall characterizing, and levels of utilization. In the three sites it’s obviously most species they are shrubs, this may be indicated that trees were faced over cutting by sedentary, for their local requirements: such as fuel wood, building material, cleaning lands to cultivation and feeding animals in dry seasons. Also mobile pastoralists utilize trees and shrubs, to feed their animals, particularly in dry season when the rainy season was failed to cover their needs of forage. That encourages mobile pastoralists to use trees and shrubs to prevent their livestock from malnutrition. Reported “That fuel wood comprises 84% of total wood use in Africa.”
| Sites | ||||
|---|---|---|---|---|
| Scientific name | Habit | |||
| Clay | Sandy | Gardud | ||
| Balanites aegyptiaca | Tree | 94 | 25.6 | - |
| Ziziphus - spina christi | Tree | 56 | - | - |
| Acacia oerfota | Shrub | 131 | - | 61 |
| Acacia mellifera | Shrub | 35 | - | 133 |
| Acacia nilotica | Tree | 42 | 14 | 6 |
| Acacia senegal | Tree | - | 10 | 6 |
| Combretum aculeatum | Shrub | 5 | - | 2 |
| Guiera senegalensis | Shrub | - | 315 | - |
| Piliostigma reticulatum | Shrub | - | 24 | - |
| Leptadonia pyrotechnica | Shrub | - | 4 | - |
| Albizzia amara | Tree | - | 6 | - |
| Acacia seyal | Tree | 30 | - | - |
| Tamarindus indica | Tree | 5 | - | - |
| Bauhinia rufiscence | Shrub | 14 | - | |
| Grewia tenax | Shrub | 5 | - | |
| Maerua crassifolia | Tree | 2 | - | 4 |
| Sclecarya birrea | Tree | - | 4 | |
| Ximenica nilotica | Shrub | - | - | 4 |
| Cadaba glandulosa | Shrub | - | - | 6 |
| Adenium spp | Shrub | - | - | 7 |
Table 9. Average relative trees and shrubs density in the three sites –
season 2013.
| Sites | ||||
|---|---|---|---|---|
| Scientific name | Habit | |||
| Clay | Sandy | Gardud | ||
| Balanites aegyptiaca | Tree | 100 | 11 | 10 |
| Ziziphus spina christi | Tree | 19 | - | - |
| Acacia oerfota | Shrub | 476 | - | 31 |
| Acacia mellifera | Shrub | 19 | - | 91 |
| Acacia nilotica | Tree | 34 | 11 | 21 |
| Acacia senegal | Tree | 8 | 11 | 25 |
| Comretum aculeatum | Shrub | 67 | - | 3 |
| Guiera senegalensis | Shrub | - | 889 | - |
| Piliostigma reticulatum | Shrub | - | 28 | - |
| Leptadonia pyrotechnica | Shrub | - | 14 | - |
| Albizzia amara | Tree | - | - | 10 |
Table 10. Average relative trees and shrubs density in the three
sites(2014).
The clay site was dominated by Acacia oerfota but this species don’t preferred by most animals particularly when it green, because has unpleasant smell for this reason animals avoid to browse on it. Stated by Acacia oerfota was dominated in clay (which is not preferred by animals in the area, due to its disagreeable smell). Is an indication of removal of other more preferred species due to excessive browsing on naturally regeneration tree species which, requires be addressing within range improvement practices, in terms of planting more preferred species and adapting to the sites.
Existence Plants species in the different sites (clay, sandy and gardud)
The two groups (pastoralists and sedentary communities) were investigated about plants species occurrences in the study area and also asked about species of trees and shrubs using for feeding livestock in the dry seasons. This information get from communities might be confirmed and support the data collected through vegetation cover measurements in the area.
According to mobile pastoralists feedback about plants species occurrence in three sites (clay, sandy and gardud) respectively 33% of them said Dactyloctenium aegyptium, 28% Chloris gayana, followed by19% Echicochloa colonom and other species illustrated in (Figure 2). In sandy site 33% of them said Zornia glochidiata, 28% Cenchrus spp, followed by 19% Eragrostis spp, other species mentioned in (Figure 3). While in gardud site the species were different such as Chloris preiurii (48%), Dactyloctenium aegyptium (12%), followed by Ipomea spp (9%) (Figure 4), this could be attributed variation in soil types, topography and level utilization.

Figure 2. Respondents according to existence of plants species in the clay site.

Figure 3. Respondents according to existence of plants species in sandy the site.

Figure 4. Respondents according to existence of plants species in the gardud site.
According to plants species occurrence around villages in the rainy season 47% said Eragrostis spp, 17% Zornia glochidiata, 15% Cenchrus spp and other species showed simple ratios mentioned in the (Figure 5).

Figure 5. Respondents according to existence of plants species around villages.
Using trees and shrubs for feeding animals during dry season
The respondents of mobile pastoralists were investigated about using trees and shrubs in summer season to cover the shortage of forage 64% used trees to feed their livestock in the dry season and shrubs 36% do not use them. Sedentary group also asked about trees using 53% of them using trees and shrubs to fill gap of forage shortage and 43% not prefer using trees to feed their livestock (Table 11). This could be the users of rangelands in the study area practiced browsing to feed their livestock in the dry periods, to protect the livestock until the rainfall fall down, this indicate that the grasses insufficient for animals feeding in the area, and both rangeland users consider trees and shrubs are main component of rangelands and depend on trees and shrubs cover in dry periods. The range improvement must include tress planting particularly (Acacia spp) to increase trees and shrubs density.
| Mobile pastoralists | Sedentary group | ||||
|---|---|---|---|---|---|
| Category | Frequency | Percent | Answer | Frequency | Percent |
| Used | 83 | 64 | 128 | 53 | |
| Do not used | 46 | 36 | Don’t used trees | 105 | 43 |
Table 11. Using of trees and shrubs for feeding livestock during dry season.
Species of trees and shrubs used to feed animals in dry season
(Figure 6) shows trees and shrubs species use to feed animals in the dry season among mobile pastoralists 64% of them said use Balanites aegyptiaca, 15% Guiera senegalensis and followed by other species illustrated in simple percentages. This could be attributed to kinds of animals which use browse trees are different and variation of utilization levels. According to species of trees used in summer season for feeding their livestock 47% used Combreatum hartmaninium, 25% Balanites aegyptiaca and followed some species in simple percentage illustrated in (Figure 7). This may be due to kinds of animals which are breeding by sedentary group were small ruminants such as goats and sheep, for this reason select shrubs to feeding is suitable and also sedentary group used shrubs and tree without cutting, while mobile pastoralists cut trees to feeding their livestock and that leads to deterioration of trees and shrubs cover in the area.

Figure 6. Percentage of trees and shrubs use for feeding livestock by mobile pastoralists.

Figure 7. Percentage of trees and shrubs use for feeding animals by sedentary group.
Conclusion and Recommendations
The study showed variations between the three sites as reflected in vegetation attributes measurements for both
Herbaceous and trees cover and socio-economic survey for the nomads and sedentary. Herbaceous measurements using plant composition, biomass and letter showed that the sandy site had the highest plant composition, lowest bare soil and lowest plant litters compared to the clay and gardud sites. However, the three sites recorded low plant cover, low biomass production and dominated by different plant species. Sandy site was dominated by unpalatable species: Zornia glochidiata and Guiera senegalensis, clay site was dominated by Schoenfeldia gracilis and Acacia oerfota and gardud site was dominated by Vossia cuspidata and Acacia mellifera. In addition, the nomads and sedentary respondents confirmed invasion of unpalatable species and disappearance of more palatable species such as Blepharis linariifolia and Andropogon gayanus. The dominant species indicating that the sandy site is deteriorating compared to clay and gardud sites. Most the nomads entering to sandy site early in June and majority of them exiting from gardud site in early in October and both respondents preferred sandy for practice grazing. Therefore the rangelands should consider variation of soil types in rangelands utilization and management process and to determine the time of entering and existing from rangelands. Nevertheless, seed broadcasting of more palatable species, should be done in the sandy site with proper measure to control the unpalatable species invasion. The plant cover in the clay site should be increased and gardud site needs to control the soil erosion, particularly water erosion.
References
- Parker KW, Harris RW. The 3-step method for measuring condition and trend of forest ranges: a resume of its history, development and use. In Techniques and methods of measuring understory vegetation. Proc. of a symposium at Tifton, Georgia. 1959.
- Barbour MG, Burk JH, Pitts WD. Terrestrial plant ecology. Benjamin Cummin. 1980:191-93.
- Holechek JL, Pieper RD, Herbel CH. Range management: principles and practices (No. Ed. 2). Prentice-Hall. 1995.
- Fadlalla B, Ahmed FA. Sudan country paper. Global Agenda for Livestock Research, Proceedings of a Consultation on Setting Livestock Research Priorities in West Asia and North Africa (WANA) Region. 1997: 12-16.
- Bashir M, El Tahir AA. "Pastoral Production Systems in South Kordofan (Study 2)." UNDP, Khartoum, Sudan. 2006.
- Nefzaoui A, Elloumi M, Nasr N. Rangeland management options and individual and community strategies of agro-pastoralists in Central and Southern Tunisia. In International Conference on policy and institutional options for the management of rangelands in dry areas. Workshop summary paper. CAPRi Working Paper. 2002.
- Howery LD, Sprinkle JE, Bowns JE. A summary of livestock grazing systems used on rangelands in the Western United States and Canada. 2000.
- Bennie J, Hill MO, Baxter R., et al. Influence of slope and aspect on long‐term vegetation change in British chalk grasslands. Journal of ecology. 2006;94(2):355-68.
- Marini L, Scotton M, Klimek S, et al. Effects of local factors on plant species richness and composition of Alpine meadows. Agriculture, Ecosystems & Environment. 2007;119(3-4):281-88.
- Cristofoli S, Monty A, Mahy G. Historical landscape structure affects plant species richness in wet heathlands with complex landscape dynamics. Landscape and Urban Planning. 2010;98(2):92-98.
- Reitalu T, Sykes MT, Johansson LJ, et al. Small-scale plant species richness and evenness in semi-natural grasslands respond differently to habitat fragmentation. Biological Conservation. 2009;142(4):899-908.
- Gong X, Brueck H, Giese KM, et al. Slope aspect has effects on productivity and species composition of hilly grassland in the Xilin River Basin, Inner Mongolia, China. Journal of arid environments. 2008;72(4):483-493.
- Musa AS. African green belt. Republic of Sudan. 2001.
- Daubenmire R. Plant communities. A textbook of plant synecology. Plant communities. A textbook of plant synecology. 1968.
- Bonham CD. Measurements for terrestrial vegetation. John Wiley & Sons. 2013.
- Cayrol P, Chehbouni A, Kergoat L, et al. Grassland modeling and monitoring with SPOT-4 VEGETATION instrument during the 1997–1999 SALSA experiment. Agricultural and Forest Meteorology. 2000;105(1-3):91-115.
- Loeser MR, Sisk TD, Crews TE. Impact of grazing intensity during drought in an Arizona grassland. Conservation Biology. 2007;21(1):87-97.
- Oztas T, Koc A, Comakli B. Changes in vegetation and soil properties along a slope on overgrazed and eroded rangelands. J Arid Environ. 2003;55(1):93-100.
- Connolly RD, Ciesiolka CAA, Silburn DM, et al. Distributed parameter hydrology model (Answers) applied to a range of catchment scales using rainfall simulator data. IV Evaluating pasture catchment hydrology. J Hydrol 1997;201(1-4):311-328.
- Bennett LT, Adams MA. Indices for characterising spatial variability of soil nitrogen semi-arid grasslands of northwestern Australia. Soil Biology and Biochemistry. 1999;31(5):735-46.
- O'Connor TG. Influence of rainfall and grazing on the compositional change of the herbaceous layer of a sandveld savanna. Afr J Range Forage Sci. 1991;8(3):103-109.
- Kutiel P, Noy-Meir I. The effects of soil depth on annual grasses in the Judean Hills. I: The effect of soil depth on individual plant species. Isr J Plant Sci. 1986;35(3-4):233-39.
- Reynolds JF, Smith DMS, Lambin EF, et al. Global desertification: building a science for dryland development. Science. 2007;316(5826):847-51.
- Macharia PN, Ekaya WN. The impact of rangeland condition and trend to the grazing resources of a semi-arid environment in Kenya. J Hum Ecol. 2005;17(2):143-47.
- Young TP, Augustine DJ. Interspecific variation in the reproductive response of Acacia species to protection from large mammalian herbivores. Biotropica. 2007;39(4):559-61.