Research Article - Environmental Risk Assessment and Remediation (2017) Volume 1, Issue 2
Impact of sewage on physico-chemical water quality of Tawi River in Jammu city.
Baba Uqab1*, Anita singh1, Syeed Mudasir2
1Department of Environmental Sciences, Central University of Jammu, Jammu, India
2Department of Environmental Sciences, University of Kashmir, India
- *Corresponding Author:
- Baba Uqab
Department of Environmental Sciences
Central University of Jammu
India
Tel: +919055180847
E-mail: uqabalibaba@gmail.com
Accepted date: May 27, 2017
Abstract
Pure water is on of the priceless, indispensable and primary drivers of public health. Drinking water quality is an issue of concern for human health in developing as well as in developed countries all over the world. Quality supply of drinking water to the public is very essential for health and welfare, whereas, deteriorated water quality poses a key risk to health and human well-being. Despite massive outlays for drinking water and sanitation in India, access to safe drinking water remains a challenge. Modernization has led to production of wastes which corrode our environment, and as the day go on development increases and leads to addition of more and more harmful products in our environment. Our water bodies suffer most, large amount of sewage water (waste-water) is being released from towns, urban and rural areas. River Tawi being one of the important river in Jammu and Kashmir has been degraded in recent years which has serious impact on the water availability especially in Jammu city. Water samples were analysed for various physical and chemical parameters. It was found that the various input sights of sewage that enters into River Tawi badly effect the quality of water and make it unfit for domestic use. The overall study shows that sewage intrusion from Gujar Nagar to Prem Nagar affects the quality of the river water and raises values of certain parameters like pH, DO, EC, temperature, etc.
Keywords
Water, life, living beings, samples sanitation, drinking, fresh water, impacts, temperature.
Introduction
Drinking water, in adequate quantity and safe quality, is a vital requirement for life and a determinant of standard of living. Poor or no access to safe water supply can result in many diseases including diarrhea1, fluorosis, cholera, hepatitis. These diseases potentially constrain human resource development and productivity, especially of the poor. The National Water Policy 2002 reflects the significance attached to drinking water by stating, “adequate safe drinking water facilities should be provided to the entire population both in urban and rural areas. Irrigation and multipurpose projects should invariably include a drinking water component, wherever there is no alternative source of drinking water. Drinking water needs of human beings and animals should be the first charge on any available water”. However, around 22 per cent of households in India lack access to safe drinking water sources, like tap, hand pump and tube well (Census 2001). Hence, significant efforts are being made by the central and state governments for increasing the coverage of households with adequate and safe drinking water supply, along with sanitation services, which coincide with the Millennium Development Goals (UNDP 2003). Prevention of river pollution requires monitoring of physico-chemical parameters. So, physico-chemical parameters were taken for analysis of water quality of river Tawi.
Material and Methodology
Water samples from the sites were collected and taken to lab for physico-chemical analysis. Dissolved oxygen, ph, and water temperature was done on site. The methods were followed as per standards laid by APHA [1].
Study Area
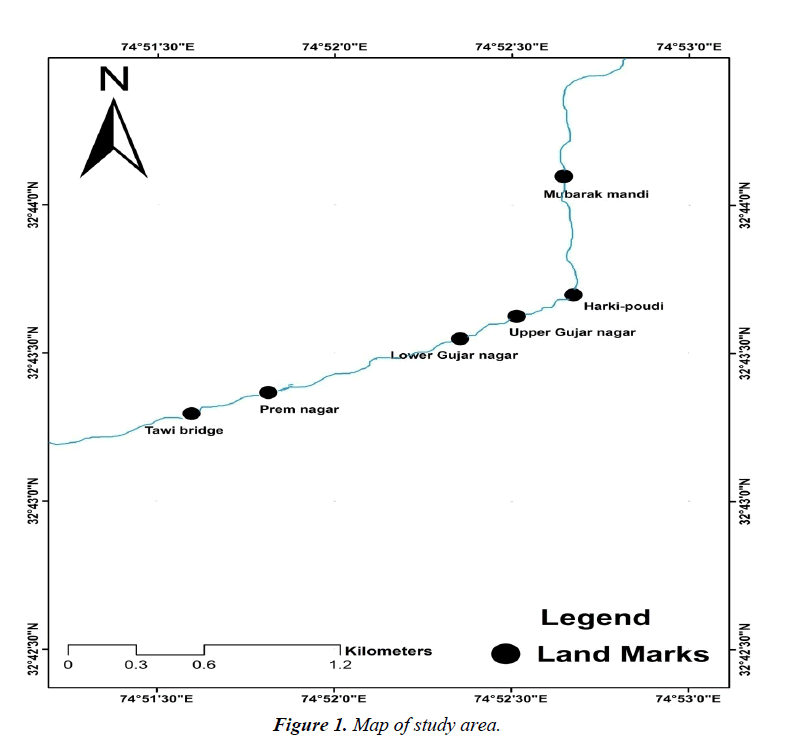
Tawi river originates from the lapse of Kali Kundi glacier and adjoining area southwest of Bhadarwah in Doda District. Its catchment is delineated by latitude 32°35'-33°5'N and longitude 74°35'-75°45'E (Table 1). The catchment area of the river up to Indian border (Jammu) is 2168 km² and falls in the districts of Jammu, Udhampur and a small part of Doda. Elevation in the catchment varies between 400 and 4000 m (Figure 1).
| Site | Latitude | Longitude |
|---|---|---|
| Mubarak mandi | 32°44'5.16"N | 74°52'39.61"E |
| Harki-poudi | 32°43'41.21"N | 74°52'41.24"E |
| Uppergujar nagar | 32°43'36.85"N | 74°52'31.64"E |
| Lowergujar nagar | 32°43'32.31"N | 74°52'22.06"E |
| Prem nagar | 32°43'21.37"N | 74°51'49.60"E |
| Tawi bridge | 32°43'17.15"N | 74°51'36.54"E |
Table 1: Geographicalcoordinates of the sites.
Physicochemical Analysis
Analysis was carried out for various water quality parameters such as pH, Electrical conductivity (EC), Dissolved oxygen (DO), Total alkalinity (TA), Total hardness (TH), Calcium hardness, Magnesium hardness, Chloride (Cl?), Nitrate, Sulphate, Ortho Phosphate and TDS using standard methods laid down by APHA 1998 [1].
Result and Discussion
In the present study water samples were collected from the various stations of river Tawi for analysing the physicochemical analysis of water and to study the impact of waste water on the quality of water.
Water samples were analysed for various physical parameters like pH, temperature, turbidity, conductivity and total dissolved solids and chemical parameters like DO, Sulphates, Chlorides, Total hardness, Calcium hardness, Magnesium hardness, Total alkalinity, Carbonate alkalinity, Bicarbonate alkalinity, Acidity and Nitrates.
Water and air temperature
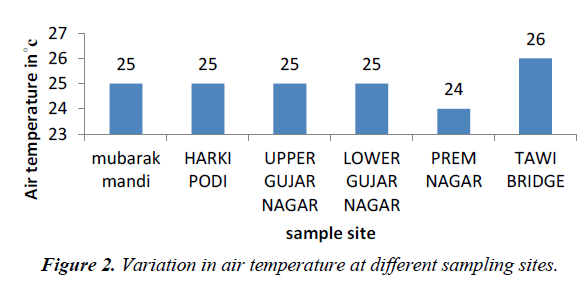
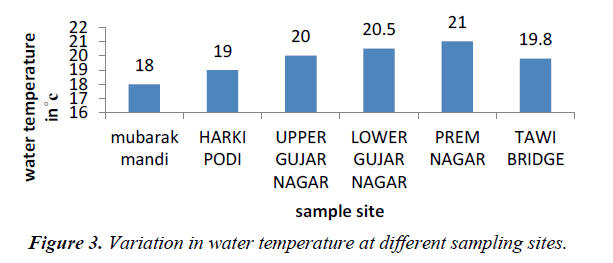
Temperature of water is basically important because it effects bio-chemical reactions in aquatic organisms. The average temperature of the water in the present study ranged from 18 to 21oC and that of air range from 24-26oC (Figures 2 and 3).
Electrical conductivity
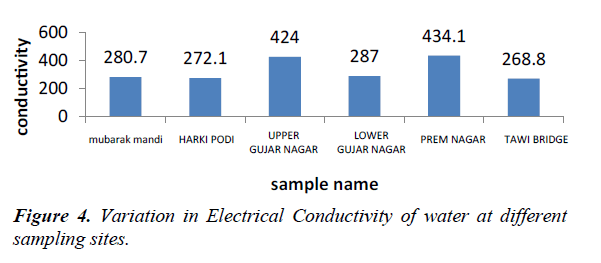
Electrical conductivity is a measure of water capability to transmit electric current and also it is a tool to assess the purity of water. Its value depends on the concentration and degree of dissociation of the ions as well as the temperature and migration velocity of the ions in the electric field. Thus, as concentration of dissolved salts increases conductivity also increases. It depends upon the presence of ions, their total concentration, mobility, valence and temperature. EC of our water sample range from 272.1- 434.1 ms-1 (Figure 4).
Total dissolved solids
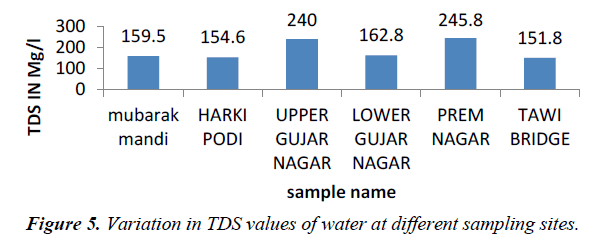
TDS originate from dissolution or weathering of the rocks and soil, including dissolution of lime, gypsum and other slowly dissolved soil minerals. Dissolved mineral gases and organic constituents may produce aesthetically displeasing color, taste and odour (Figure 5). According to WHO and Indian standard, T.D.S. value should be less than 500 mg/L for drinking water which can be extended up to 1500 mg/l in case of non-availability of any other alternate source, and value of TDS in our water sample range from 151.8-245.8 mg/l. TDS concentration in water vary considerably in different geological regions owing to differences in solubility in minerals (WHO, 2006).
Turbidity
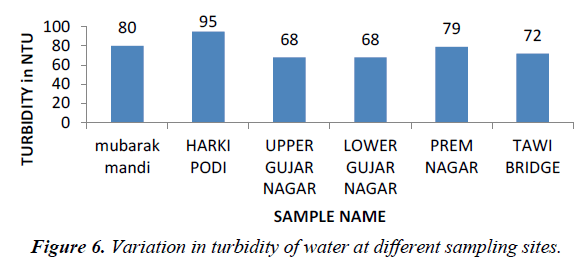
Turbidity is the cloudiness of a fluid caused by individual particles that are generally invisible to the naked eyes. The measurement of turbidity is key test of water quality. Turbidity measures of light on the suspended particles in waters using nephlometric turbidity unit (NTU) and 5 NTU is usually acceptable for drinking (WHO, 2006). In surface waters, the turbidity depends on the type of steam bed, velocity of waters, channel depth, type of bank and shape of channel [2]. In the present study the turbidity value ranges between 72-95 (Figure 6).
Dissolved oxygen
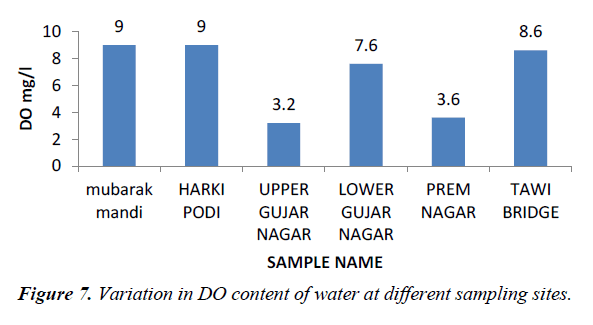
Dissolved oxygen is an important water quality parameter in assessing water pollution. Oxygen is fixed in water either due to the direct dissolution from the atmosphere or a result of primary production (Figure 7). Dissolved oxygen of our water samples ranges between 3.2-9.0.
Total hardness (TH), calcium hardness and magnesium hardness
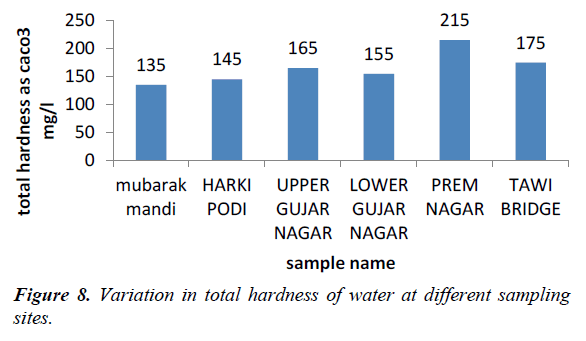
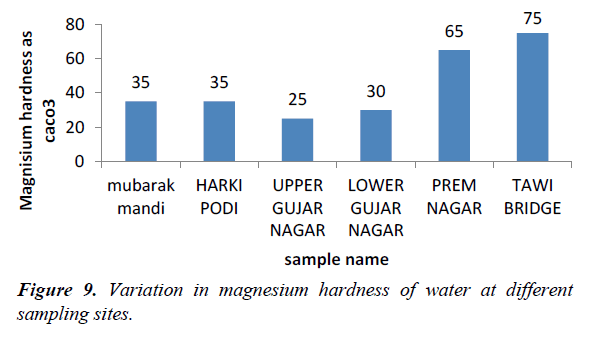
Hardness is an important parameter in decreasing the toxic effect of poisonous element. The hardness of our water samples was found to be in the range of 135-215 mg/l (Figures 8 and 9). The acceptable limit of total hardness (as CaCO32-) is 200 mg/l (as CaCO32-) which can be extended UPTO 600 mg/l (as CaCO32-).
Calcium hardness
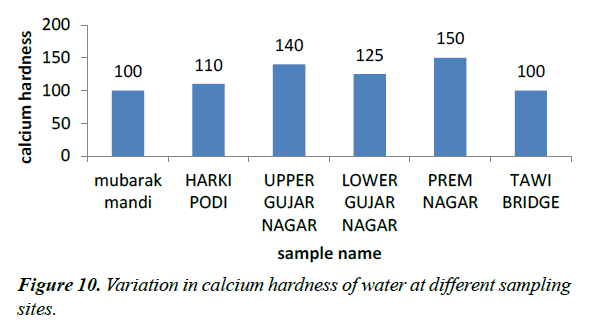
The calcium hardness values of our sample vary from 100-150 mg/l. The 100 mg/l was obtained from site I while as 150 was obtained from site V (Figure 10).
Total alkalinity as CaCO3 2-(TA), carbonate (CO3 2-), and bicarbonate (HCO3 -), alkalinity
Alkalinity is a measure of the ability of water to neutralize acid. The constituent of alkalinity in natural system include mainly CO3 2-, HCO-3 , and OH? and other constituent which may contribute to alkalinity are H2BO
In the present study CO3 2- and HCO3- are discussed with total alkalinity because they are the main component of alkalinity. Carbonate is absent in all the samples we collected and analysed, so alkalinity of our water samples is only because of bicarbonate.
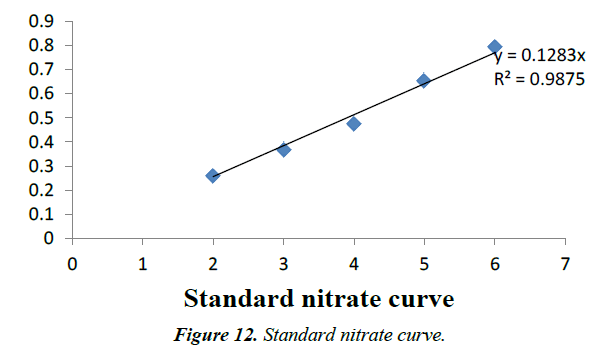
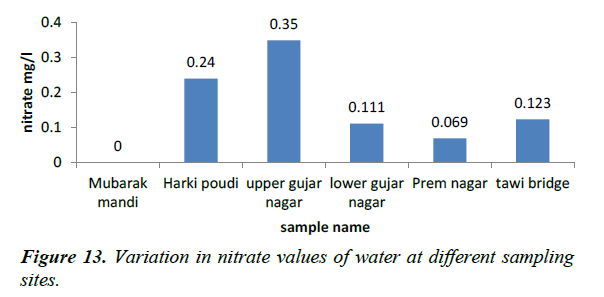
Nitrate concentration is responsible for several diseases as hypertension, cancer and birth defect. Presence of nitrate in concentration is greater than (5 ppm), reflecting unsanitary conditions in surface waters range between (0-18 ppm) and not exceed (5 ppm) in unpolluted waters (Figures 12 and 13). In the present study water samples from different sampling stations showed nitrate concentration between 0 and 0.35 mg/l. These are the permissible level as per the drinking water standard.
Sulphate
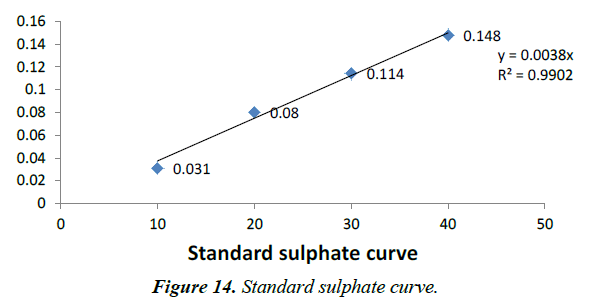
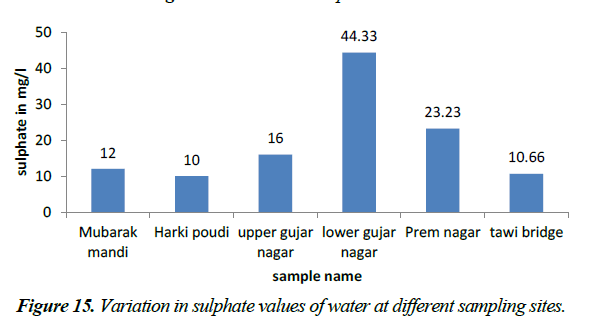
Sulphate ion does not affect the taste of water, if present in low concentrations. It is naturally occurring anion found among all kinds of water bodies. It may undergo transformation to sulphur and then sulphur oxide depending upon the redox potential of water. Sulphate cannot readily be removed from drinking water, except by expensive process such as distillation, reverse osmosis or electrodialysis. The sulphate ion concentration in the present investigation varied from 10-44.33 mg/l which indicates that sulphate level in the upper gujar nagar area is above concentration recommended but WHO 2006 for the surface waters, also the concentration level on other sites of study are in the permissible level (Figures 14 and 15).
Chloride
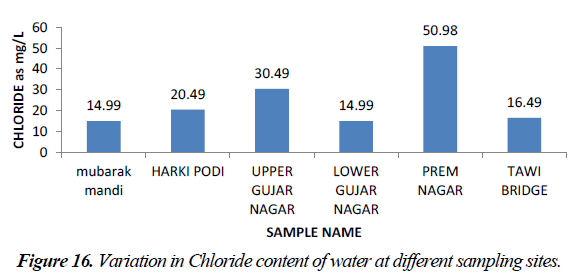
Chloride occurs in all types of natural waters. People who do not have high chloride content in water are subjective to laxative effect. Excess of chloride in inland water is usually taken as index of pollution. The acceptable limit of chloride is 250 mg/l and in Indian conditions maximum permissible limit of chloride in potable water is 1000 mg/l. Chloride values obtained in the study are found in the range between 14.99-50.98 mg/l. So, in all water samples of railway station chloride is within acceptable limit (Figure 16).
Discussion
Sewage generated from various sources that has impact on the water quality of river Tawi. The sewage input is mainly from upper gujar nagar to prem nagar but there is high input of sewage in the gujar nagar area.
Temperature is having a direct impact on water as well as sewage water [3]. Air temperature was minimum at prem nagar and maximum at Tawi bridge, which indicates the climatic reflection of river Tawi, high temperature at Tawi bridge while as low temperature at prem nagar. Water temperature represents an important factor, which impacts the acceptability of a number of inorganic constituents and chemical contaminants (WHO, 2006)
Water temperature was low at Mubarak mandi and high near prem nagar because of input of sewage from various sources. The high temperature recorded from water samples may result from discharge of sewage water directly from outlet points.
Hydrogen ion concentration (pH) is used as an indicator for acidity in water. pH values recorded from water samples shows that pH of water was slightly acidic at all sites while as pH was neutral at Tawi bridge. It was also recorded that input of sewage has impact on the pH of the water.
Increase in levels of electrical conductivity and cations and input of sewage water may be the result of decomposition and mineralisation of organic materials [4]. Electrical conductivity is increasing at site III, IV due to the influence of sewage water coming out from hotels coming out from kitchens, bathrooms and washrooms [5].
Higher concentrations of total dissolved solids (TDS) in all sewage water may be attributed to higher concentrations of carbonates, bicarbonates, chlorides, sulphates, phosphates, nitrates, nitrogen and calcium [6]. Higher TDS values recorded were at site V.
Lower values of dissolved oxygen recorded at the study site III and study site V may be due to the organic matter in sewage, which lead to the rapid decrease in this oxygen availability [7]. Ahipathy and Puttaiah et al. [2], reported that lower values of dissolved oxygen may be due bioaccumulation, biomagnification and active utilization in bacterial decomposition of organic matter. A higher value of dissolved oxygen at site I, II, indicates good aeration conditions and absence of chemicals capable of consuming the dissolved oxygen [7].
Higher concentration of chloride in water samples at site V at prem nagar may result from the higher usage of washing agents like detergents, soaps and faecal matter [8]. The concentration of chloride in water samples was higher than the recommended values of 50 ppm for sewage water.
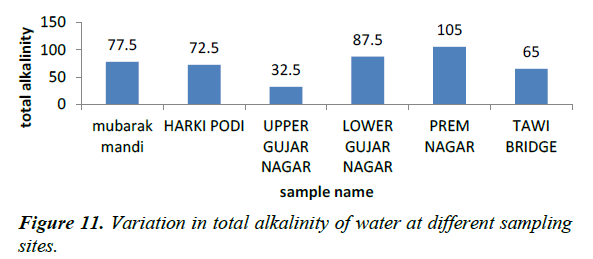
Alkalinity of water is due to the presence of bicarbonates of calcium and magnesium [9]. The higher alkalinity values of sewage water samples at site V may be due to high concentrations of bicarbonates and non-carbonates including hydroxides, silicate, borate and organic ligands [10].
Hardness of water is equivalent to concentration of total inorganic salts which are able to precipitate when it is heated and it negatively affects the solubility of soaps in water [11] high values of total hardness in water was at site V which is caused by dissolved calcium, to lesser extent by magnesium, which is as equivalent quantity of carbonates (WHO, 2006).
Higher levels of magnesium in sewage water samples at site V, may be due to discharge of domestic waste waters which contain higher amounts of magnesium which contain high amounts of magnesium. The calcium level was high at site V.
Nitrate is highly oxidized form of nitrogen compound and is commonly present in surface and ground waters. Since it is final product of aerobic decomposition of organic nitrogenous matter [9]. Unpolluted natural waters usually contain only minute amount of nitrate. In surface waters, nitrate is a nutrient taken up by plants and assimilated into cell protein. Nitrate concentration in surface and ground waters is usually low but can reach high levels as a result of leeching or runoff from the agricultural fields or contamination from human or animal wastes as a consequence of the oxidation of ammonia and similar sources (WHO, 2006). Nitrate concentration is responsible for several diseases as hypertension, cancer and birth defect. Presence of nitrate in concentration is greater than (5 ppm), reflecting unsanitary conditions [12]. In surface waters range between (0-18 ppm) and not exceed (5 ppm) in unpolluted waters [13]. Nitrate concentration of the sampling sites is within the permissible limit. Sulphate is an abundant ion in the earth’s crust and its concentration in water can range from few milligrams to thousand milligrams per litre [9].
Sulphate occurs naturally in minerals and are used commercially and principally in the chemical industry. They are discharged into water in industrial wastes and through atmospheric deposition; however the highest level usually occur in ground waters (WHO, 2006). Concentration of sulphate in waters range from (3.7 ppm) in surface waters to (30 ppm). The sulphate ion concentration in the present investigation varied from 10-44.33 mg/l which indicates that sulphate level in the upper gujar nagar area is above concentration recommended but WHO 2006 for the surface waters, also the concentration level on other sites of study are in the permissible levels [14,15].
Conclusion
Hydrogen concentration of water is slightly acidic at almost all sites. Water samples showed high Electrical Conductivity values, which indicate high salinity at all sites. Alkalinity in the sewage water was within standard and permissible limits. Concentration of Calcium and Magnesium do not exceed the recommended and standard values. Low dissolved oxygen concentration was recorded in sewage water samples, as a result of organic matter at most of the sites. The most effected site in our study area is prem nagar area the reason for that is input of high level of sewage from hotels residential areas. Raised values of certain parameters like ph, DO, EC indicate that pollution intrusion to river Tawi. The overall study of the river Tawi shows that the sewage intrusion from gujar najar area and the prem nagar area effects the quality of water of river Tawi. To protect this water ecosystem, there should be proper management and planning of deposition of municipal sewage and domestic sewage for health, hygiene and sustainable environment.
References
- APHA. Standards methods for the examination of water, Sewage and Wastewater 20th Ed., Washington DC, American public health association.1998.
- Ahipathy MV, Puttaiah ET. Ecological characteristics of Vrisha Bhavathy River in Bangalore, India. Environ Goyal. Pollution Research. 2006; 49: 1217-22.
- Zutshi N. Effect of Jammu City Sewage water on abiotic and biotic factors of the river Tawi, Jammu. Ph.D. Thesis, University of Jammu, Jammu. 1992.
- Abida, Harikrishna. Study on the quality of water in some streams of Cauvery River. Journal of Chemistry. Pollution Research. 2008; 5(2): 377-84.
- Bhat SA and Pandit AK. Impact of effluents from Sheri-Kashmir institute of medical sciences (SKIMS), soura on Anchar Lake. Journal of Research anddevelopment. Pollution Research. 2001; 1: 30-37.
- Kannan N, Karthikeyan G, Vallinayagam P, Mil SN. A study on assessment of pollution load of sugar industrial effluent. 2004; 24(11): 8.
- Gray L. Changes in water quality and macro invertebrate communities resulting from urban storm flows in the Provo river, Utah, USA. Hydrobiologia. 2004; 518: 33-49.
- Sawhney N. Ph.D. Thesis, University of Jammu, Jammu. 2008.
- Bartram J, Balance R. Water quality monitoring. A practical guide to the design and implementation of fresh water quality studies and monitoring programs. UNEP/WHO, Chapman and Hall, Pollution Research. 1996; 383.
- Hem JD. Study and interpretation of the Chemical Characteristics of natural water. USGS water supply paper. 1985; 2: 254-63.
- Elhatip H, Gullu O. Influence of wastewater Discharges on the water Quality of Mamasin Dam watershed in Aksaray, Central Anatolian part of Turkey. Environmental Geology. 2005; 48: 829-34.
- Patil D. Physico-chemical characteristics of Ground Water of Armiori Town of Gadchiroli District, (M.S.) India. Pollution Research. 2001; 20(2): 207-09.
- Longe EO, Ogundipe AO. Assessment of wastewater discharge impact from a sewage treatment plant on lagoon water, Lagos, Nigeria, research. Journal of Applied Science, Engineering and Technology.2010; 2(3): 274-82.
- Bheshdadia BM, Chauhan MB, Patel PK. Physico-Chemical Analysis of Underground Drinking Water in Morbi-Malia Territory. Poll Res. 2012; 7(1): 169-73.
- Fall C, Hinojosa AP, Jimenez MCL. Wastewater discharge impact on an important river of the Lerma-Chapala watershed, Mexico WIT Transactions on ecology and the environment. Pollution Research. 2006; 95.
