Research Article - Journal of Finance and Marketing (2018) Volume 2, Issue 4
Financial leverage and asset growth: Evidence from non-financial firms in Nigeria.
Kenn-Ndubuisi, Juliet Ifechi*, Onyema JIRivers State University, Port Harcourt, Nigeria
- Corresponding Author:
- Juliet Ifechi
Rivers State University, Port Harcourt
Nigeria
Tel: +2348065265363
E-mail: kenndubuisijuliet@gmail.com
Accepted date: November 15, 2018
Citation: Ndubuisi K, Ifechi J, Onyema JI. Financial leverage and asset growth: Evidence from non-financial firms in Nigeria. J Fin Mark. 2018;2(4):10-15.
DOI: 10.35841/finance-marketing.2.4.10-15
Visit for more related articles at Journal of Finance and MarketingAbstract
This study analysed the relationship between financial leverage and asset growth of 80 nonfinancial firms quoted on the Nigerian Stock Exchange over the period of 2000 to 2015. Financial leverage measures used include the total debt to capital ratio, debt to equity ratio, cost of debt, debt to asset ratio and long term debt to capital ratios. The panel regression analysis model which includes the pooled regression model, fixed effect model and the random effect model was used for data analysis with the Hausman Test for appropriate model choice. The result states that there is a significant relationship with all the financial leverage variables except the cost of debt. Asset growth also shows a significant negative relationship with all the control variables such as the interest rate, inflation rate and exchange rates. We therefore recommend that quoted firms should employ financial leverage in such a way that the cost of debt does not outweigh its benefits as proposed by the trade off theory and also that financial decisions should be made in consonance with the prevailing inflation, interest and exchange rates by the management of quoted firms in Nigeria.
Keywords
Financial leverage, Asset growth.
Introduction
Asset is generally defined as anything of value that is owned by an entity, that is capable of generating income. Growth in a company’s asset is necessary for its survival in a competitive and changing market environment and also used to increase its economic returns. The purchase of heavy asset requires a large investment in capital which can compel companies to source for additional finance externally.
External source of financing such as debt is key in the acceleration of the growth of a company’s asset as it allows the firm to leverage on its existing fund towards achieving its growth targets. It also allows for rapid expansion, immediate cash inflows, reduction of risk and economies of scale. Hence, a firm’s growth is a key factor in increasing profits, decreasing risk and achieving stability (Hampton, 1993) [1-5].
The ability of a firm to utilize debt is referred to as financial leverage which span out from the debate of the optimal capital structure and has been a topic for debate in finance for several decades. The importance of leverage in the capital structure of a company is that its efficient use reduces the weighted average cost of capital (WACC) of a company thereby lowering the cost of capital which in turn causes an increase in the net economic returns of the firm.
A number of theories have been proposed to explain the variations in debt ratios across firms. The important reference theory originated from the path breaking contribution of Modigliani and Miller (famous for their irrelevance theory in 1958) [6-8]. They are of the opinion that in a perfect capital market, the valuation of a firm is irrelevant to its capital structure, whether it is highly levered or has a lower debt component in its financing mix. Instead, leverage merely changes the allocation of cash flows between debt and equity without altering the total cash flows of the firm but in a real world, capital markets are not perfect.
Since then, other theories and research works have been developed and they include the pecking order theory as introduced by Donaldson (1961) which advocates a specific pattern of financing [9,10], first by internal funds then externally by debt capital and lastly by equity capital. The static trade-off theory contrary to the pecking order which states the existence of an optimal capital structure which is obtained where the net tax advantage of debt financing balances leverage related costs such as financial distress and bankruptcy, holding firm’s assets and investment decisions constant (Baxter, 1967; Altman, 1984) [11] signifying a cost – benefit tradeoff between costs and benefits associated with leverage. The total value of a levered firm equals the value of the firm without leverage plus the present value of the tax savings from the debt less the present value of the financial distress.
Empirical studies also show mixed results have in terms of statistical relationship. Mutai [9] found a positive but insignificant relationship [12] between financial leverage and asset growth of firms. Sarchah & Hajiha [13] found sales growth and profit growth to have significant negative effect while asset growth had a positive significant effect on leverage. Yasemi et al. [14-17] found no significant relationship between asset growth, sales growth, profit growth and financial leverage.
This study has become important since financial leverage increases fixed financial cost of firms and thus their financial risk especially for a country like Nigeria that has experienced high corporate bankruptcy and takeover due to debt financing in recent times. Therefore, this study tends to fill this gap in knowledge by investigating the effect of financial leverage on asset growth using secondary data from eighty non- financial companies registered under the Nigerian Stock Exchange from 2000 - 2015. Information relating to financial leverage and firm growth were obtained from the firms audited annual reports of the companies, the Nigerian stock exchange fact book, central bank of Nigeria statistical bulletin and the IMF international financial statistics and data file.
The main purpose of this study is to analyse the effects of financial leverage on the asset growth of quoted non-financial firms in Nigeria by testing the significance of the relationship between asset growth and the long term debt to capital ratio, total debt to capital ratio, debt to asset ratio, cost of debt and debt to equity ratio in Nigeria respectively.
Researchers have studied financial leverage and asset growth in different environments. The following ones were very interesting and useful for our research:
Sajid, Mahmood & Sabir [12] examined the impact of financial leverage on the investment decisions of the listed companies in KSE-30 Index of Pakistan using the descriptive statistics, correlation analysis and pooled ordinary least square regression model for the analysis of 30 (financial & non-financial) companies of Pakistan. It discovered that the financial leverage has a negative and significant impact on the investment decisions.
Yasemi et al. [17] carried out a study on the relationship between financial leverage (total debt to total asset) firm growth (asset growth, profit growth and sales growth) and financial strength in Iran using regression analysis of 40 firms listed on the Tehran stock exchange from 2002-2009. The regression result showed that there is no significant relation between financial leverage and firm growth indicating that employing financial leverage in investment structure have no influence on the firm’s growth, there was seen a significant negative relation between financial leverage and strength.
Mutai [9] studied the relationship between financial leverage and asset growth of 36 firms listed at the Nairobi Securities Exchange for the period 2009 to 2013. The regression and correlation analysis indicate a positive but insignificant relationship between financial leverage and asset growth of firms listed in Nairobi Security Exchange.
Sarchah and Hajiha [13] examined the effect of company growth indices on leverage ratios of the companies listed in Tehran Stock Exchange in Iran from 2002-2011 by using Chow and Hausman tests. The study revealed that sales and profit growth had negatively significant effect and asset growth had positively significant effect on leverage ratios, it means that by improving the profit growth indices, leverage ratios and company risk are reduced but the increase of asset growth increased the leverage ratio.
Zhao and Wijewardana [18] in their study examined relationship between Financial Leverage (FL), asset growth (AG) and Financial Strength (FS) in the listed Sri Lankan companies from 2000 to 2009. The result of the study finds Financial Leverage in the Sri Lankan context to be positively related to the growth and financial strength.
This study will be exploring deeper by introducing additional variables for measuring financial leverage, they include the long-term debt to capital ratio, total debt to capital ratio, total debt to Asset ratio, cost of debt and debt to equity ratio and also the inclusion of the inflation rate, interest rate and exchange rate variables in Nigeria.
Methodology
Research variable and measurement
Model specification: Because the study involves longitudinal/ panel data, the study will adopt a panel regression analysis model (Tables 1 and 2). The three major panel regression models that will be examined include:
| Financial leverage (FIN LEV) | LTDCR (Long term debt to capital ratio) | 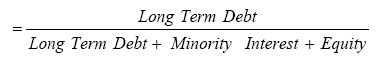 |
| TDCR (Total debt to capital ratio) | 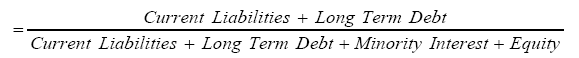 |
|
| DER (Debt to equity ratio). | 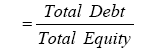 |
|
| COD (Cost of Debt) | 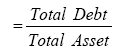 |
|
| Total debt to total asset ratio |  |
|
| Growth (Asset growth) | AG (Asset growth) | 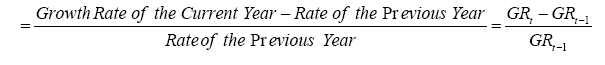 |
| Control variables | INFR (Inflation rate) | |
| INTR (Interest rate) | ||
| EXR (Exchange rate) |
Source: Researcher
Table 1: Research variable and measurement.
| Model Method | |||
|---|---|---|---|
| Variable | Pooled Regression Model | Fixed Effect Model | Random Effect Model |
| Constant (C) | 7.7684** | 7.760541*** | 7.7679*** |
| -0.0372 | -0.0037 | -0.0038 | |
| Long term debt to capital ratio (X1) | 0.0031 | -0.0161*** | 0.0022*** |
| -0.0981 | -0.009 | -0.0098 | |
| Total debt to capital ratio (X2) | 0.1839** | 0.3468** | 0.1926** |
| -0.0387 | -0.0391 | -0.0382 | |
| Debt to equity ratio (X3) | -0.9354** | -0.7965* | -0.9280** |
| -0.0376 | -0.0459 | -0.038 | |
| Cost of Debt (X4) | 0.1921 | 0.1981 | 0.1924 |
| -0.0892 | -0.0891 | -0.0892 | |
| Debt to Total Asset (X5) | 3.0561** | 3.1020** | 3.0586** |
| -0.0361 | -0.0354 | -0.036 | |
| EPS/ROE = DFL (X6) | 0.0122* | 0.0122* | 0.0122** |
| -0.0467 | -0.0473 | -0.0458 | |
| Inflation Rate (Z1) | -0.0519* | -0.0520* | -0.0519*** |
| -0.0481 | -0.0048 | -0.0048 | |
| Interest Rate (Z2) | -0.0931* | -0.0931* | -0.0931** |
| -0.0434 | -0.0433 | -0.0434 | |
| Exchange Rate (Z3) | -0.0485* | -0.0484* | -0.0485* |
| -0.0515 | -0.052 | -0.0519 | |
| R2-Adjusted | 60.3 | 66.2 | 61.8 |
| F-value | 8.83** | 9.85** | 8.77** |
| Durbin-Watson (D.W) | 1.32 | 1.41 | 1.33 |
| ( )- P-value, | |||
| *- significant at 10% | |||
| **- significant at 5% Hausman | |||
| ***- significant at 1% | |||
| Test p-value= 0.1978 | |||
| Source: Research findings from Strata version 11 | |||
Table 2: Panel data regression analysis of growth variable (asset growth) on financial leverages.
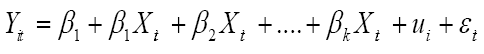
Pooled regression model
The model involves pooling all the variables over time and is given by:

Fixed effect model
The explanatory variables are fixed, and the intercept varies from one company to another. It is given by:

Where the intercept could be represented thus:

Random effect model
This is also known as error correction model. Here the dummy variables in equation 2a are expressed through error term or disturbance.

Where,

Therefore equation (3a) becomes:

i = 1, 2,...,k
t = 1, 2,…,T
Where,
Xit = Response variables (here growth variables for ith company on tth year)
Xit = explanatory variables (here financial leverage and control variables for ith company and tth year).
εit = Regression coefficients for kth variable.
Di = Dummy variables
εit = error term
Discussion and Results
From the above Graph 1 the asset growth maintained constant fluctuation from year to year but experienced a downward slope in 2015.

Graph 1: Graphical representation of asset growth from 2000-15.
Panel data regression analysis
Findings from the descriptive statistics: Table 3 is the result of the descriptive statistic (Mean and Standard Deviation of all the variables under consideration (Asset growth, long term debt to capital ratio, total debt to capitalization ratio, debt to equity ratio, cost of debt, total debt to total asset, degree of financial leverage, inflation rate, interest rate, exchange rate) over the 80 companies for each year under review. Here again except the rate variables (Inflation rate, interest rate, exchange rate) which is not specific for any company, the standard deviation values for all the variables are greater than the mean, indicating a large discrepancy in the mean of the variables for the 80 companies under review. This suggests a wide gap in the values of the variables under consideration within the years under review.
| Year | Statistic | Y1 | Y2 | Y3 | Y4 | Y5 | Y6 | Z1 | Z2 | Z3 | X |
| 2000 | Mean | 1.27 | 0.16 | 0.11 | 0.06 | -0.15 | -7.92 | 101.7 | -10.3 | 35.23 | -1.93 |
| S.D | 2.55 | 0.68 | 1.14 | 0.32 | 0.21 | 56.92 | 0 | 0 | 0 | 12.52 | |
| 2001 | Mean | 1.29 | 0.11 | 0.05 | 0.02 | 0.05 | -0.63 | 111.23 | 23.84 | -0.32 | -0.38 |
| S.D | 11.07 | 0.45 | 0.26 | 0.28 | 0.15 | 12.59 | 0 | 0 | 0 | 4.69 | |
| 2002 | Mean | 0.98 | 0.06 | 0.07 | 0.08 | 0.01 | 1.74 | 120.58 | -10.8 | 39.9 | -0.2 |
| S.D | 8.51 | 0.31 | 0.37 | 0.36 | 0.18 | 7.53 | 0 | 0 | 0 | 4.05 | |
| 2003 | Mean | 0.25 | 0.05 | 0.1 | -0.01 | 0.05 | -0.62 | 129.22 | 8.61 | 11.14 | -0.96 |
| S.D | 1.07 | 0.36 | 0.52 | 0.3 | 0.19 | 10.53 | 0 | 0 | 0 | 5.54 | |
| 2004 | Mean | 0.12 | 0.08 | 0.15 | 0.05 | 0.01 | -0.05 | 132.89 | 19.37 | -0.16 | -0.06 |
| S.D | 0.62 | 0.44 | 0.54 | 0.29 | 0.15 | 14.72 | 0 | 0 | 0 | 4.99 | |
| 2005 | Mean | 0.21 | 0.12 | 0.07 | 0.01 | 0.04 | 0.45 | 131.27 | -3.34 | 22.02 | 0.99 |
| S.D | 0.71 | 0.48 | 0.36 | 0.26 | 0.16 | 5.88 | 0 | 0 | 0 | 7.78 | |
| 2006 | Mean | 0.06 | 0.01 | 0.11 | 0.05 | 0.04 | 11.05 | 128.65 | -0.37 | 17.34 | 1.16 |
| S.D | 0.93 | 0.32 | 0.45 | 0.24 | 0.17 | 78.77 | 0 | 0 | 0 | 22.12 | |
| 2007 | Mean | 0.11 | 0 | 0.05 | 0.08 | 0.02 | 1.99 | 125.81 | 11.61 | 4.77 | -0.68 |
| S.D | 0.6 | 0.43 | 0.42 | 0.31 | 0.21 | 42.53 | 0 | 0 | 0 | 5.08 | |
| 2008 | Mean | 0.17 | 0.15 | -0.01 | -0.01 | 0.03 | 1.35 | 118.55 | 4.19 | 10.84 | 1.15 |
| S.D | 0.76 | 0.42 | 0.36 | 0.28 | 0.16 | 13.18 | 0 | 0 | 0 | 9.89 | |
| 2009 | Mean | 0.04 | 0.07 | 0.14 | 0.1 | 0.01 | 0.5 | 148.9 | 23.71 | 4.32 | -0.82 |
| S.D | 0.53 | 0.51 | 0.54 | 0.28 | 0.15 | 4.01 | 0 | 0 | 0 | 5.99 | |
| 2010 | Mean | 0.39 | 0.12 | -0.01 | -0.04 | 0.05 | -1.32 | 150.3 | -42.3 | 103.82 | -0.05 |
| S.D | 2.72 | 0.53 | 0.36 | 0.23 | 0.16 | 7.5 | 0 | 0 | 0 | 13.82 | |
| 2011 | Mean | 0.77 | 0 | 0.16 | 0.04 | 0 | 0.22 | 153.86 | 5.94 | 9.52 | -0.32 |
| S.D | 2.58 | 0.34 | 0.64 | 0.25 | 0.14 | 6.39 | 0 | 0 | 0 | 7.55 | |
| 2012 | Mean | 0.15 | 0.09 | 0.14 | 0.03 | 0.01 | -2.36 | 157.5 | 6.88 | 9.51 | 0.63 |
| S.D | 0.78 | 0.48 | 0.52 | 0.26 | 0.15 | 36.76 | 0 | 0 | 0 | 11.55 | |
| 2013 | Mean | 1.1 | 0.02 | 0.14 | 0.05 | 0.03 | 7.03 | 157.31 | 10.25 | 9.27 | -2.56 |
| S.D | 7.09 | 0.28 | 0.52 | 0.25 | 0.14 | 49.64 | 0 | 0 | 0 | 17.67 | |
| 2014 | Mean | 0.09 | 0.05 | 0.04 | 0.14 | 0.03 | -0.86 | 157.55 | 11.36 | 5.87 | 0.55 |
| S.D | 0.67 | 0.33 | 0.34 | 1.16 | 0.11 | 5.67 | 0 | 0 | 0 | 7.59 | |
| 2015 | Mean | 0.18 | -0.01 | 0.15 | 0 | 0.02 | 7.11 | 192.44 | 16.85 | 4.66 | -8.47 |
| S.D | 0.61 | 0.28 | 0.57 | 0.2 | 0.09 | 45.41 | 0 | 0 | 0 | 67.18 | |
| Overall | Mean | 0.45 | 0.07 | 0.09 | 0.04 | 0.01 | 1.11 | 138.61 | 4.72 | 17.98 | -0.75 |
| S.D | 4.12 | 0.43 | 0.53 | 0.39 | 0.17 | 33.63 | 21.97 | 15.82 | 24.8 | 19.74 | |
| S.D = Standard Deviation, Source: Research findings from Eviews version 8. | |||||||||||
| where, | |||||||||||
| Dependent variable: X1 = Asset growth | |||||||||||
| Independent variables: Y1 = Long term debt to capital ratio, Y2 = Total debt to capitalization ratio, | |||||||||||
| Y3 = debt to equity ratio, Y4 = Cost of debt, Y5 = Total debt to total asset | |||||||||||
| Control variables: Z1 = Inflation rate, Z2 = Interest rate and Z3 = Exchange rate. | |||||||||||
Table 3: Mean and standard deviation of the variables under study by year.
Findings from the regression model
The result of the application of Regression model (Ordinary least squares, fixed effect model and random effect model) for asset growth on financial leverages (Long term debt to capital ratio, total debt to capitalization ratio, debt to equity ratio, cost of debt, total debt to total asset, degree of financial leverage). The result is on a three common regression method for analysis of a panel/longitudinal data (cross sectional and time series data). The adjusted R2 shows that only about 60.3%, 66.2% and 61.8% of the variations in asset growth is explained by the variation in financial leverage using ordinary least squares model, fixed effect model and random effect model respectively.
The empirical evidence obtained shows inflation, interest rate and exchange rate has a significant negative relationship at 10% each. For each of the models, the F-value was found to be significant with the value of (P<0.05), while the coefficient of determination is highest in fixed effect model (9.85) while the ordinary least squares model and random effect model is 8.83 and 8.77 respectively. The significant F-value and R2 adjusted indicates an overall adequacy of the regression model. The relatively small adjusted R2 value could be attributed to repeated value due to several companies under investigation.
Conclusion
Asset growth has a significant relationship with all the financial leverage variables except the cost of debt. This result agrees with Sarchah & Hajiha [13] that found a significant relationship but contradicts Mutai [9] and Yasemi et al. [17] which found an insignificant relationship with asset growth.
Asset growth also shows a significant negative relationship with all the control variables which is the interest rate, inflation rate and exchange rates.
In accordance with the research finding that financial leverage measures has a significant relationship with asset growth in Nigeria. This shows that when debt is used efficiently by any company, it can achieve its intended growth since the use of debt helps the firm to increase its asset base for expansion, new product lines, new projects etc.
On the other hand, the inflation rate, exchange rate and interest rate reports a significant negative relationship with the asset growth showing that these rates have become necessary components in the financial decision for leverage by any company in Nigeria.
Recommendations
In line with the findings of this study which revealed that financial leverage has significant effect on asset growth and the inflation, interest and exchange rates of quoted companies in Nigeria. Therefore, the following recommendations are drawn from the conclusions of this study.
1. Financial decisions should be made in consonance with the prevailing inflation, interest and exchange rates by the management of quoted non-financial firms in Nigeria.
2. The use of debt financing in times of high inflation like the scenario in Nigeria might not be a good business decision since inflation leads to an increase in the cost of business operations. The interest rate of the debt to be collected must be put into consideration in the decision for leverage for firms in Nigeria since a high interest rate of lending might make it difficult for firms to meet the obligation of repayment leading to the increase in the non-performing loans.
3. Nigeria is a country that is import-dependent making any uncertainty in the exchange rate to have a profound effect on the operating costs which can propel companies to go bankrupt due to the shock from the exchange rate depreciation, this shows that Exchange rate has also become an essential factor in leverage decision in Nigeria until a balance is placed on the import- export relationship by the monetary authorities in Nigeria.
Acknowledgement
Prof. S.N. Amadi, My PhD Thesis supervisor.
References
- Ahsan A. Mean reverting financial leverage theory and evidence from Pakistan. App Eco. 2016;48(5):379-88.
- Ibrahim TR, Akinlo AE. Interrelationship between size, growth and profitability of non-financial firms in Nigeria. Euro J Bus Manag. 2017;9(7):2222-839.
- Jensen MC, Meckling WH. Theory of the firm: Managerial behaviour. Agency costs and ownership structure. J Fin Eco. 1976;3:305-60.
- Jensen MC. Agency costs of free cash flow, corporate finance and takeovers. Eco Rev. 1986;76(2)323-9.
- Kenn-Ndubuisi JI. effects of financial leverage on Corporate growth in Nigeria (Unpublished doctoral thesis). Rivers state University, Port Harcourt 2018.
- Miller M. Debt and taxes. J Fin. 1977;29:261-75.
- Modigliani F, Miller MH. Corporation income taxes and the cost of capital; A correction. Am Eco Rev. 1963;53:433-43.
- Modiglini F, Miller MH. The cost of capital, corporate finance and the theory of investment. Am Eco Rev. 1958;48:261-97.
- Mutai B. The relationship between financial leverage and asset growth of firms listed at the Nairobi securities exchange. (Masters theses, University of Nairobi, Nairobi). 2014
- Myers S. Determinants of corporate borrowing. J Fin Eco. 1977;9:147-76.
- Myers S. The capital structure puzzle. J Fin. 1984;39:575-92.
- Sajid M, Amir A, Hazor MS. Does financial leverage influence investment decisions? Empirical evidence from kse-30 index of Pakinstan. Asian J Eco Model. 2016;4(2):82-9.
- Sarchah SF, Hajiha Z. The effect of company growth indices on financial leverage ratios of the companies listed in Tehran stock exchange. J Basic App Sci Res. 2013;3(9):20-30.
- Van Horne JC. Financial management and policy (fifth ed.) prentice hall, Englewood cliffs. New Jersey. 1980.
- Vijitha G. How does financial leverage affect financial risk? An empirical study in Sri-Lanka. Amity J Fin. 2016;1(1):57-66.
- Weston JF, Brigham EF. Management finance (Seventh ed.). The Dryden press, Hinsdale Illonis. 1981.
- Yasemi S, Farshidkhairollahi, Fatahidehpahni, et al. Studying financial leverage relation to firm’s growth and financial strength in the accepted (listed) companies in Tehran stock exchange in various industries. Ind J Sci Res. 2014;3(1):355-61.
- Zhao B, Wijewardana WP. Financial leverage, Firm growth and Financial strength in the listed companies in Sri Lanka', Procedia- Soc Behav Sci. 2012;40:709-15.