- Biomedical Research (2012) Volume 23, Issue 1
Evaluation of Serum adenosine deaminase activity during the course of pulmonary tuberculosis treatment
K. Srinivasa Rao*, H. Anand Kumar2, B. M.Rudresh3, T.Srinivas2, K. Harish Bhat1
1Department of Biochemistry, Navodaya Medical College, Raichur, India.
2Department of Microbiology, Navodaya Medical College, Raichur, India.
3Department of Biochemistry, AIMS, B.G.Nagar, Bellur, India.
- Corresponding Author:
- K. Srinivasa Rao
Department of Biochemistry Navodaya Medical College Mantralayam Raod Raichur 584103. India
Accepted date: November 17 2011
Abstract
Tuberculosis is an ancient human scourge that continues to be an important public health problem world wide. The risk of increasing spread of tuberculosis and development of drug resistance make early diagnosis a matter of utmost concern. The significance of serum ADA levels in the diagnosis of tuberculosis is known. However there is hardly any study literature that compares the serum ADA level during the treatment of the disease. Te objective of the study was to evaluate the effectiveness of Serum ADA in prognosis of pulmonary tuberculosis at different durations of the therapy in relation with other diagnostic tests of pulmonary tuberculosis. Serum ADA was measured along with other diagnostic markers during the course of treatment. The serum ADA values in the study group was (mean ± SD) 41.48 ± 8.02 U/L and in controls (mean ± SD) of 17.60 ± 5.17 U/L. After the 1st month of treatment there was no significant change(p>0.05) in serum ADA levels 39.60 ± 0.79U/L,however significant difference was recorded after the second month of treatment in serum ADA level 29.66 ± 0.83U/L and similarly at sixth month of treatment 22.12 ± 0.51U/L difference in serum ADA was significantly high. The difference in serum ADA levels between the first month and second month & first month and sixth month were statistically significant. (p<0.001, p<0.001 respectively). The measurement of serum ADA could be of significant help to evaluate the response to the therapy, particularly during second and sixth month. This may have an association with lymphocytic activation.
Keywords
Serum ADA, pulmonary Tuberculosis, prognostic markers
Introduction
India is the highest TB burden country accounting for one fifth of the global incidence (Global annual incidence estimate is 9.4 million cases out of which it is estimated that 1.98 million cases are from India) [1]. India is 17th among 22 High Burden Countries in terms of TB incidence rate. [2] In diagnosis of tuberculosis, microbiologic, genetic, immunologic and biochemical methods are used [3]. The measurement of adenosine deaminase (ADA) activity is one of the biochemical methods. ADA is an enzyme that converts adenosine to inosine, and deoxyadenosine to deoxyinosine in the pathway of purine catabolism, and by this way catalyses irreversible deamination [4]. ADA acts in proliferation and differentiation of lymphocyte and especially T lymphocyte [5].However there is no study literature that compares the serum ADA level with tuberculosis categories or investigates the relation of the serum ADA levels with response to antituberculosis therapy. Therefore, this study was aimed to examine the level of serum ADA in patients undergoing anti tubercular treatment at different intervals.
Objectives
To know the effectiveness of serum ADA in the prognosis of pulmonary tuberculosis at different durations of therapy in relation with Known prognostic markers of pulmonary tuberculosis.
Materials and Methods
The Prospective study was carried out in Navodaya medical college hospital & research centre, Raichur between April 2009 & July 2010.
Locus of the study
The study was conducted in the department of Biochemistry NMC, Raichur and Biochemistry section, Microbiology & Pathology sections of central clinical laboratory of Navodaya Medical College Hospital and Research Centre, Raichur, Karnataka.
Study Group
A total of 44 clinically and laboratory diagnosed pulmonary tuberculosis patients, who have consented to participate in the study during treatment were selected. The study and data collection were carried out with the approval from institutional ethical committee and informed consent were taken from all the study subjects. Of 44 cases 32 were males (72.72%) and 12 were female (27.27%) cases, the mean age group was 42.96 ± 15.29.
Control Group
A total of fifteen normal healthy individuals (paramedical and medical staff of Navodaya medical college) aged between 20 years - 50 years [11 Males (73.3%) and 4 females (26.66%)] were selected as controls after getting their consent for participation.
Inclusion and exclusion criteria followed in the present study are as follows:
Inclusion criteria for pulmonary TB
Cases diagnosed as a “new case” of tuberculosis; Possessing at least two positive sputum smear test positive for Acid Fast Bacilli; Radiographic abnormalities consistent with pulmonary tuberculosis.
Only those freshly diagnosed pulmonary tuberculosis cases, who were willing to participate during treatment were included in the study group.
Exclusion criteria for pulmonary TB
Patients with extra pulmonary TB and /or patients requiring surgical intervention, Chronic pulmonary TB (receiving at least two courses of anti-TB treatment for more than six months), and dropouts were excluded from the study group.
All selected cases under study group were analyzed for complete blood count, ESR, serum ADA and CRP and control group were analyzed for serum ADA levels. Patients were treated with standard anti tuberculosis treatment as per RNTCP (DOT) regimen under the supervision of I/C of pulmonary medicine dept. NMCH&RC.
Venous blood was drawn aseptically and collected in two sterile containers, one anticoagulated container and another plane container. The anticoagulated blood was used for total leukocyte count, lymphocyte count and ESR. Serum sample was collected from plane blood after centrifugation and used for ADA and CRP estimation. ESR by Westergren’s method [6], Quantitative determination of C-Reactive Protein (CRP) [7,8,9] by Turbidometric Immunoassay using ERBA Chem. 5 Plus semi auto analyzer. Leukocyte total count and differential count were measured in a semi automated cell counter ABX Micros 60.
ADA estimation was done by standard colorimetric method as described by Guisti G Galanti enzymatic analyses [10,11]. Adenosine deaminase activity was determined in serum by using ADA MTB diagnostic kit from Microxpress a division of Tulip diagnostics (P) Ltd.
Statistical Analysis
The results were expressed as mean ±SEM (Standard error of mean) taking 95% CI. Analysis of variance (ANOVA) followed by Bonferroni Multiple Comparison Test was used for statistical evaluation. P values less than 0.05 were considered as significance and p <0.01 as highly significant. Correlation matrix between normally distributed indices was determined using the Pearson correlation coefficient.
Results
Control Group
In this group the serum ADA activity level ranged from 12.43 to 22.73 U/L with a mean value (mean ± SD) of 17.60 ± 5.17 U/L.
Study Group
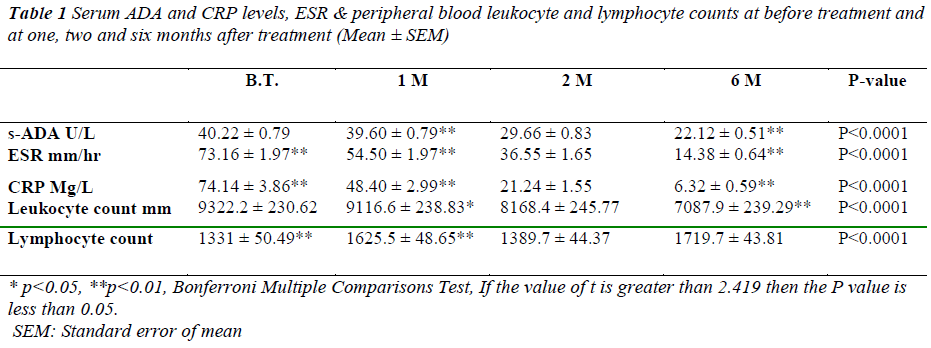
The serum ADA values in study group before treatment ranged between 33.46 U/L and 49.50 U/L with the mean ± SEM serum ADA activity of 40.22 ± 0.79 U/L. After first month of treatment values are 39.60± 0.79 U/L followed by second and sixth month with a mean of 29.66±0.83 U/L and 22.12±0.51 U/L respectively as shown in table-1.
* p<0.05, **p<0.01, Bonferroni Multiple Comparisons Test, If the value of t is greater than 2.419 then the P value is less than 0.05.
SEM: Standard error of mean
Table 1: Serum ADA and CRP levels, ESR & peripheral blood leukocyte and lymphocyte counts at before treatment and
at one, two and six months after treatment (Mean ± SEM)
After 1st month of treatment there was no significant (p>0.05) change in serum ADA 39.60±0.79U/L levels. However highly significant difference of 29.66 ± 0.83 (p<0.001) was recorded after the second month of treatment. Similarly at sixth month of treatment difference in serum ADA (22.12 ± 0.51) was significantly high (p<0.001). The difference in serum ADA levels between the first month and second month & first month and sixth month were statically significant.( p<0.001, p<0.001 respectively) as shown in Figure-1.
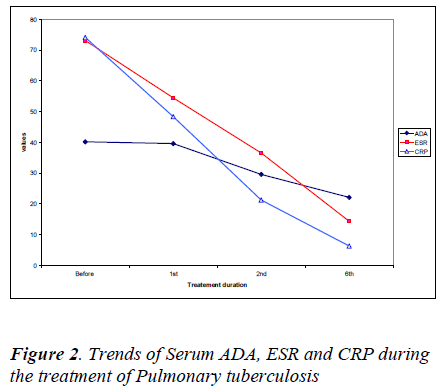
C-reactive protein values before treatment have shown decrease from 74.14 ± 3.86 to 48.40± 2.99 after first month, 21.24 ± 1.55 after second month and 6.32± 0.59 mg/l after sixth month. Similarly ESR values have shown significant decrease from 73.16± 1.97 before treatment to 54.50±1.97 after first month, 36.55 ±1.65 after second month and 14.38 ± 0.64 mm/hr after sixth month.
There was a significant decrease in erythrocyte sedimentation rates and C-reactive protein values after the 2nd and 6th month of treatment corresponding with the serum ADA levels as shown in Figure 2.
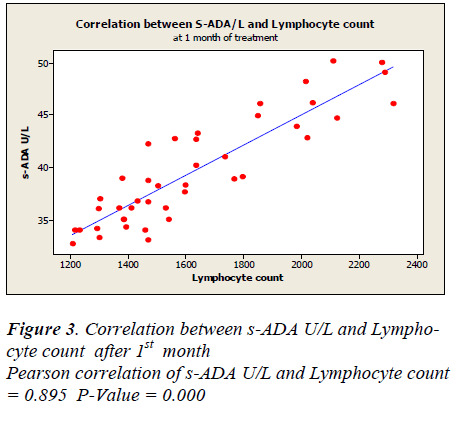
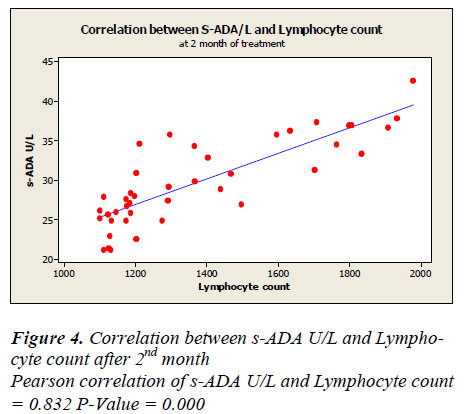
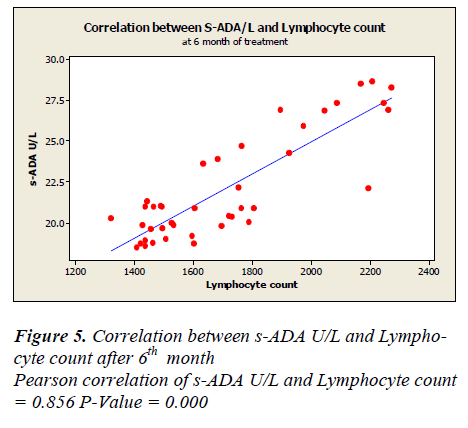
Lymphocyte count showed 1331 ± 50.49 before treatment, 1625.5± 48.65 after first month, 1389.7± 44.7 after second month and 1719.7± 43.81 after sixth month of treatment. A positive correlation and trend between serum ADA and lymphocyte count was found after 1st, 2nd & 6th month of treatment as depicted in Figure -3,4&5.
Discussion
The values of serum adenosine deaminase were significantly higher in the study group than in the control group. After the first month of treatment of pulmonary tuberculosis, there was no significant change (p>0.05) in serum ADA when compared to initial reading, but after the second month & sixth month of treatment there was a significant decrease in the serum ADA values (p< 0.05). However serum CRP and ESR values also decreased immediately after the first month of treatment (Figure-2).
In our previous work on serum ADA activity in pulmonary tuberculosis patients, we found that serum ADA was elevated in 88% of study group compared to control group followed by chest x-ray (76%) and sputum AFB (63%). And also significantly high serum ADA was noted in pulmonary tuberculosis cases compared to non tuberculosis pulmonary diseases. [11]
The highest level of serum adenosine deaminase in patients with pulmonary tuberculosis corresponds to the severity of the disease, high bacterial isolation, the extent of destructive and infiltrative changes in lung tissue, and endotoxemia. This indicates that ADA measurement is an additional criterion for assessing the health status in pulmonary tuberculosis patients and the magnitude of destructive processes. Moreover, the measurement is of prognostic value as it provides an objective assessment of the course of an acute progressive process and the efficiency of chemotherapy used [12].
A study by Zafer Kartaloglu et al [13] showed a slight elevation of serum ADA in the first month, but it decreased during treatment in parallel with the effectiveness. A study by Meftun Unsal et al [14] revealed gradual decrease in serum ADA from 30.1± 11.7U/L to 24.8 ± 15.6 after first month of treatment & after second month 22.0 ± 10.6 in limited lesion cases. And in extended lesion cases before treatment ADA values was 31.3 ± 18.3, first and second month values were 27.5 ± 13.0 and 27.1 ± 12.2 U/L respectively.
Suzuki K et al [15] reported that the serum acute phase reactants decreased to normal levels within three to five weeks after negative results for tubercle bacilli were obtained in the sputum cultures. In addition, hematological abnormalities were observed in patients, such as normocytic normochromic anemia, leukopenia, neutropenia, and lymphcytopenia. These abnormalities reverted to normal with antituberculosis treatment [16]. Studies on lymphocyte subgroups reported that especially CD4+ T cells showed an increase after the beginning of treatment [17,18]. Callazos et al [19] was observed that a decrease in both the leukocyte and the lymphocyte counts paralleled the decrease in s-ADA levels after the first month of treatment. In our study the lymphocyte count and s-ADA levels showed a parallel course for two months. After the second month the lymphocyte count increased, while s- ADA levels continued to decrease. The levels of s-ADA showed no significant change (p>0.05) in the first month of the treatment and decreased after the second month. Perhaps this pattern is related to lymphocytic activation and/or a complex cytokine network regulating the lymphocytes. It is known that the course of the ADA level is associated not only with lymphocytes, but also some chemical mediators secreted by these cells [21]. The disease is under control after the second month, and the lymphocytes and cytokines normalize. Although lymphocyte numbers increased at the sixth month, s-ADA levels decreased. It could be thought that the patients who had lymphopenia in the beginning showed increase in lymphocyte count after the treatment and influences the change in s-ADA level. The lymphocyte counts and serum ADA levels demonstrated a parallel course in the first two months and then they had different course. CRP & ESR reduced quickly after first month of treatment. The levels of serum ADA showed decrease after first month of treatment. This decrease in s-ADA after the first month might reflect the normalization of the altered lymphocyte turnover induced by tuberculosis. Therefore measurement of serum ADA could be of significant help to evaluate the response to therapy, particularly in those patients with increased value of the enzyme.
References
- Revised National Tuberculosis Control Programme Overview 2009: TB India 2010. Central TB Division, Directorate General of Health Services, Ministry of Health and Family Welfare New Delhi.2010; Intro: Viii
- WHO global TB report 2009
- Taci N, Yurdakul AS, Ceyhan I. Detection of mycobacterium tuberculosis DNA from peripheral blood in patients with HIV-seronegative and new cases of smearpositive pulmonary tuberculosis by polymerase chain reaction. Respir Med 2003; 97: 676-681.
- Baganha M, Pego A, Lima MA . Serum and pleural adenosine deaminase: Correlation with lymphocytıc populations. Chest 1990; 97: 605-610.
- Shore A, Dosch HM, Gelfond EW. Role of adenosine deaminase in the early stages of precursor T cell maturation. Clin Exp Immunol1981; 44: 152-155.
- Godkar PB , Godkar DP; Text book of Medical laboratory technology, 2nd edition , Bhalani publishing House; Page no : 747-749
- Manack J.R. and Richards CB., J.Immunol.1971; 20 :1019
- Ritchie RF. A Simple direct & sensitive technique for measurement of specific proteins in dilute solution. J. Lab Clin Med 1967; 70 (3): 512-517
- Pepys MB,De Beer FC, Dyck R F , et al., Clinical measurement of C-reactive Protein..Ann. NY Acad. Sci 1982; 389: 459-460
- Giusti G. Adenosine deaminase. In Bergmeyer H.V.Ed. Methods of enzymatic analysis Vol-2, New York Academic press, 1974:1092-last page number?
- Srinivasa Rao K, Anandkumar H, Rudresh B M, Srinivas T, Harish Bhat K. A comparative study and evaluation of serum adenosine deaminase activity in the diagnosis of pulmonary tuberculosis. Biomedical Research 2010 ; (2):189-194.
- Balasaniants GS, Titarenko OT, D'iakova MN. Diagnostic and prognostic significance of adenosine deaminase in acutely progressive pulmonary tuberculosis. Probl Tuberk. 2001;(8):46-49.
- Zafer Kartaloglu , Oguzhan Okutan , Erkan Bozkanat , M. Harun Ugan, Ahmet Ilvan.The course of serum adenosine deaminase levels in patients with pulmonary tuberculosis.Med Sci Monit , 2006; 12(11): CR 476- 480.
- Meftun Unsal, Ayse Berna Dursun, Berna Özturk, Nurhan Sariodlu, Mihriban Ödretensoy, Türkan Eryilmaz. The role of serum adenosine deaminase levels in determination of disease activity of patients with pulmonary tuberculosis.Turk J Med Res 1995; 13 (6):181-184
- Suzuki K, Takashima Y, Yamada T et al. The sequential changes of serum acute phase reactants in response to antituberculous chemotherapy. Kekkaku 1992; 67 (4): 303-311.
- Singh KJ, Ahluwalia G, Sharma SK et al: Signifi cance of haematological manifestations in patients with tuberculosis. J Assoc Physicians India 2001; 49: 790-794
- Uppal SS, Tewari SC, Verma S, Dhot PS: Comparison of CD4 and CD 8 lymphocyte counts in HIV-negative pulmonary TB patients with those in normal blood donors and the effect of antitubercular treatment: hospital based flow cytometric study. Cytometry B Clin Cytom 2004; 61:20–26
- Collazos J, Martinez E, Mayo J, Rinon M, Response of lymphocyte subsets in patients under treatment for tuberculosis. Eur J Clin Microbiol Infect Dis 2000; 19: 623-626
- Collazos J, Espana P, Mayo J, Martinez E, and Izquierdo F, Sequential Evaluation of Serum Adenosine Deaminase in Patients Treated for Tuberculosis. CHEST 1998; 114:432-435
- Ida T, Taniai S, Nitta M et al. Serum adenosine deaminase activity in patients with active pulmonary tuberculosis, Kekkaku.1990; 65 (7): 477-481.
- Yoneyama Y, Sawa R, Suzuki S et al, Relationship between adenosine deaminase activity and cytokinesecreting T cells in normal pregnancy Obstet Gynecol 2002; 100(4): 754-last page number?
