Research Article - Biomedical Research (2017) Artificial Intelligent Techniques for Bio Medical Signal Processing: Edition-I
Development of a mathematical model for skin disease prediction using response surface methodology
Sudha J1*, Aramudhan M2 and Kannan S31Research Scholar, Faculty of Computing, Sathyabama University, Chennai, India
2Department of Information Technology, Perunthalaivar Kamarajar Institute of Engineering and Technology, Karaikal, India
3Department of Mechanical Engineering, A.V.C College of Engineering, Mayiladuthurai, India
Accepted date: April 18, 2017
Abstract
The skin is a prime and most visible organ of the body. Skin act as a barrier against injury and bacteria. There are six different categories of skin diseases which shares somewhat same features. In this group psoriasis is a major skin disease. This paper focuses the major clinical and histopathological attributes influences on psoriasis disease of human body. Disease diagnosis is one of the applications of data mining. Prediction used to predict the relationship by using regression equation. This paper originates the relationship among input and response attributes for improving disease diagnosis in medical area. The Response Surface Methodology (RSM) is make used for develops a relationship between input attributes of skin disease and predicts the psoriasis patients with the help of independent and dependent variables. The performance of RSM model shows the developed empirical relationship and it has the greatest conformity with test results. The Analysis of Variance (ANOVA) is performed to mathematical analysis of the outcome. In summary, the developed empirical model is suitable for skin disease prediction.
Keywords
Skin diseases, Data mining, Classification, Regression, Response surface methodology
Introduction
Skin is the major organ of the human body, with a range of purpose that supports survival. In total world population nearly 1/7th of the peoples suffer from some kind of skin daises. Skin disease is really difficult to diagnose, and in due course it may be a leading cause of skin cancer. There are many parameters that determine the division of skin diseases, from genetic vulnerability to ecological factors. Skin disease causes an enormous burden in the universal environment of health. The real problem of skin disease is to differential disease diagnosis in the initial stage [1]. They are all same clinical features like scaling, erythema with very little diversity. In later stage biopsy is necessary for the diagnosis and it shows the histopathological features. In this stage, diagnosis of one disease shows initial stage of another disease’s features. In this different kind of skin disease, Psoriasis is a chronic, noninfectious, painful, disable and disfigures disease [2].
People with psoriasis may have uneasiness including itching, pain, and emotional distress. Psoriasis most often arises on the scalp, elbows, knees, palms, lower back, soles of the feet and face. But it can impinge on any skin location, fingernails, toenails, and soft tissues inside the genitalia and mouth and [3]. Psoriasis is connected with other serious health conditions, such as depression, diabetes and heart disease [4]. It may also influence on the quality of life because of its uneasy social appearance. It becomes important to recognize these diseases at their initial stage to control it from spreading. So predicting this disease needed an empirical model. The Figure 1 shows about the normal healthy skin and psoriasis disease affected skin [5].

Figure 1: Healthy skin and Psoriasis skin.
The disease prediction plays a vital role in data mining. There are many types of diseases predicted in data mining namely cancer, liver disorder, skin disease [6], diabetes [7,8] hepatitis etc. Data mining is a method of extracting new and significant information from large amount of data [9]. Medical data mining has high possible for discovering the hidden model in the data sets of the medical domain and also used to diagnosis the diseases in the early stage [10]. These models can be used for clinical diagnosis for commonly distributed in raw medical data which is heterogeneous in nature and voluminous.
Psoriasis skin disease’s data are collected and classified by machine learning technique [11], data mining techniques [12]. Machine learning is a kind of Artificial Intelligence (AI) that gives computers with the ability to learn without being explicitly programmed. Machine learning techniques are broadly divided into supervised learning and un-supervised learning. Many deep learning algorithms are applied to unsupervised learning tasks. In terms of machine learning, classification is considered an instance of supervised learning. Classification is a form of data analysis that extracts models describing significant data classes [12]. Effective and scalable methods have been developed for decision tree induction, Naive Bayesian classification and rule-based classification. Which have been used in the field of health care for classification of different diseases. Many researchers used different type of medical data classification techniques such as, genetic algorithm [13], Support Vector Machine (SVM) [10], adaptive Genetic fuzzy [14], particle swam optimization [15], Neural Network [7], Bayesian net. Mining classification rules usually utilize supervised learning techniques. Now-a-day’s statistical tools are also combined with supervised leaning like, fuzzy logic, and artificial neural network are used for solve factors selection problem [13] and also deals with performance analysis [7,11].
Models are mathematical descriptions, qualitative and quantitative, by mathematical algorithms or expressions. Mathematical models are also used in Artificial intelligence, optimization etc. Models can be finding out by visualization methods that make known patterns in the data. Models are educated in part by domain knowledge. It may help to clarify a system and to study the effects of different components. Response Surface Methodology (RSM) is one of the model development methods. Few researchers only concentrated on RSM methodology and combined with data mining [16,17] for predict the significant factors. These methods are extending to use disease predictions in health care industry. Therefore, the key part of this work is to develop a mathematical model and predict the skin disease by using Response Surface Methodology (RSM) with the help of data mining.
Methodology
To predict the psoriasis disease and build the empirical model with the help of data mining approaches. Our proposed model implementation processes is divided into three different Phases namely (i) Data acquisition, (ii) Data preparation, (iii) Data Classification (iv) Development of Mathematical Model and (v) Evaluating the model.
Data acquisition
The input Dermatology dataset are utilized from University of California, Irvine, (UCI) Repository of Machine Learning Database [1]. The dataset contains 12 clinical attributes and 22 Histopathological Attributes and the 35th feature is considered as target (Class). Totally 35 features are considered as input. There are 366 instances in the data set containing all the six output classes. Out of 366 instances, 112 instances belong to psoriasis Disease class, 61 instances belongs to seboreic dermatitis class, 72 instances belong to lichen planus class, 49 instances belongs to pityriasis rosea class, 52 instances belong to chronic dermatitis class and 20 instances belong to pityriasis rubra pilaris class. Its integer valued form 0 to 3. To differentiate this presence (values 1-3) from absence considered as 0. In 366 instance of dermatology dataset 8 examples only missing. From this data set psoriasis patients have been considered as input. Sample distribution of various classes of the data set tabulated in Table 1.
| Attributes | Class | Instance | Characteristics |
|---|---|---|---|
| 35 | 6 | 366 | Multivariate |
Table 1. Dermatology data set.
Data preparation
The purpose of this step is to clean and transform [18] the Medical data and then apply classification and prediction. It is also used to improve the efficiency of the prediction. Data cleaning involves fill the missing values by using attribute mean and then reconstruct the data by using transformation. Data transformation techniques such as, smoothing, Aggregation normalization, Attribute construction. Normalization is the process of casting the data to the specific range [11]. Min-Max normalization gives the best result of training data set [10]. It performs a linear transformation of original data.
It transforms a value X to X’ which fits in the range (A, B).
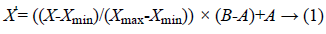
Where,
X’=Min-Max Normalized Data with (A, B) predefined boundary.
X=Range of original data.
Xmin=Minimum value of X.
Xmax=Maximum value of X.
The data set is reconstructed by using Min-Max method with a range (2.5-10) sub suit in Equation 1. Among input factors irrelevant factors should be ignored because they have low correlation with given response [16]. A few selected factors are highly correlated with specific response and redundant factors must be screen out.
Data classification
In data mining one of the most important tasks is classification. Classification methods are supervised learning methods that classify dataset into predefined class label. In Classification model construction is one of the useful data mining techniques. The classification process is divided into two stages in first stage, the so-called training phase, used to build the model from the training set. In the second step, the so-called testing phase, the remainder subset which is known as the test set is used to assess whether the trained model can be evaluated and classifying the new observations in testing process test the model using unseen test data to assess the model accuracy. In medial data machine learning is used to reduce the attributes [19].
In this phase, dermatology data set are prepared and then feed it to the models. Collected datasets are fragmented into two set, namely training dataset and testing dataset. The training set which consists of 75% total dermatology data set. Testing dataset contains remaining 25% of the total dermatology dataset.
Input: Medical dataset D.
Output: Develop a mathematical model
Step 1: Read the medical dataset D
/*Data Preparation phase */
Step 2: Apply Data cleaning and Min-Max normalization in D output D’
/* Classification - Model Construction Phase */
Step 3: Divide the data set D’ as D1 and D2 as training and testing data set.
/* Model development for training data set and Prediction*/
Step 4: Response surface analysis
Step 4 (i): Refining the model which will produce better statistical terms.
Step 4 (ii): Building ANOVA Table
Step 4 (iii): Empirical model development
Step 5: Performance evaluation.
Step 6: Analysis of performance evaluation.
If the model produces more percentage of deviation go to step 4 (i), else go to next step.
/* Model Validation*/
Step 7: Compare actual response and predicted response apply the test dataset D2 find the response
Mathematical model construction
Classification used to mine the model. It constructs the mathematical model based on training set. The training data set is used to develop a mathematical model with an integration of Data mining result with RSM [20]. Prediction used to predict the relationship by using regression equation [9]. In this model the Analysis of Variance (ANOVA) of response variable is calculated.
Response surface methodology (RSM)
RSM is a set of statistical and mathematical techniques for developing an empirical model [21]. The objective of Design of experiments is to find a relationship between responses (output variable) which is influenced by numerous independent variables.
Assuming that there are p input variables X=(x1, x2, x3 ….xp), and q output variables Z=(z1, z2, z3, ….zq), This response model including both input and output variables can be given by
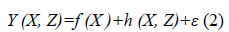
The surface noted by f (x1, x2) is called a response surface Y. Where f (x), h (x, z), and ε are the part of the model that include the input factors only. This methodology was used to develop a second order regression equation relating response characteristics and process variable. The regression equation used to predict the model. The discovered data is visually represented to the user. The response can be represents either in the three-dimensional space graph or contour plots. It helps to visualize the shape of the response surface Response surface model development is an iterative method. An estimated model is attained, the goodness-of-fit resolves if the solution is reasonable. Otherwise the estimated method is regenerated and more experiments are prepared.
Design of experiments (DoE) is the main part of RSM. The objective of DoE is the selection of the points where the response should be considered.
Model evaluation to test and evaluate the model, 75% of the dataset is used. Instances are extracted and then served as a benchmarking dataset for machine learning problems. The predicted values are very closure to the actual values and also the model gives the best results for remaining test data set.
Results and Discussion
After preprocessing and classification techniques are applied on medical data set, two third of training data set with clinical and histopathological attributes are considered as input variables for develop the model. RSM shows the interaction between dependent and independent attributes.
The following sections are discussed about ANOVA techniques and construct the mathematical models with performance evaluation. The main element of ANOVA table are source of variance, sum of squares, Degree of freedom, mean square, F value, and the probability associated with the F-value. The most dependent attributes are A-Follicular papules, B-Eosinophils in the infiltrate D-Thinning of the suprapapillary epidermis G-Perifollicular parakeratosis. RSM provide the relationship among input parameters are considered as control factors and output class such as psoriasis status of the patient.
The Table 2 shows the ANOVA table for finding psoriasis disease. In general, it can be considered that higher Fisher’s Ftest values and lower P values indicate the relative significance of each item. It can be observed in the Table 2. The Model Fvalue of 5483.696 implies the model is significant. There is only a 0.01% chance that a "Model F-Value" this large could occur due to noise. Values of "Prob>F" less than 0.0500 indicate model terms are significant. In this case, A, B, D, G, AD, BD, A2, D2, G2 are significant model terms. Values are greater than 0.1000 indicate; the model terms are not significant. The quadratic model has a higher R2 value (0.9990) than other model (linear, 2FI and cubic model).
| Term | Sum of squares | DoF | Mean square | F Value | p-value (Pro>F) |
|---|---|---|---|---|---|
| Model | 119.8761 | 9 | 13.31957 | 5483.696 | < 0.0001 |
| A | 3.29E-05 | 1 | 3.29E-05 | 0.013536 | 0.9078 |
| B | 1.538641 | 1 | 1.538641 | 633.4619 | < 0.0001 |
| D | 1.459365 | 1 | 1.459365 | 600.8238 | < 0.0001 |
| G | 0.056748 | 1 | 0.056748 | 23.36328 | < 0.0001 |
| AD | 0.046298 | 1 | 0.046298 | 19.06079 | < 0.0001 |
| BD | 0.995054 | 1 | 0.995054 | 409.666 | < 0.0001 |
| A2 | 0.053436 | 1 | 0.053436 | 21.9998 | < 0.0001 |
| D2 | 0.033962 | 1 | 0.033962 | 13.98243 | 0.0005 |
| G2 | 0.064206 | 1 | 0.064206 | 26.43365 | < 0.0001 |
| Residual | 0.123876 | 51 | 0.002429 | ||
| Lack of fit | 0.123876 | 22 | 0.005631 | ||
| Standard deviation=0.049 Mean 1.33 Pre.R2 0.9977 |
R2=0.999 Adj. R2 0.9988 |
||||
Table 2. ANOVA table for psoriasis status.
The general equation for the proposed second order regression model to predict the response can be written as Equation 2.
Y=0.218688 × A+1.99785 × B-0.0013 × D+0.249777 × G-0.01166 × A × D-0.04208 × B × D-0.01161 × A2+0.00872 × D2-0.01568 ×D2→ (2)
Figure 2 shows the interaction between thinning of the suprapapillary epidermis and eosinophils it is evident that, enhance psoriasis increases due to increase the thinning of the suprapapillary epidemis. Similarly eosinophis decreases the psoriasis increases.

Figure 2: Three dimension surface graph for thinning of the suprapapillary epidermis and eosinophils.
The Table 3 shows the percentage of deviation between actual and predicted values. The actual and predicted values are very closer to each other. This Percentage of deviations are plotted in graph and shown in Figure 3. The differences between actual value and predicted values are very minimal. The empirical model has validated by using test data set and it also give 99.9% accuracy.

Figure 3: Percentage of deviation between actual and predicted psoriasis patient.
| Sl. No. of data set | Psoriasis patient (1) | % of deviation | |
|---|---|---|---|
| Non psoriasis patient (2) | |||
| Actual | Predicted | ||
| 1 | 1 | 0.973221 | 2.677907 |
| 2 | 1 | 0.973221 | 2.677907 |
| 3 | 1 | 0.973221 | 2.677907 |
| . | . | . | . |
| 58 | 2 | 1.986031 | 0.698475 |
| 59 | 2 | 2.047594 | -2.37968 |
| . | |||
| 120 | 2 | 2.013595 | -0.67973 |
Table 3. Performance evaluations at developed model with experimental values.
Conclusions
Data mining technology is the fastest growing technology. It is being adopted in biomedical sciences and research. In this work we developed an empirical model by using data mining techniques and response surface methodology. Most of the researchers were concentrated to find out the accuracy of the dataset. Hence in this paper focused to develop the empirical model for the dermatology dataset. It extracts the relationship between dependent attributes and their response in terms of regression equation. This mathematical model may be helpful for medical practioners and researchers. In this model shows other dimension way of predicting and diagnosis the psoriasis disease with a use of data mining techniques. The preprocessing phase get better the quality of obtain result. The RSM proves to be the effective tool for develop a mathematical model for predict the disease. Further, this work can be extended to other diseases.
References
- Blake CL, Merz CJ. UCI repository of machine learning databases. University of California Irvine 1998.
- Leonardi C, Matheson R, Zachariae C, Cameron G, Li L. Anti-interleukin-17 monoclonal antibody ixekizumab in chronic plaque psoriasis. N Engl J Med 2012; 366: 1190-1199.
- Michalek IM, Loring B, John SM. A systematic review of worldwide epidemiology of psoriasis. J Eur Acad Dermatol Venereol 2017; 31: 205-212.
- Kimball AB, Robinson D, Wu Y, Guzzo C, Yeilding N. Cardiovascular disease and risk factors among psoriasis patients in two US healthcare databases, 2001-2002. Dermatology 2008; 217: 27-37.
- National Psoriasis Foundation, Statistics. Available at: hyperlink https://www.psoriasis.org
- Barati E. A survey on utilization of data mining approaches for dermatological (skin) diseases prediction. J Selected Areas Health Inform 2011; 2: 1-11.
- Kusy M, Jacek K. Assessment of prediction ability for reduced probabilistic neural network in data classification problems. Soft Comp 2017; 21: 199-212.
- Yamaguchi M. Prediction of blood glucose level of type 1 diabetics using response surface methodology and data mining. Med Biol Eng Comp 2006; 44: 451-457.
- Jiawei H, Micheline K. Data mining: concepts and techniques. San Francisco, CA, itd: Morgan Kaufmann 2001.
- Sharma R, Shailendra NS, Sujata K. Medical data mining using different classification and clustering techniques: a critical survey. Computational Intelligence Communication Technology (CICT), 2016 Second International Conference 2016.
- Shrivastava VK. A novel approach to multiclass psoriasis disease risk stratification: Machine learning paradigm. Biomed Sig Proc Cont 2016; 28: 27-40.
- Chimieski BF, Rubem DRF. Association and classification data mining algorithms comparison over medical datasets. J Health inform 2013; 5.
- Sharma DK, Hota HS. Data mining techniques for prediction of different categories of dermatology diseases. J Manag Inform Dec Sci 2013; 16: 103-111.
- Dennis B, Muthukrishnan S. AGFS: Adaptive Genetic Fuzzy System for medical data classification. Appl Soft Comp 2014; 25: 242-252.
- Kumar GK. An optimized particle swarm optimization based ANN Model for clinical disease prediction. Ind J Sci Technol 2016; 9.
- Shin S. Development of a robust data mining method using CBFS and RSM. International Andrei Ershov Memorial Conference on Perspectives of System Informatics. Springer Berlin Heidelberg 2006.
- Yonghee, Sangmun S. Job stress evaluation using response surface data mining. Int J Industr Ergonom 2010; 40: 379-385.
- Al S, Luai, Zyad S, Basel K. Data mining: A preprocessing engine. J Comp Sci 2006; 2: 735-739.
- Zheng T, Xie W, Xu L, He X, Zhang Y. A machine learning-based framework to identify type 2 diabetes through electronic health records. Int J Med Inform 2017; 97: 120-127.
- Patel TM, Bhatt NM. Development of a mathematical model of VMS for automotive structural member using FEA-RSM hybrid modeling. Procedia Technol 2016; 23: 98-105.
- Kannan S, Baskar N. Modeling and optimization of face milling operation based on response surface methodology and genetic algorithm. Int J Eng Tech 2013; 5: 959-971.