Research Paper - Environmental Risk Assessment and Remediation (2018) Volume 2, Issue 4
Bioremediation of hazardous pollutants i.e. phenol from water and waste water using poplar tree wood activated carbon.
Kadirvelu K*, Kumar RD, Kannan GKBharathiar University, Coiambatore, India
- *Corresponding Author:
- Dr. K. Kadirvelu
DRDO-BU Centre for Life Sciences
Bharathiar University Campus
Coimbatore (T.N.) India
E-mail: kadirvelukrishna@yahoo.com
Accepted date: September 10, 2018
Citation: Kadirvelu K, Kumar RD, Kannan GK. Bioremediation of hazardous pollutants i.e. Phenol from water and waste water using Poplar tree wood activated carbon. Environ Risk Assess Remediat. 2018;2(4):6-13.
Abstract
Adsorption process has been accomplished as one of the most efficient, inexpensive and best water treatment technologies. Various lignocellulosic materials i.e. agricultural wastes, find their references as activated carbon resources. The process being eco-friendly in nature draws the attention of environmentalist all across the scientific world. The present study highlights the use of Poplar tree wood activated carbon in combating the issue of water pollution caused due to presence of hazardous pollutant like Phenol. The geographical conditions promote cultivation of Poplar trees in the northern states of India. Activated carbon prepared from the poplar tree act as potential low cost adsorbent for the removal of Phenol from water. Promising results have been obtained in adsorptive removal of phenol using poplar tree wood activated carbon. The equilibrium time was found to be 60 to 80 min for 500 ppm, 1000 ppm and 3000 ppm phenol solution. Among the kinetic models applied, pseudo-second order model fitted well. The optimum pH is found to be 5 whereas the optimum temperature for adsorption is 250°C. Adsorption seems to have direct relation to the adsorbent dose. The experimental data best fits in Langmuir and Freundlich’s isotherms equations. The adsorption capacity of the Phosphoric acid activated poplar carbon is 662 mg/g.
Keywords
Poplar, adsorption, phenol and its derivatives, water pollution, isotherm.
Introduction
Water pollution has become one of the major problems on the planet earth. The problem is not curtailed to a single country, but has now gained global concern. Intentionally or even unintentionally, various chemical pollutants are getting discharged in drinking water streams and sources. Phenol and its derivatives have gained considerable attention from environmentalists due to their increasing adverse and undesirable environmental effects. These hazardous and toxic substances drain into various water bodies due to inadequate and poor disposal methods followed by the industries. But, due to increase in literacy with passage of time, awareness among masses has amplified. This has paved way to escalating concern about safe, pure and healthy drinking water. Efforts are underway for solving these environment related problem and to bring the contaminants concentrations to minimum limits or even alleviate them completely.
Poplars are trees which belong to the genus Populus which are deciduous flowering plants in the family Salicaceae. Apart from its use (especially the wood) as building material for houses, furniture etc., the wood is also used for the manufacture of activated carbon [1].
In India, Poplar cultivation is commonly done as an intercrop with a variety of complimentary crops and with other trees like teak and mango etc. The six innate species of poplar in India are Populus laurifolia, Populus alba, Populus ciliata, Populus euphratica, Populus glauca and Populus gamblei [2]. All are located in the northern part of the country. Poplar agroforestry is practiced in many states in India i.e. Punjab, Haryana, Uttar Pradesh, Jammu and Kashmir in North and Arunachal Pradesh in North East [3].
Water contamination occurs due to presence of various organic and inorganic pollutants in traces or even beyond acceptable limits. Phenols are also one such hazardous pollutants. These have been ranked as 11th of the 126 chemicals that have been labelled as pre-eminence pollutants by USEPA [4]. At the same time, its wide application in various processes in industries, it’s difficult to contain the use of Phenol [5]. The literature studies indicate that concentration of phenols in industrial wastewater is a direct function of the plant characteristics [6]. For example, distillation units have been reported to have phenol in their effluent in a concentration less than 50 mg/L. The concentration ranges to 50 mg/L-500mg/L in catalytic cracking units and more than 500 mg/L in the spent caustic solutions. Technology is underway for the production of synthetic fuel from coal. Waste solution generated from such coal conversion processes contains phenol in the range of 200mg/L-600mg/L. This effluent is also leading to contamination as it is also being discharged into natural water streams [7]. Taking a tough stance on Phenol, World Health Organization has prescribed a stringent limit of 1mg/L as the maximum permissible concentration in drinking water [8].
Due to rapid Industrial growth, water pollution has paved its way into in this hill state of Himachal Pradesh. Out of a total of 39512 Industries, 39018 are Small Scale and 494 Medium and Large Scale industrial units. Due to such a large number of Industries, a huge amount of chemicals are discharge as part of the effluents. This leads to contamination of groundwater as well as other natural water sources. In the groundwater quality survey undertaken by the Central Pollution Control Board in1995, 20 locations were identified in various states of India as critical sites of ground water pollution. Phenolic compound exceeded the toxic limit in the industrial area of Kala Amb, Himachal Pradesh. Presence of Phenolic compounds beyond the toxic limit points towards an alarming situation and invites immediate attention for its control using suitable methodology.
It is the need of the hour is to control this menace of water contamination using the available scientific techniques. One of the economic technologies available is the adsorption technology. It is currently being used extensively for the removal of various organic and inorganic contaminants from the aqueous phase. Adsorption using activated carbon is developing g as one of the most economic and viable tool in water & waste water purification [9]. Activated Carbons (ACs) with high surface area and porosity have been widely used as an adsorbent in water purification, air and gas purification [10-12].
ACs can be prepared from different sources i.e. many organic materials having a high content of carbon like Palm Kernel [13], Corn stalk [14], Shaddock Peel [15], Coconut Shell [16], Orange Peel [17], Walnut Shells [18], Wood [19], Areca Nut Waste [20], Mango Nuts [21], Almond Shells [22], Date Stones [23], Sugarcane baggase [24], Eucalyptus wood [25] and Cotton Stalk [26] have been used as sources for ACs production.
The use of poplar carbon for adsorption and removal of various contaminants do find its mention. But, there is not much reference for the removal of phenol and its derivatives on activated carbon from poplar tree. The use of poplar tree for phytoremediation is quite common across the globe [27].
Keeping in view the emerging water contamination situation in the industrial area of Himachal Pradesh, the current study ventures to come up with an economically viable and inexpensive method of remediation. As poplar cultivation is extensively carried out in this region of India, its utilization as a source of activated carbon as well as an adsorbent for removal of contaminants from water and waste water is the main objective of the present study.
Experimental Procedures
Adsorbent
Poplar wood activated carbon used in this study was procured from local supplier i.e. Anand Carbons, Jalandhar. This carbon was dried in oven at 110ºC for 3 hours.The carbon was then activated using various chemicals activation agents and dried at 110ºC. The different chemical activating agents used were sulphuric acid, phosphoric acid, zinc Chloride, acetic acid, nitric acid, hydrochloric acid and sodium Hydroxide. Different chemical agents have different effect on the physiochemical properties of the activated carbon. Phosphoric acid acts as a catalyst and assists in the cleavage of bonds, hydrolysis, dehydration and condensation. Further, the volume occupied by Phosphoric acid is contemporaneous with the micropore volume [28]. Zinc Chloride is one of the widely applied activating agents which not only helps in degradation of the material but also brings about dehydration which supports the process of charring which is subsequently followed by aromatization of carcass of the carbon. The cumulative effect eventually forms the pore structure in the activated carbon [29]. Acids used in activation, result in oxidation and hence effect the structure of the activated carbon by not only enhancing the acidic properties, but also by removing the mineral elements as well as unwanted impurities present in the carbon. Furthermore, it also adds to the surface properties by making it more hydrophilic [30]. All the above activated carbons (both raw and chemically activated carbons) were used as adsorbent for the adsorption of phenol.
Adsorbate
Stock aqueous solution of 3000 mg/L was prepared by dissolving phenol in distilled water. The stock solution was further diluted with distilled water to obtain desired concentrations ranging from 500 mg/L to 3000 mg/L. All the chemicals used were of analytical reagent grade and obtained from Merck, India.
Batch mode adsorption studies
Stock solution of the adsorbate was diluted as required to obtain standard solutions containing 3000 ppm of phenol. A 500 mg of adsorbent was added to 25 ml of phenol solution of a desired concentration in 100 ml stoppered conical flask. The flasks were manually agitated at specified frequency after every 10 minutes at room temperature (25 ± 2°C). At the end of agitation, suspensions were separated by filtration and analyzed for their phenol content.
From phenol concentration measured before and after adsorption (Ci and Ce respectively), dry weight of the adsorbent (W) and the volume of aqueous solution (V in litre), the amount of equilibrium adsorption of phenol (qe) was calculated using the Equation (1):
qe (mg/g)= (Ci-Ce) v/w (1)
Ci is the initial concentration and Ce is the equilibrium concentration. The removal percentage (R %) is defined as the ratio of difference in adsorbate concentration before and after adsorption (Ci–Ce) to the initial concentration of phenol in the aqueous solution (Ci) was calculated using the Equation (2).
R(%) = (Ci-Ce)*100/Ci (2)
Kinetics and equilibrium experiments
Kinetics and equilibrium experiments were carried out using the batch mode technique. Adsorption experiments were carried out by shaking occasionally 0.5gm of H3PO4 activated carbon with 25 ml of phenol solution at 30ºC. Ultra Violet Spectrophotometer (Chemmito 2500) was used to determine the residual concentration of phenol at 270 nm. Replicate samples were analysed along with blank samples.
Effect of temperature, pH and adsorbent dose
Effect of temperature was studied using 0.5 g of adsorbent at 15, 25 and 35ºC.The samples were shaken occasionally and the residual phenol concentration was monitored regularly till equilibrium was attained.
All the carbons i.e. (Chemically activated carbons along with their untreated precursors) were taken in an amount of 0.5 gm. 25 ml of the phenol solution (1000 mg/L-1) was added to it. The residual phenol concentration was monitored on regular intervals till it reached equilibrium.
Effect of pH was also studied using Phenol solution at different pH. Different pH were maintained using dilute HCl and NaOH by means of a pH meter (Microprocessor) of Linco Scientific Instruments and Chemicals Pvt. Ltd., Ambala cantt. Effect of adsorbent dose was also studied by agitating 50 ml of 1000 mg/L of phenol solution with 0.5 gm dose of activated carbon.
Desorption studies
The adsorbent (0.5 gm/25 ml) that was used for the adsorption of 1000 mg/L of phenol solution at normal pH was gently washed with distilled water to remove any unadsorbed phenol. Many such samples were prepared. Then the spent adsorbent was mixed with 25 ml of distilled water at pH values varying from pH 3 to 13. The pH was adjusted using HCl and NaOH solutions and agitated at time intervals even beyond the equilibrium time. Then the desorbed phenol was estimated as before.
Results and Discussion
Effect of activating agent
The preliminary studies were done to see the effect of activating agent. The adsorption of phenol by all the activated carbons activated by different chemical agents was analysed and the carbon showing maximum adsorption was chosen for further studies.
Among all the carbons, phosphoric acid treated carbon showed the highest adsorption and was chosen for further studies. Though, the surface area of PAAPWC is lesser as compared to HCAAPWC, NAAPWC and ZCAPWC, yet it shows maximum adsorption. Zinc chloride produces activated carbon with higher specific area than that produced by using phosphoric acid [31]. However, phosphoric acid activation is widely preferred over zinc chloride because ZnCl2 has bad environmental impact and the activated carbon produced when using it cannot be used in the food and pharmaceutical industries [32].
Effect of contact time on adsorption
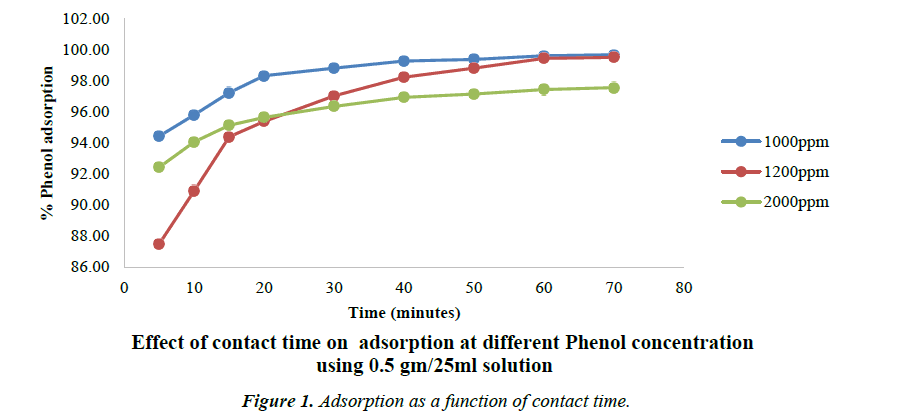
The Figure 1 shows the effect of contact time on the removal of phenol by all the Phosphoric acid activated carbon as well as their precursors. It is clear from the figure that the rate of phenol adsorption on the activated carbon surface is higher in the initial stages and then it gradually reduces and becomes constant after 80 min. This may be due to availability of higher number of vacant sites at the initial stage. This further implies that for complete removal of phenol a very short residence time is required which is far better than many carbons. This equilibrium time i.e. 80 min is significantly lesser as compared to 160 min that has been reported by Suneel Kumar and co-workers for activated carbon from Tamarindus indica wood [33].
Following concentrations were used for studying the process of adsorption while changing the concentration of phenol. The Concentration of phenol is varied from 1000 mg/l to 2000 mg/l. The carbon dose is maintained at 0.5 gm/25 ml of phenol solution.
Effect of pH on adsorption
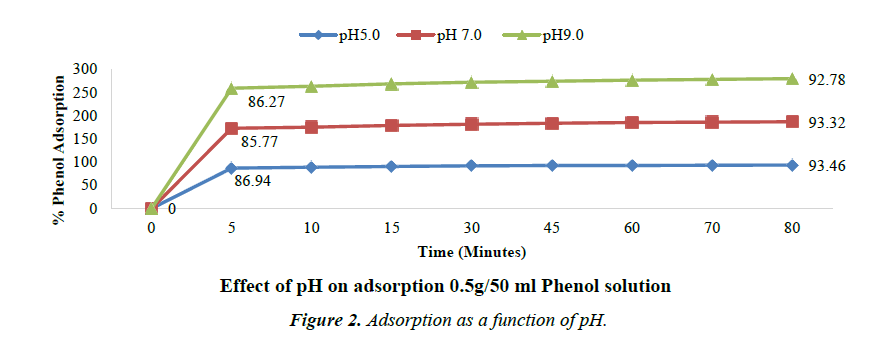
The effect of pH on the removal of phenol is shown in the following Figure 2. The percent removal slightly decreased with increase in pH [34].
Although, maximum removal/adsorption efficiency is observed at pH 5, there is observed almost same adsorption percentage in the pH range of 5 to 7. It can be inferred that acidic pH is favourable for adsorption. Similar results for optimum pH of adsorption were also obtained by Vinod V.P. and Anirudhan T.S. [35,36].
Phenol shows significant solubility in acidic water and it exists in molecular state in acidic or neutral medium. In such medium, the activated carbon surface has higher affinity for adsorption. While in alkaline medium, Phenol exists in ionic state and such medium is not conducive and has low affinity to adsorption. Moreover, in alkaline medium the presence of OH- ions on the adsorbent prevents the uptake of phenolate ions. At higher pH, the carbon surface acquires negative charge due to the adsorption of OH- ions and also due to dissociation of polar acidic functional groups on the carbon surface [37].
Effect of temperature on phenol adsorption
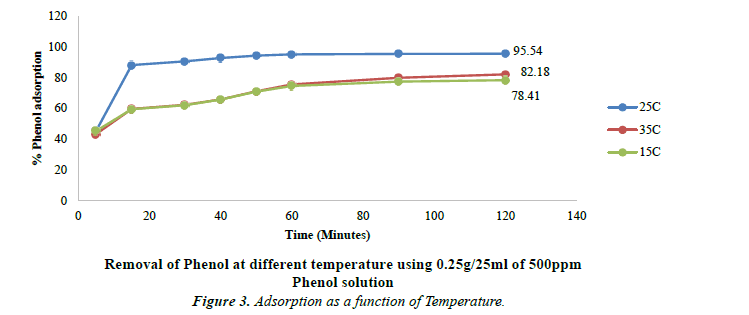
Temperature plays significant role in the process of adsorption. Influence of temperatures on the removal efficiency of phenol at three different temperatures was studied. Three different temperatures i.e. 15ºC, 25ºC and 35ºC were maintained to study the adsorption of phenol. There is an increase from 15ºC to 25ºC. When the temperature was further raised to 35ºC, there is observed decrease in Phenol adsorption. The optimum temperature for maximum adsorption is found to be 25ºC. At lower and higher temperatures, there is low adsorption.
The removal efficiency decreases from 95.54% at 25ºC to 82.19% at 35ºC. These results as shown in Figure 3 have been found similar to the one obtained by Dorra Tabassi and coworkers where the removal efficiency decreased from 80.19% at 25ºC to 72.98% at 40ºC [38].
Effect of adsorbent dose
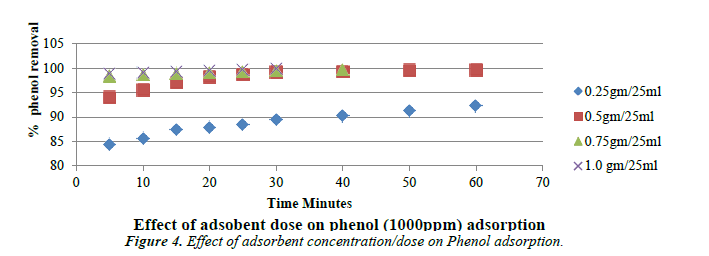
The following Figure 4 shows the removal of phenol as a function of carbon dosage at the solution of pH of 5. Carbon dosage was varied from 0.25 g to 1 g. It is evident that for the quantitative removal of 1000 mg/L-1 of phenol in 25 ml that the removal efficiency increases up to the optimum dosage beyond which the removal efficiency is negligible.
With increase in adsorbent concentration, the removal efficiency of phenol also increases [39].
Adsorption isotherm
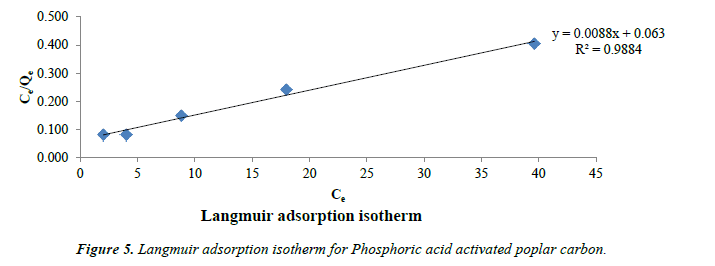
Langmuir model: Langmuir models were applied for adsorption equilibrium as shown in Figure 5. Langmuir isotherm has been widely applied and this model suggests a monolayer adsorption with no lateral interaction between the sorbed molecules [40].
Langmuir equation is expressed
Ce/qe = 1/Q0 b + Ce/Q0 (1)
Where qe is the solid-phase adsorbate at equilibrium (mg/g). Ce is the concentration of phenol solution (mg/L) at equilibrium. The constant Q0 gives the theoretical monolayer adsorption capacity (mg/g) and b is related to the energy of adsorption (mg/L). Plot of Ce/qe and Ce gives a straight line with slope 1/Q0 and intercept 1/Q0b. The essential characteristics of the Langmuir isotherms can be expressed by a dimensionless constant called equilibrium parameter RL [41].
RL = 1 / (1+bC0) (2)
Where b is the Langmuir constant and C0 is the initial concentration (mg/g), RL values indicate the type of isotherm. Favorable adsorption is indicated by RL values between 0 and 1.
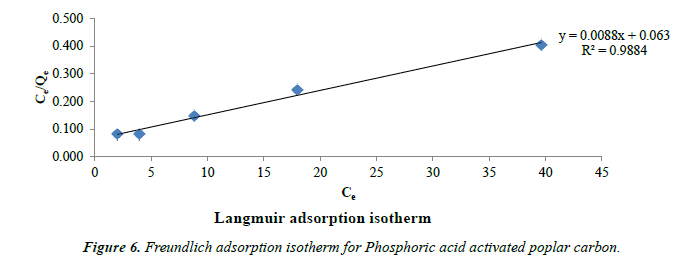
Freundlich’s model: Freundlich’s model assumes heterogeneous adsorption due to the diversity of sorption sites or the diverse nature of the adsorbed, free or hydrolyzed species [42]. The following Figure 6 shows Freundlich isotherm.
The Freundlich’s isotherm model is expressed as
Log qe = log kf + 1/n log Ce (3)
Where kf and 1/n are the constants that can be related to adsorption capacity and the intensity of adsorption. The values of n lies between 1 and 10 indicating favourable adsorption [43]. The calculated value of n for the adsorption of Phenol is 2.4 which shows good efficiency for phenol adsorption by this acid activated poplar wood carbon (Table 1).
| Freundlich Isotherm model | Langmuir Isotherm model | |||||
|---|---|---|---|---|---|---|
| Type of carbon with Conc. of Phenol (mg/L) | R2 | Kf (mg/g)(l/mg)1/n | 1/n | Q0 (mg/g) | b (L/mg) | R2 |
| SAAW-300C 100ppm | 0.9155 | 22.53 | 0.4182 | 113.6 | 15.9 | 0.9884 |
Table 1. Langmuir and Freundlich Constants for the adsorption of Phenol on activated carbon.
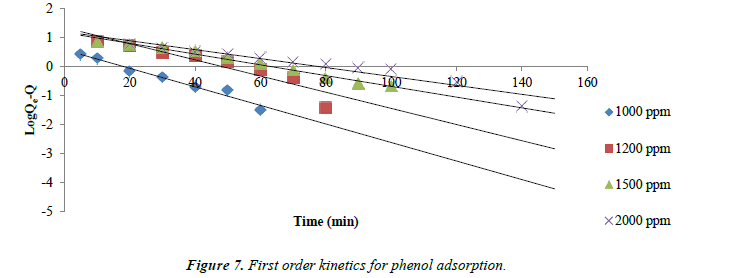
Adsorption kinetics: The kinetics of phenol adsorption on all the three types of Carbons follows the first order rate expression.
log (qe-q) =log qc – k1t/2.003
Where qe and q are the amounts of phenol adsorbed (mg/g) at equilibrium and at time t respectively. The straight line plot of log (qe-q) versus t indicates the adsorption process follows first order kinetics. Values of qe and k1at different concentrations were calculated from the slope and intercept of the plots of log (qe-q) versus t.
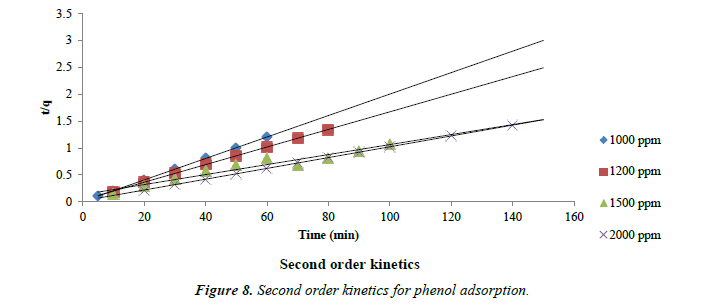
The kinetic data obtained from the batch studies were analyzed by using pseudo-first-order and pseudo-second-order kinetic models. Adsorption data as shown in Figures 7 and 8 for first and second order kinetics respectively fitted the pseudo-secondorder model better with correlation coefficients (R2) greater than for the first order kinetics.
Conclusion
The adsorption of phenol from aqueous solution by activated carbon produced from poplar tree wood was investigated using batch mode studies. The Process parameters i.e. pH, adsorbent dose, initial concentration and temperature were optimized. It was seen that the sorption maximum was obtained at pH 5.The optimum temperature for efficient and maximum removal of Phenol was found to be 25ºC. Though adsorption efficiency increased from lower temperature to higher temperature i.e. up to 25ºC, there was observed decrease in adsorption efficiency with further increase in the temperature. The Equilibrium data fitted well in both Langmuir and Freundlich’s Models. The adsorption capacity of phenol uptake was found to increase with increase in solution concentration and contact time.The equilibrium time was found to be 60 min to 80 min for 500 ppm, 1000 ppm and 3000 ppm phenol solution. Among the kinetic models applied, pseudo-second order model fitted well. The activated carbon shows quite high adsorption capacity of 662 mg/gm.
Considering the results, it can be said that adsorption of phenol from wastewater using activated carbon generated from poplar tree wood is technologically viable, cost effective and environmentally compatible as well as environment friendly process.
Moreover, the raw material i.e. poplar tree wood is abundantly available in northern India due to its large cultivation. As a result of its wide use in the timber industry, lot of scrap waste is also generated which is easily available too. Therefore, the preparation of activated carbon from poplar tree wood followed by its subsequent activation using chemical method seems to be very economical. The low-cost nature of poplar wood carbon braced with above encouraging results, acclaims poplar tree wood as an effective and efficient adsorbent for removal of phenol from water and wastewater.
References
- Bansal, RG, Donnet, JB, Stoieckly F. Active carbon, New York : Marcel Dekker. 1988.
- Mathur, RS, Sharma KK. In: R.S. Mathur (Editor), Poplar Special No 1. Indian For. 1983;109(9):589-695.
- Newman SM. Poplar agro forestry in India. Forest Ecology and Management.1997;13-7.
- USEPA. Federal Reegister, Washington DC. 1987;52:25861-962.
- Vermeulen A, Welvaret K, Vercammen J. Evaluation of a dedicated gas chromatography-mass spectrometry method for the analysis of phenol in water. J Chromatogr A. 2005;1071:41-6
- Integrated Pollution Prevention and Control (IPPC). Reference document on best available techniques for mineral oil and gas refineries. Seville, Spain, European Commission, Directorate general-JRC .Joint Research Centre. 2001.
- Singer PC, Chen YY. Active Carbon- Adsorption of Organics Phase, Vol. 1, I.H. Suffet and M.J. McGuire, eds. Ann Arbor Science, Michigan. 1980;167.
- Nuhoglu N., Yalcin B. Modeling of phenol removal in a batch reactor” Process Biochem. 2005;40:1233-9.
- Gupta VK, Ali I. Adsorbents for water treatment: Low cost alternatives to carbon. Encyclopedia of Surface and Colloid Science, Marcel Dekker, New York. 2003;1–34.
- El-Sheikh AH., Newman AP, Al-Daffaee HK, et al. Characterization of activated carbon prepared from a single cultivar of Jordanian Olive stones by chemical and physicochemical techniques. J. Anal. Appl. Pyrolysis. 2004;71:151–64.
- Hassler JW. (1974) .Purification with Activated Carbon: Industrial, Commercial and Environmental. Chemical Publishing Company Inc., New York, N.Y. 1974.
- Matson JS, Mark HB. Activated Carbon: Surface Chemistry and Adsorption from Solution. Marcel Dekker Inc., New York.1971.
- Hidayu AR, Muda N. Preparation and characterization of impregnated activated carbon from palm kernel shell and coconut shell for CO2 capture. Procedia Engineering.2016;148:106 – 113.
- Yang D, Jiang L, Yang S, et al. Experimental Study on Preparation of Straw Activated Carbon by Microwave Heating. Procedia Engineering.2017;205:3538–44.
- Li B, Sun L, Xue J, et al. Adsorption of phenol from water on activated carbon prepared from shaddockpeel by ZnCl2 and H3PO4: equilibrium, kinetics and thermodynamics. Desalination and Water Treatment. 2017;58:181–91.
- Ahmed S, Mada VV, Kamath V, et al. Characterization of Activated Carbon Prepared from Coconut Shell using Various Reagents for a Low Cost Water-Filter. International Journal of Engineering Science and Computing. 2017;7(4):10382-8.
- Ribeiro LAS, Rodrigues LA, Thim GP.(2017) “Preparation of activated carbon from orange peel and its application for phenol removal” International Journal of Engineering Research & Science.2017;3(3):122-9.
- Mijan AA, Taufiq-Yap YH. Preparation of activated carbon from walnut shell doped La and Ca catalyst for Biodiesel production from waste cooking oil. Material Science forum. 2016;840:348-52.
- Veksha A, Bhuiyan TI, Hill JM. Activation of Aspen Wood with Carbon Dioxide and Phosphoric Acid for Removal of Total Organic Carbon from Oil Sands Produced Water: Increasing the Yield with Bio-Oil Recycling Materials. 2016;9:20.
- Lalhmunsiama, Lee SM, Choi SS, Tiwari D. Simultaneous Removal of Hg(II) and Phenol Using Functionalized Activated Carbon Derived from Areca Nut Waste Metals. 2017;7:248.
- Kwaghger A, Ibrahim JS. Optimization of Conditions for the Preparation of Activated Carbon from Mango Nuts using HCl. American Journal of Engineering Research.2013;2(7):74-85.
- Omri A, Benzina M. Almond shell activated carbon: adsorbent and catalytic support in the phenol degradation. Environ Monit Assess. 2014;186(6):3875-90.
- Pasalari H, Ghaffaria HR, Mahvia AH, et al. Activated carbon derived from date stone as natural adsorbent for phenol removal from aqueous solution. Desalination and Water Treatment. 2017;72: 406–17.
- Bachrun S, Rizka NA, Annisa SH, et al. Preparation and characterization of activated carbon from sugarcane bagasse by physical activation with CO2 gas. International Conference on Engineering and Technology for Sustainable Development (ICET4SD) 2015, 11–12 November 2015 Yogyakarta, Indonesia. 2016;105.
- Amaya A, Corengia M, Cuña A, et al. Preparation of Charcoal Pellets from Eucalyptus Wood with Different Binders. Journal of Energy and Natural Resources. 2015;4(2):34-9.
- Prabhu P, Raghu K. Synthesis and characterization of cotton stalk activated carbon by chemical activation using H3PO4. International Journal of Advanced Science and Research. 2017;2(5):93-7.
- Chapple J. Phytoremediation of TCE in Groundwater using Populus. Status Report prepared for the U.S. EPA Technology Innovation Office under a National Network of Environmental Management Studies Fellowship.1997.
- Zuo S, Yang J, Liu J, et al. Significance of the carbonization of volatile pyrolytic products on the properties of activated carbons from phosphoric acid activation of lignocellulosic material. Fuel Processing Technology. 2009;90(7-8):994-1001.
- Caturla F, Molina-Sabio M, Rodriguez-Reynoso F. Preparation of activated carbon by Chemical activation with ZnCl2 carbon. 1991;29(7):999-1007.
- Bazu?a PA, Lu AH, Nitz JJ, et al. Surface and pore structure modification of ordered mesoporous carbons via a chemical oxidation approach. Microporous Mesoporous Mater. 2008;108: 266-75
- Okada K, Yamamoto N, Kamshima Y, et al. Porous properties of activated carbons from waste newspaper prepared by chemical and physical activation. J. Coll. Inter. Sci. 2003;262:179-93.
- Srinivasakannan C, Abu-Baker MZ. Production of activated carbon from rubber wood sawdust. Biomass Bioenergy in press.
- Kumar S, Mohanty K, Meikap BC. Removal of phenol from dilute aqueous solutions in a multistage bubble column adsorber using activated carbon prepared from Tamarindus indica wood. J. of Env. Prote. Sci. 2010;4:1-7.
- Arcand Y, Hawari J, Guiot SR. (1995) “Solubility of pentachlorophenol in aqueous solutions”Water Res., 29, 131–136.
- Vinod VP, Anirudhan TS. Effect of Experimental Variables on Phenol adsorption on Activated carbon prepared from Coconut Husk by Single step Steam pyrolysis: Mass transfer process and Equilibrium Studies. Journal of Scientific & Industrial Research. 2002;61:128-38.
- Kannepalli S. Binary adsorption of Phenol & Resorcinol onto granular Acivated carbon. A dissertation of M. Tech. in Chemical Engineering, Dept. of Chemical Engineering, IIT, Roorkee. 2010.
- Grant TM, King CJ. Mechanism of irreversible adsorption of Phenolic compounds by activated carbon. Ind. Eng. Chem. Res. 1990;62:47–57.
- Tabassi D, Harbi S, Louati I, et al. Response surface methodology for optimization of Phenol adsorption by activated carbon” Indian J. of Chem. Tech. 2017;24:239-55.
- Tezcan UU, Gul A. Removal of Phenol by Adsorption” International Journal of Advances in Science Engineering and Technology. 2017;5(2).
- Langmuir I. The adsorption of gases on plane surfaces of glass, mica and platinum. J. Am. Chem. Soc. 1918;40:1362-403.
- Hall KR, Eagleton LC, Acrivos A. Pore and solid diffusion kinetics in fixed bed adsorption under constant pattern conditions. Ind. Eng. Chem. Fundam. 1996;5:212-23.
- Freundlich H. Uber Died. Adsorption in hosungen. Z. Phys. Chem. 1906;57:387-470.
- Slejko F. Adsorption technology a step by step approach to process evaluation and application. Maud Decker. 1985.
