Research Article - Biomedical Research (2018) Volume 29, Issue 4
Biomarkers screening and related functions identification for spinal cord injury based on guilt-by-association
Chun Shan Zheng1, Hui Qin Sun2, Xiao Mei Dong3, Ping Li1 and Fuqiang Wang4*
1Department of Traumatic Orthopedics, Shouguang People Hospital, No. 1233, Jiankang Street, Shouguang, Weifang, Shandong, PR China
2Drug Dispensing Center, Shouguang People Hospital, No. 1233, Jiankang Street, Shouguang, Weifang, Shandong, PR China
3Department of Obstetrics, Shouguang People Hospital, No. 1233, Jiankang Street, Shouguang, Weifang, Shandong, PR China
4Department of Orthopedics, Lanshan Dist. People's Hospital of Linyi City Shandong Province, No.11, Kaopeng Street, Lanshan District, Linyi City, Shandong Province, PR China
- *Corresponding Author:
- Funqiang Wang
Department of Orthopedics
Lanshan Dist. People's Hospital of Linyi City Shandong Province
PR China
Accepted date: November 26, 2017
DOI: 10.4066/biomedicalresearch.29-17-3048
Visit for more related articles at Biomedical ResearchAbstract
Objective: The aim was to research Spinal Cord Injury (SCI) related genes and functions for postoperative recovery and complications and prevention.
Methods: E-GEOD-18179 was used to screen Differently Expressed Genes (DEGs) between SCI samples and controls. Adjacency matrix was constructed as gene co-expression network. Sub-network was identified based on spearman correlation coefficient. Assortativity coefficient was calculated to represent the relationship among nodes. Gene Ontology (GO) functional enrichment was processed and guilt-byassociation was undertaken.
Results: Total 129 DEGs were obtained and Adjacency matrix with 129 × 129 genes was constructed. There into, TYROBP and MIA were with weight of 0.9695. Total 129 genes were enriched in 127 GO terms, such as molecular function and catalytic activity. K terms and related AUC values were obtained. The guilt-by-association node degrees AUCs were generated. In addition, the optimal list genes were obtained, such as JUN and PTK2B. Finally, optimal GO terms were obtained, such as regulation of signal transduction, positive regulation of macromolecule metabolic process and cellular component organization.
Conclusion: Screened genes including JUN, PTK2B, CCND1 and ADAM8 might be potential genes for SCI postoperative recovery and complications and prevention.
Keywords
Spinal cord injury, Guilt-by-association, Differently expressed genes, Functions, Adjacency matrix
Introduction
Spine is a group of nerves which is protected by the individual vertebrae of the spine [1]. The main function of spin cord is to send signals from the brain to other regions [2]. Spinal Cord Injury (SCI) can be classified into complete injury and incomplete injury, which was with different symptoms, such as pain, numbness, paralysis to incontinence and even quadriplegia [3]. Moreover, various complications may occur, including muscle atrophy, pressure sores, infections and respiratory problems.
In 2006, Schmitt et al. [4] found that different degree of recovery was showed in different strains of rats, and difference in functional recovery was closely related with gene expression after SCI. In Wistar rats with high-level SCI, α1-adrenergic receptors gene were a contributing factor for hypertension [5]. Moreover, EPH Receptor A4 (Epha4) was confirmed to be related with deprenyl, which was found to protect nervous system by regulating the expression of p75NTR and TrkB after SCI [6].
Though various genes were researched, recovery and complication were not well controlled. The changes of genes after spinal cord injury were complexly and closely interacted. Gene Ontology was an effective method to describe the function of genes. In addition, Gene Ontology (GO) function was introduced to gene expression network, which could functionally classify the network. In order to research SCI related genes and functions with integrality; guilt-by-association was used in this study to increase the statistical reliability of GO terms. It might lay a foundation for SCI treatment and complication prevention.
Materials and Methods
Microarray data acquiring and preprocessing
Raw microarray profile of E-GEOD-18179 including 32 spinal cord injury samples and 30 controls were obtained from Array Express database with the platform of A-AFFY-6-Affymetrix GeneChip Murine Genome U74Av2 (MG_U74Av2). Random Multiple Access (RMA) algorithm was processed for raw data preprocessing with 3 steps: background correction, replicated probes removing and standardization [7]. After mapping probes to genes, gene expression profile was obtained.
Differently expressed genes screening
The expression levels of genes in gene expression profile were calculated by limma package, and examined by T-test and Fisher exact test. LmFit function was used for linear fitting, expected Bayesian estimation (eBayes) was processed for statistics and FDR was corrected p value. The threshold of DEGs was |logFC|>0 and p<0.05.
Co-expression network of DEGs
Adjacency matrix was constructed as gene co-expression network. Spearman correlation coefficient between two genes was calculated. Based on the strength of relationships, adjacency matrix was constructed. Nodes of sub-network were identified with the threshold of spearman correlation coefficient>0.8 and degree>1.
Density of node degree
Based on the occurrence of degree, R package was used to show the density of node degree. Assortativity coefficient was a kind of Pearson correlation coefficient based on degree. The results of assortativity coefficient represented the relationship among these nodes. Positive value represented synergetic relationship of nodes with same degrees, while negative value represented a link between nodes with different degrees. Normally, the value of assortativity coefficient ranged from -1 to 1.1 represented assortativity pattern, 0 represented non-assortativity pattern and -1 represented negative relationship.
GO functional enrichment analysis
A total of 18421 GO terms with 18402 genes were downloaded from GO consortium. Screened DEGs were enriched in GO terms, and enriched GO terms with more than 20 genes were screened.
Inference analysis of network correlation
Gene i in gene co-expression network was selected and all genes except i were enriched in K terms. MF values of each gene i were calculated by following formula:
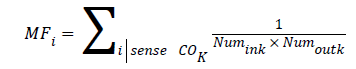
Numink represented numbers of neighbor genes in K terms and Numoutk represented numbers of neighbor genes which did not exist in K terms.
Three times folding method was used to calculate AUC value of K terms, then average AUC was calculated and evaluated for each GO function.
Based on emergent frequency of genes, cool read was processed to evaluate these predicted functions. If a fine AUC was obtained, the GO term was a good candidate with differently expressed genes. Finally, the most excellent gene list was generated. Then, the most excellent gene list was used to predict GO terms and AUCs were obtained. GO terms with AUC more than 0.6 were screened.
Results
Acquisition of gene expression profile and DEGs screening
After mapping probes to genes, gene expression profile with 8713 genes was obtained. Based on the threshold of DEGs, a total of 129 DEGs were obtained, including Small Proline Rich Protein 1A (SPRR1A), Small Proline Rich Protein 1B (SPRR1B), Activating Transcription Factor 3 (ATF3), Desmoplakin (DSP) and Adenylate Cyclase Activating Polypeptide 1 (ADCYAP1).
Co-expression network of DEGs
Adjacency matrix with 129 × 129 genes was obtained. Based on the threshold of spearman correlation coefficient>0.8 and degree>1, a total of 84 correlations were obtained. There into, TYRO Protein Tyrosine Kinase Binding Protein (TYROBP) and Melanoma Inhibitory Activity (MIA) were with weight of 0.9695. Small Proline Rich Protein 1B (SPRR1B) and PDZ and LIM Domain 1 (PDLIM1) were with weight of 0.9760.
Density of node degree
Based on the occurrence of degree, density of node degree was shown in Figure 1. The degree of node ranged from 54 to 72. The median of these degrees was 64.7674. In addition, the assortativity coefficient of this density of node degree was 0.3422, which was confirmed that the subnetwork was with assortativity pattern.

Figure 1: Density of node degree. Note: The figure represents the frequency of appearance of each degree in network. The red line was the median of all node degrees.
GO functional enrichment analysis
A total of 129 genes were enriched in 127 GO terms (Table 1). Top 5 GO terms were molecular function, catalytic activity, binding, protein binding and cellular component. Various genes were enriched in molecular function, such as Activating Transcription Factor 3 (ATF3), Desmoplakin (DSP), Adenylate Cyclase Activating Polypeptide 1 (ADCYAP1) and Jun Proto-Oncogene, AP-1 Transcription Factor Subunit (JUN). Similarly, different genes in catalytic activity included Tubulin Beta 6 Class V (TUBB6), ATP Binding Cassette Subfamily A Member 1 (ABCA1) and CCR4-NOT Transcription Complex Subunit 4 (CNOT4).
| GO. term | AUC | |
|---|---|---|
| 1 | GO: 0048513 | 0.680476 |
| 2 | GO: 0031325 | 0.674828 |
| 3 | GO: 0065008 | 0.663036 |
| 4 | GO: 0009893 | 0.662879 |
| 5 | GO: 0048583 | 0.662069 |
| 6 | GO: 0023051 | 0.658678 |
| 7 | GO: 0051239 | 0.657308 |
| 8 | GO: 0065009 | 0.65633 |
| 9 | GO: 2000026 | 0.654762 |
| 10 | GO: 0032879 | 0.646021 |
Table 1: Top 10 GO terms enriched by 129 genes.
Relevant inference and cool reading inference
Based on relevant inference analysis, K terms and related AUC values were obtained. As shown in Table 2, top 3 K terms were regulation of cell differentiation (GO: 0045595, degree=66.697, AUC=0.5767), positive regulation of macromolecule metabolic process (GO: 0010604, degree=66.6754, AUC=0.6539) and regulation of macromolecule metabolic process (GO: 0060255, degree=66.5429, AUC=0.6694). The guilt-by-association node degree AUCs were generated (Figure 2). The average of AUC was 0.52198. After cool read of K functions, cool read node degree AUCs were obtained (Figure 3). The average of cool read node degree AUCs was 0.5488. In addition, the optimal list genes were obtained, such as JUN (MF score=0.0338), PTK2B (Protein Tyrosine Kinase 2 Beta, MF. score=0.0322), CCND1 (Cyclin D1, MF. score=0.0323) and ADAM8 (ADAM Metallopeptidase Domain 8, MF. score=0.0319). Finally, optimal GO terms were obtained. Therein, top 3 optimal GO terms with higher AUC were regulation of signal transduction, positive regulation of macromolecule metabolic process and cellular component organization (Table 3).
| GO. term | Node. degree | AUC | Node. degree. AUC |
|---|---|---|---|
| GO: 0045595 | 66.69697 | 0.57672 | 0.64418 |
| GO: 0010604 | 66.6754 | 0.653968 | 0.655159 |
| GO: 0060255 | 66.5429 | 0.669384 | 0.663925 |
| GO: 0042221 | 66.51661 | 0.546755 | 0.645332 |
| GO: 0010468 | 66.39146 | 0.634354 | 0.642857 |
| GO: 0010556 | 66.3754 | 0.585337 | 0.628077 |
| GO: 0005615 | 66.35419 | 0.74127 | 0.62619 |
| GO: 2000112 | 66.31894 | 0.497619 | 0.623413 |
| GO: 0006355 | 66.30374 | 0.561728 | 0.619489 |
| GO:0051252 | 66.30374 | 0.496473 | 0.619489 |
Table 2: Top 10 K terms by relevant inference analysis.
| GO ID | Term | Domain | Guilt_by_association_go | Cool_read_go | Gene |
|---|---|---|---|---|---|
| GO: 0009966 | Regulation of signal transduction | Biological_process | 0.653968 | 0.680476 | Ptk2b, Edn1 Adm, Adcyap1, Sfrp1, Mllt3, AI464131, Sox11, Tnfrsf19, Gadd45a , Map4k2, Adam8, Atp6ap1, Crlf1 Fas, Ccnd1, Lgals3, Scg2, Rdh11, Igfbp2, Psap, Jun, Abca1 |
| GO: 0010604 | Positive regulation of macromolecule metabolic process | Biological_process | 0.691506 | 0.663036 | Edn1, Ccl2, Ptk2b, Cst3, Jun, Sox11, Hoxa7, Atf6, Adcyap1, Atf3 , Ccl3 , Crem, Foxo4, Sfrp1, Ank3, Star , Cdkn1a, Gadd45a, Map4k2, Adam8, Ccnd1, Crlf1, Fas, E330034, G19Rik |
| GO: 0016043 | Cellular component organization | Biological_process | 0.603535 | 0.662069 | Asf1a, Pom121, Jun, Mrps25, Gadd45a, Ttc17, Arpc5, Ptk2b, Rhou, Sfrp1, Dsp, Ccl2, Maea, Abca1, Stxbp1, Topbp1, Ank3, Ctss, Tubb6, Atp6, ap1, Fas, Mmp9, Gmnn, Adm, Plxna3, Adcyap1, Edn1, Adam8, Acan, Cst3, Lgals3, Mia |
| GO: 0050789 | Regulation of biological process | Biological_process | 0.600944 | 0.610714 | Hoxa7, Cdkn1a, Jun, Edn1, Ccl2 , Scg2, Ccnd1, Mmp12 , Sox11, Sfrp1, Igfbp2, Adcyap1, Adm, Atf3, Crlf1, Cst3, Ptk2b, Mmp9, Foxo4, Lgals3, Neu1 |
Table 3: Top 5 optimal GO terms.

Figure 2: Guilt-by-association node degree AUCs. Note: The figure was used to assess the average value of AUC. The red line was the median. The range between two grey lines was the inter-quartile range.

Figure 3: Cool read node degree AUCs. Note: The figure represent cool read node degree AUCs. The red line was the median. The range between two grey lines was the inter-quartile range.
Discussion
In most previous studies, microarray studies failed to research sufficiently the biological variability. Thereby, the validation rate was used within a system in this study to identify accurate genes and their interactional functions. In 2014, Ego network was firstly reported [8], which could screen potential biomarkers and lay the deeper foundation for breast cancer. Importantly, this method increased the prediction accuracy of gene functions with higher statistical confidence [9,10]. In addition, relevant inference and cool reading inference using make the functional enrichment prediction was with statistical confidence. Genes in same GO function were with preferential connection [10,11]. In this study, several genes including JUN, PTK2B, CCND1 and ADAM8 were screened and their related functions were identified.
JUN encoded a protein which was highly similar to the viral protein, and was confirmed to interact with specific target DNA sequences to regulate gene expression [12]. After cervical spinal cord injury, JUN expressed highest at 7 days, especially in axotomized medullary neurons [13]. Moreover, JUN could be re-induced by axonal regeneration after chronic spinal cord injury [14]. Vinit et al. [15] also confirmed that after SCI, there were difference between molecular cell body response of spared neurons and axotomized neurons because of the regulation of JUN. In other diseases, the expression level of JUN and its’ related pathways were confirmed to be closely associated with neuronal apoptosis and virus infection [16]. In addition, JUN N-terminal kinase-dependent was found to play important role in respiratory [17]. Besides, PTK2B was screened as a potential key gene of SCI. As we all known, PTK2B encoded a cytoplasmic protein tyrosine kinase, which was involved in calcium-induced regulation of ion channels and activation of the map kinase signaling pathway. Previous study showed that the common variant in PTK2B was related with late-onset Alzheimer’s disease [18]. Liu et al. [19] researched ion channel blockers and found that ion channel blockers were effective on SCI treatment but with complex effects. Interestingly, the inhibitor of acid-sensing ion channels could significantly decrease neurological deficits following SCI [20]. In larval lamprey, SCI could induce changes of ion channels of reticulospinal neurons [8]. Thereby, JUN and PTK2B might be potential targets for SCI postoperative recovery and complications and prevention.
Two other genes, CCND1 and ADAM8 were screened as optimal list genes in this study. CCND1 encoded a protein which belongs to the highly conserved cyclin family, whose members were characterized by a dramatic periodicity in protein abundance throughout the cell cycle [21]. In previous study, CCND1 was found to be targeted by mir-195, which suppressed metastasis of osteosarcoma cells. In addition, et al. found that mir-19a was related with various genes of chondrogenic differentiation, such as CCND1 [22]. In addition, CCND1 genomic amplification was occurred during malignant transformation of a cell tumor of bone [23]. Similarly, ADAM8 encoded a protein which might be involved in cell adhesion during neurodegeneration [24]. In adult SCI mice models, ADAM8 was upregulated in endothelial cells, and also related with angiogenesis [25]. Thereby, both CCND1 and ADAM8 might be important genes for SCI postoperative recovery and complications and prevention.
In this study, these screened genes enriched in optimal GO terms, including regulation of signal transduction, positive regulation of macromolecule metabolic process and cellular component organization. Quan et al. [26] found that acupuncture could activate signal transduction and further promote the repair of SCI. After SCI, signal transduction of erythropoietin receptor was also confirmed to inhibit apoptosis of neuron cells [27]. Besides, Zhao et al. [28] also found that multitude gene signal transduction was contribution to the development of neural stem cells after SCI. Though various macromolecules can’t be used with the limitation of across blood spinal cord barrier, the functions of these macromolecules for SCI recovery couldn’t be ignored [29]. In rat models, convective delivery of macromolecules was used as an effective treatment method for injury or spinal cord disease [30]. It was worth noting that Fehlings et al. [31] have obtained remarkable advances in recruiting cell therapy for SCI. Besides, cellular transplantation could replace the lost elements, and further regulate cell functions after SCI [32].
Conclusion
In this study, relevant inference and cool reading inference using make the functional enrichment prediction was with statistical confidence. Screened genes including JUN, PTK2B, CCND1 and ADAM8 might be potential targets for SCI postoperative recovery and complications and prevention. Various GO terms, such as regulation of signal transduction, positive regulation of macromolecule metabolic process and cellular component organization, were important in these processes.
Acknowledgements
None
References
- Cholas RH. Collagen implants to promote regeneration of the adult rat spinal cord. Massachusetts Inst Technol 2006.
- Khalid F, Tummala S, Singhal T. The role of the spinal cord as an adjunct to the brain in the MRI definition of no evidence of disease activity in multiple sclerosis. Neruol J 2016.
- Rathore FA, Ayub A, Farooq S. Suicide bombing as an unusual cause of spinal cord injury: a case series from Pakistan. Spinal Cord 2011; 49: 851-854.
- Schmitt C, Miranpuri GS, Dhodda VK. Changes in spinal cord injury-induced gene expression in rat are strain-dependent. Spine Off J N Am Spine Soc 2006; 6: 113.
- He XY, Shi XY, Yuan HB. Changes in alpha2-adrenergic receptors gene expression after high-level spinal cord injury in Wistar rats. Chinese Crit Care Med 2008; 20: 649.
- Heshmati M, Delshad AA. Changes in gene expression of P75 and Trk receptors in deprenyl-treated spinal cord injury rats. World Appl Sci J 2013.
- Carvalho B, Bengtsson H, Speed TP. Exploration, normalization, and genotype calls of high-density oligonucleotide SNP array data. Biostatistics 2007; 8: 485.
- Yang R, Bai Y, Qin Z. EgoNet: identification of human disease ego-network modules. BMC Genom 2014; 15: 314.
- Gillis J, Pavlidis P. The role of indirect connections in gene networks in predicting function. Bioinformatics 2011; 27: 1860-1866.
- Gillis J, Pavlidis P. The impact of multifunctional genes on guilt by association analysis. PLoS One 2011; 6: 17258.
- Verleyen W, Ballouz S, Gillis J. Measuring the wisdom of the crowds in network-based gene function inference. Bioinformatics 2015; 31: 745-752.
- Bragazzi NL, Nicolini C. A leader genes approach-based tool for molecular genomics: from gene-ranking to gene-network systems biology and biotargets predictions. J Comp Sci Sys Biol 2013; 6: 165-176.
- Vinit S, Boulenguez P, Efthimiadi L. Axotomized bulbospinal neurons express c-Jun after cervical spinal cord injury. Neuroreport 2005; 16: 1535.
- Houle J, Schramm P, Herdegen T. Trophic factor modulation of c-Jun expression in supraspinal neurons after chronic spinal cord injury. Exp Neurol 1998; 154: 602-611.
- Vinit S, Darlot F, Aoulaiche H. Distinct expression of c-Jun and HSP27 in axotomized and spared bulbospinal neurons after cervical spinal cord injury. J Mol Neurosci 2011; 45: 119-133.
- Feng WH, Kraus RJ, Dickerson SJ. ZEB1 and c-Jun levels contribute to the establishment of highly lytic Epstein-Barr virus infection in gastric AGS cells. J Virol 2007; 81: 10113-10122.
- Carimalo J, Cronier S, Petit G. Activation of the JNK-c‐Jun pathway during the early phase of neuronal apoptosis induced by PrP106-126 and prion infection. Eur J Neurosci 2005; 21: 2311.
- Li YQ, Tan MS, Wang HF. Common variant in PTK2B is associated with late-onszheimers disease: A replication study and meta-analyses. Neurosci Lett 2016; 626: 83.
- Liu WM, Wu JY, Li FC. Ion channel blockers and spinal cord injury. Journal of Neurosci Res 2011; 89: 791-801.
- Askwith C. The role of acid-sensing ion channels in spinal cord injury. Defense Tech Info Centre 2012.
- Surhone LM, Tennoe MT, Henssonow SF. Cyclin D. Cirrosis Hepa Tica 2011.
- Boyd LM, Richardson WJ, Chen J. Osmolarity regulates gene expression in intervertebral disc cells determined by gene array and real-time quantitative RT-PCR. Ann Biomed Eng 2005; 33: 1071-1077.
- Saada E, PeocH M, Decouvelaere AV. CCND1 and MET genomic amplification during malignant transformation of a giant cell tumor of bone. J Clin Oncol Off J Am Soc Clin Oncol 2011; 29: 86.
- Bartsch JW, Naus S, Rittger A. ADAM8/MS2/CD156a: a metalloprotease-disintegrin involved in immune responses. Adam Family Proteases 2005.
- Mahoney ET, Benton RL, Maddie MA. ADAM8 is selectively upregulated in endothelial cells and is associated with angiogenesis after spinal cord injury in adult mice. J Compar Neurol 2009; 512: 243.
- Quan R, Chen R, Du M. Anti-apoptotic signal transduction mechanism of electroacupuncture in acute spinal cord injury. Acup Med J Br Med Acup Soc 2014; 32: 463-471.
- Miyaguchi F, Yone K, Setoguchi T. Signal transduction of erythropoietin receptor for inhibiting neuron cell apoptosis after spinal cord injury. Spine J Meet 2007.
- Zhao B, Hua H, Bai DY. Role of gene signal transduction in neural stem cell differentiation and spinal cord injury repair. J Clin Rehab Tissue Eng Res 2008; 12: 10159-10162.
- Wood JD, Lonser RR, Gogate N. Convective delivery of macromolecules into the naive and traumatized spinal cords of rats. J Neurosurg 1999; 90: 115-120.
- Wood JD, Lonser RR, Gogate N. Convective delivery of macromolecules into the naive and traumatized spinal cords of rats. J Neurosurg 1999; 90: 115.
- Fehlings MG, Vawda R. Cellular treatments for spinal cord injury: the time is right for clinical trials. Neurother 2011; 8: 704.
- Barami K, Diaz FG. Cellular transplantation and spinal cord injury. Neurosurg 2000; 47: 691.