Research Article - Biomedical Research (2017) Volume 28, Issue 20
Analysis of mechanical properties at different levels of the periodontal ligament
Yu Yang and Wencheng Tang*
School of Mechanical Engineering, Southeast University, Nanjing, PR China
- *Corresponding Author:
- Wencheng Tang
School of Mechanical Engineering
Southeast University, PR China
Email: tangwc@seu.edu.cn
Accepted on October 27, 2017
Abstract
Background/Purpose: As a soft connective tissue, the Periodontal Ligament (PDL) exhibits material properties which are not the same at different levels. Study concerning the mechanical properties of human PDL was not reported in nanoindentation method with a flat punch.
Materials and Methods: A quantitative and a qualitative analysis for cervical margin, midroot and apex were made. According to the Oliver-Pharr theory, the mean value of the elastic modulus was calculated for each level. A generalized Kelvin model was used to fit the experimental load-displacement curve of the loading part at different levels, the model parameters were obtained by least-square method. The difference of stress distribution of the PDL for linear and viscoelastic model was compared with finite element method.
Result: In midroot section, the average elastic modulus ranges from 0.11 to 0.23 MPa, the range of the cervical margin and apex changed from 0.21 to 0.53 MPa, and 0.44 to 0.62 MPa, respectively. Apex section shows a higher creep compliance than that on the other two sections.
Conclusion: Experimental results indicate that average elastic modulus in midroot was lower than that at the cervical margin and the apex. The results derived with generalized Kelvin model agrees well with the test data, the stress in the PDL derived with viscoelastic model is lower than that with elastic model.
Keywords
Periodontal ligament, Elastic modulus, Viscoelastic model, Nanoindentation.
Introduction
PDL is a soft tissue that connects tooth root and alveolar bone, it transmits orthodontic forces to alveolar bone resulting in tooth mobility during orthodontic treatment [1,2]. According to literature, clinical orthodontic treatment is a long-term and iterative process, even accompanied with possible side effects. Furthermore, the magnitude of forces and moments is considered to be indeterminate and the biologic response to orthodontic forces is unknown [3,4]. Study of the material properties of PDL is important to determine the role of PDL in absorbing treatment load and increase the understanding of tooth movement under orthodontic loading.
The Finite Element Method (FEM) is an important tool to analyse orthodontic movement and distribution of stress and strain within teeth and the periodontium. In order to make the FEM analysis more reliable, accurate material property parameters are needed. Since the 1960s, a large number of researchers have measured the elastic modulus of the PDL through a series of experiments, such as uniaxial tensional [5,6], intrusion and extrusive test [7]. Other studies tried to investigate the distribution of stress and strain within the tooth and periodontium, with laser holography [8], optoelectronical set-ups [9], photoelastic models [10] and Electronic Speckle Pattern Interferometry (ESPI) [11]. In spite of the effort, the measured value of elastic modulus varies dramatically, of which the minimum value is 0.01 MPa, while the maximum value is 1750 MPa [12], which differed by a factor of 105. The differences may be attributed to the complexity of PDL's structure, differences of modeling assumptions for mechanical behavior and the impact of experimental conditions. The property model is needed for element analysis on PDL, many researchers assume it as a linear [13], bilinear [14] and nonlinear model [15] in finite element analysis. The viscoelastic constitutive models of time-dependent were shown to describe the creep and stress-relaxation behavior on various species. In the early stage, the most acceptable theory is the Quasilinear Viscoelasticity (QLV) proposed by Feng [16] in which soft tissue relaxation behavior is described very well [17]. Schapery's nonlinear viscoelastic theory considering the temperature effect was applied for ligament tissue. Recently a modified superposition method was used to predict creep and stress relaxation behavior of animals’ PDL at different levels. Compared to Burgers four parameter and five parameter models, the Modified Superposition (MST) models has been proved better to describe the PDL viscoelastic behavior though a series of tests [18]. Nevertheless, the material properties among different levels of the PDL need to evaluate in quantitative and qualitative analysis.
With the development of science and technology, nanoindentation technique is widely applied to thin film material, new functional material and biological tissue material. Based on the load-displacement data of indentations on a nanometer scale, the selected material properties can be obtained by test the surface of the materials. Unlike other traditional experimental methods for estimation of material properties, local precision mechanical properties of biomaterials structures can be obtained by nanoindentation technology. As two important performance parameters of material properties, elastic modulus and hardness can be directly extracted from the unloading curve of indentations by utilizing Oliver and Pharr’s method [19]. The ability of microstructure of the PDL to resist deformation caused by external force can be understood by nanoindentation techniques, the method investigate the microcosmic mechanical properties and the intrinsic parameters of the material, which providing the theoretical base for developing the thin material of artificial biology.
Nanoindentation experiment is performed with different types of tip geometries. Currently, the measuring indenter involves pyramids, spheres, punches, and wedges. Since each indenter is provided with its own advantages and disadvantages, it is important to choose a suitable one for a given application. As a type of pyramid, the Berkovich indenter is extensively used for numerous applications. The reason is that the sharp geometry offers a high degree of spatial resolution and induces plasticity at a shallow depth. However, a tiny error would exist because of the calculation of the changing contact area. In terms of cell soft tissue, the indenter tip pierces the cell surface so that activity losses and the measured elastic modulus value are higher. Huang et al. [20] verified the applicability of the V-W exponential hyperelastic model to describe the instantaneous elastic of the PDL in nanoindentation method with a spherical indenter. For the flat punch, the contact area can be directly measured and it is not affected by transient behavior or thermal drift.
The objective of this paper is to determine the elastic modulus of the PDL at different levels and to fit the loading curve by generalized Kelvin viscoelastic model based on loaddisplacement date in nanoindentation with a flat punch, as well as predictions of the stress distribution in the PDL were determined under a constant tipping force.
Materials and Methods
Formula derivation for elastic modulus
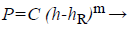
According to the Oliver-Pharr scheme [19] the reduced elastic modulus can be obtained from the initial slope of the unloading curve which can be fit by a power function:
 (1)
(1)
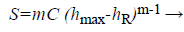
Where P is the indentation load, C and m are fitting parameters, h is the indenter displacement and hR is the residual indentation depth. Taking the derivative of h for Equation 1, unloading stiffness S is obtained by
 (2)
(2)
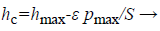
The contact depth between the indenter and the sample can be determined by
 (3)
(3)
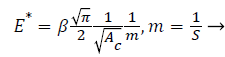
Where Pmax denotes peak load, ε is a constant depending on the indenter geometry. According to the geometry and contact depth of the indenter the contact area can be determined. Reduced elastic modulus is calculated by
 (4)
(4)
β is a constant related to the indentergeometry (β=1.0 for a flat punch), E* denotes the reduced elastic modulus. When considering the elastic deformation of the indenter, the reduced elastic modulus can be denoted by Equation 5.
 (5)
(5)
where E and v are the elastic moduli and Poisson's ratios of the measured material respectively. Ei and vi are corresponding elastic moduli and Poisson's ratios (for the diamond flat punch indenter, Ei=1141 GPa and vi=0.07), respectively. It is important to note that due to very high stiffness of the indenter, E* can be employed to represent the sample stiffness when comparing with the PDL, which can be derived from the unloading curve.
For a cylindrical flat punch indenter with a section radius of R and contact area constant for the cross-sectional area the following formula is given:
 (6)
(6)
However, the biological soft tissue of the PDL performance viscoelastic property, the unloading part curve is more convex than that of elastic-plastic materials, which cause greater contact stiffness. If the unloading rate is too low, a dotted curve like a nose in Figure 1 may become evident lead to negative contact stiffness. An error will occur when the elastic modulus is calculated by using the measured contact stiffness Se. Feng et al. [21],have proposed that calculation of the true contact stiffness Se use the following equation:

Figure 1: Load-displacement curve of indentation tests (dotted curve is the typical holding and unloading curve of viscoelastic material).
Where is the creep rate  (7)
(7)
(dh/dt) before unloading, is the unloading rate (dP/dt) at the end of holding. Replacing S in Equations 2-4 and 6 with Se, the reduced modulus can be accurately determined.
Formula derivation for creep compliance
The flat punch consideration of a rigid indenter into a halfspace constitutes a linearly elastic homogeneous material, the relationship between indentation displacement and load based on Sneddon [21] is showed below:
P=4Gh/πR (1-v) → (8)
In this case, unlike other indenter shapes, the contact area between the flat punch and selected material is constant, G is the shear modulus and v is Poisson's ratio.
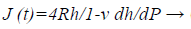
For the linearly viscoelastic materials under a prescribed arbitrary indentation loading history P (t). The relation of timedependent indentation displacement and load for flat punch was deduced by application of hereditary integral in Equation 8.
Where J (t) and ξ are the creep compliance in shear at time t and a dummy time variable of integration, respectively.
While the ramp force at a constant loading rate v0, P (t)=v0t, substitute P (t) into Equation 9, it can be expressed as
 (10)
(10)
Differentiating Equation 10 with respect to t, the J (t) is expressed as
 (11)
On the other hand, in terms of linear viscoelastic material, the
creep function based on the generalized Kelvin model is given
as
(11)
On the other hand, in terms of linear viscoelastic material, the
creep function based on the generalized Kelvin model is given
as
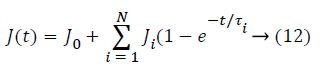
Where J0-Ji are the compliance numbers, and τ is the retardation time.
For the flat indenter, substituting P (t)=v0t and Equation 12 into Equation 9 leads to
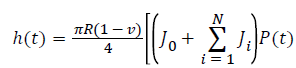
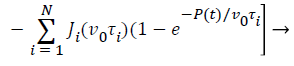 (13)
(13)
We can use Equation 6 to fit the load-displacement curve obtained from nanoindentation experiments by least square correlation. All compliance constants, J0, ...Ji and time constants parameters τ0,...τi (i=1,..., N) can be obtained. Substituting these parameters into Equation 5 determine the creep compliance J (t) for a flat indenter.
Experiments and details
The experiments used four cases of human cadaveric maxillary that were provided by Stomatological Hospital of Jiangsu Province, All procedures were approved from the Research Ethics Committee of Affiliated Hospital of Nanjing Medical University. The canine samples including tooth, PDL and alveolar bone were removed from the maxillary. With the help of a slow cutting machine, samples were cut into 3 slices with a thickness of approximately 2 mm, which were perpendicular to the longitudinal axis of the tooth (Figure 2). For each PDL level, four slices were obtained, giving a total of 12 slices from the four canine specimens. All slice specimens were stored in saline solution at 10°C until the beginning of the experiments (<2 d).

Figure 2: Tooth structure with region of harvest.
The testing was conducted using a Nanotest machine (Agilent Technologies Nano Indenter G200) with a flat punch in a room with constant temperature of 27°C. First, the sample was pasted on the petri dish and fixed on the working table (Figure 3). Then, using a low microscopic magnification to find a flat test area, subsequently changing to a high magnification to confirm the test position (Figure 4B). A total of 12 specimens were used to test, each specimen has 8 test points around the PDL (Figure 4A). During testing, the PDL region was coated with saline solution every 1/2 hour to guarantee tissue activity. A typical indentation data representing the average value for each level indentation was chosen to calculation after the experiments. In a total of 3 typical loading segment load displacement curve determine the creep function J (t) based on least squares fit method, respectively (Figure 5).

Figure 3: Photographs of the slice sample on the working table of nanoindentation.

Figure 4: The cross-section specimen of tooth, dotted area representing PDL, x represents the position of test area (A); Mesial side image of specimen with10-fold magnification, the picture showing confirm test position (B).

Figure 5: A typical indentation load-displacement curve of the loading segment for each level, good fit was shown in apex, cervical margin and midroot.
During the test, a flat punch with radius of 20 μm was used to test PDL specimens. An indentation force of 1 mN was reached at the loading rate of 0.1 mN/s. The dwell time lasted for 20 s and finally the PDL was unloaded at the same rate. The load-displacement data in the whole testing process were recorded to investigate material properties of the PDL.
Finite element analysis
Before preparing the sample, the mandible canine sample was scanned by a micro-CT, obtained 92 CT image at intervals of 0.1 mm. A 3D outline shapes of the canine and alveolar bone was developed based on image-processing software (Mimics 10.1). To simplify, the PDL tissue was modeled as thickness of 0.2 mm between the root of the tooth and alveolar bone and divided to three sections contained cervical margin, midroot and apex (Figure 6), material properties of linear and viscoelastic were assigned to the PDL respectively, based on the experimental date which include calculation of the average elastic modulus and creep equation for each section. Due to the elastic modulus of tooth and bone are 1000-3000 times of the PDL, the variation of materials properties settings for them have a minimal effect on the FE result of the PDL. Therefore, the tooth and alveolar bone were assumed to be linear elastic and isotropic, the elastic modulus and Poisson's ratio were set at 20 GPa and 0.3, 2 GPa and 0.3, respectively [22]. To find a proper element size for each component, a mesh convergence study for each element is completed and the results are shown in Table 1. This produced the FE model consisting of 919627 tetrahedron elements in which the PDL had 402009 elements. The contact between bone and PDL as well as between tooth and PDL were defined as "tie" connection. Constraint in all direction applied to the nodes located at the base of the alveolar bone. A ramp load to the maximum of 1N was applied at buccal-lingual direction to the midroot of crown and held constant for 20 s.

Figure 6: 3D Finite element model with meshed a: tooth, b: the PDL, c: alveolar bone, d: assembly model.
| Components | Element size |
|---|---|
| Tooth | 0.2 mm |
| Alveolar bone | 0.2 mm |
| PDL | 0.1 mm |
Table 1. The results of mesh convergence.
Results
In the process of dealing with the data, some curves which fail to fit the unloading part and defect curves were abandoned (i.e. the PDL was glued to the indenter lead to the loading and unloading become to a straight line). Due to the difference between specimens and anisotropy of the PDL, it can be seen that, obviously difference exist among load-depth curves when testing the different samples at different levels with a same loading velocity (Figure 7). However, in the same region of different specimens, the variation of load-depth curves performance is small relatively compared with the different specimens (Figure 8). The mean value and standard deviations of elastic modulus for the PDL at different levels from specimens 1-4 were summarized in Table 2.

Figure 7: Comparison of four load-depth curves for different specimens.
| Cervical margin M ± SD | Midroot M ± SD | Apex M ± SD | |
|---|---|---|---|
| Specimen 1 | 0.53 ± 0.0758 | 0.11 ± 0.0274 | 0.48 ± 0.1065 |
| Specimen 2 | 0.42 ± 0.0592 | 0.23 ± 0.0604 | 0.62 ± 0.3610 |
| Specimen 3 | 0.28 ± 0.1032 | 0.19 ± 0.0187 | 0.54 ± 0.1342 |
| Specimen 4 | 0.21 ± 0.0809 | 0.15 ± 0.0474 | 0.44 ± 0.1470 |
| Average value | 0.36 ± 0.1542 | 0.17 ± 0.0853 | 0.52 ± 0.2425 |
Table 2. The average elastic modulus and standard deviations of PDL for different levels along longitudinal direction (Unit: MPa).

Figure 8: Four indentions load-depth curves on midroot.
A paired t-test was adopted to compare different levels. Consequently, the elastic modulus showed a significant difference along longitudinal direction. Moreover, a highly significant difference was observed among the midroot, cervical margin and apex (Table 3).
| Analysis | P |
|---|---|
| Cervical margin vs. midroot | 0.0004 |
| Cervical margin vs. apex | 0.028 |
| Midroot vs. apex | 0.0003 |
Table 3. Results of statistical analyses of the PDL on different section date. P<0.05: a significant difference; P<0.01: a highly significant difference; NS: No Significant difference.
The elastic modulus in midroot (ranges from 0.11 to 0.23 MPa) was lower than cervical margin (ranges from 0.21 to 0.53 MPa) and apex (ranges from 0.44 to 0.62 MPa), among which the maximum value is 1.23 Mpa at apex on distal aspect, while the minimum value is 0.07 MPa at midroot on mesial aspect.
The creep and retardation time parameter were obtained from good fitted curve (the squared correlation coefficients>0.99), substituting these parameters into Equation 12, the J (t) equations for different levels are shown. Variability of creep compliance is apparent among the three levels (Figure 9). The results show that creep compliance increase followed by apex, cervical margin and midroot.

Figure 9: Creep compliance curves for each section.
Cervical margin (t)=3.31+1.12 (1-e-t/6.51)+1.41 (1-e-t/ 21.5)+0.483 (1-e-t/709.1)
Midroot J (t)=3.65+2.59 (1-e-t/4.36)+0.357 (1-e-t/44.53)+0.159 (1-e-t/355.62)
Apex J (t)=3.06+0.944 (1-e-t/6.99)+0.531 (1-e-t/30.61)+0.924 (1- e-t/490.4)
According to the classic "pressure-tension" theory [23], the major cause of tooth movement is compression and tension within the periodontal tissue generated by external force, thus, the maximum principle stress (P1) is recorded for the two EF models. Positive represents the tensile stress and negative represents the compressive stress. The EF results cross the PDL for linear and viscoelastic under a rapid growth load of 1 N are showed in Figure 10. It reveals that the stress distribution of P1 exist distinction at cervical margin and apex for the two material properties, especially in the maximum value areas. For midroot, the stress distribution patterns are similar in trend but different in magnitudes. At all location, the highest value of P1 for linear model was observed at the cervical margin on the lingual aspect and tapered more at apex than at the buccal margin, this agrees with previous results [24]. Similar situation can be observed with the viscoelastic model. However, the zone of maximum value areas was smaller than linear model at cervical margin and apex. The compressive stress magnitude is smaller than the tensile stress on the opposite side. This is corresponds with previous publication [25].
For the stage of constant force, three elements are selected from each section (Figure 10), the strain variation of them versus time is presented (Figure 11). It shows the different strain variation at different stress level, the strain range of element 1, element 2 and element 3 during creep segment is about 0.049026-0.0490971 for a stress of 0.059 MPa, about 0.0125112-0.0125152 for a stress of 0.0039 MPa, about 0.0260272-0.026422 for a stress of 0.0365 MPa, respectively.

Figure 10: Comparing the stress distribution of the PDL with linear and viscoelastic models in at the time of 1 s. (Unit: MPa).

Figure 11: The strain variation versus time for the selected elements from each section.
Discussion
The above measurement details are influenced by different factors that are difficult to judge quantitatively, in order to guarantee the measurements accuracy, the sample's storage and experiment conditions were standardized. The order of magnitude for measurement is very small, the experiment result is strongly affected by surface conditions, therefore, to make the test surface relatively smooth, the canine samples were embedded in paraffin, which is convenient for fixing positions and guaranteeing sample accuracy. During testing, the PDL position is found through moving a low power micro lens (10 times of magnification, Figure 4B), and then a high power micro lens (50 times of magnification) is used to focus and test after determining the position. If the sample's surface roughness of the testing zone in the focalization process is less than 5 μm, the focalization can be carried out to ensure the reliability of the results to some extent.
A novel technology was used to evaluate the elastic modulus and creep compliance of the PDL at different levels. During testing, the dwell time prior to unloading was useful in predicting the flaw resistance of the viscoelastic materials [26]. In this analysis, the PDL was assumed to be a linear viscoelastic material at different levels for the PDL. The selected curve represents a typical indentation curve for flat punch, and the indentation depth denotes the majority testing depth at certain level. The results show that a generalized Kelvin model agrees well with the loading data for each level through nanoindentation method with a flat punch.
The PDL is a soft connective tissue which mainly consists of collagen fibers accounting for 50% of total mass. Additionally, it contains cells, blood vessels, nerves and ground substance matrix [27]. The principal fibers are composed of a large fiber bundle of collagen, its functions and sequence direction are not the same at different levels. The orientation of collagen fibers is more oblique along the midroot than one at cervical margin and apex [28], therefore, the elastic modulus and J (t) equations are different at different levels. Moreover, it is indicated that lower elastic modulus leads to higher creep compliance [29].
The present study demonstrates the difference that the indentation curves of the load-depth in different regions were determined by inherent property of the PDL. In this study, the elastic modulus of upper (cervical margin) and lower (apex) regions are higher than that of intermediate regions (midroot). This means that there has change stiffness along the axial direction for the PDL [7]. The reason may be that the percentage of blood vessels, nerves and ground substance is high in the midroot area compared to the other two areas [30].
The finite element method has been applied to dental biomechanical for a long time. In early stages, it was confined to the study of axisymmetric and two-dimensional problems [16]. Technology development is particularly attractive to a number of orthodontic investigators, since they can establish elaborative three-dimensional models and accurately simulate tooth movement when subjected to various orthodontic forces. Most of the previous computational models considered the PDL as a linear elastic, bilinear or nonlinear hyperelastic material [8,11,29]. However, teeth are always subjected to a long-term and lasting force during orthodontic treatment. Therefore, a viscoelastic model of time-dependent is more suitable to describe the PDL's mechanical properties for orthodontic treatment. Van et al. [31] reported that linear elastic model overestimate the PDL's stress, this is consistent with the FE results in this study. In reality, the PDL is anisotropic and non-uniform, we assumed the PDL as a uniform thickness of 0.2 mm that represent the PDL average value. Tom [24] verified that the stress distribution of the PDL with uniform and nonuniform are different in FE analysis.
In orthodontics, a low and continuous forces apply to the crown of a tooth is recommended that can cause steady tooth movement, whereas, heavy forces induce abrupt starts and stops of migration synchronous with collapse of necrosed bone and cementum [32,33]. Penedo et al. [34] study that the stress magnitude in the PDL exceeding capillary blood stress 2.6 KPa would cause onset of bone remodeling. Aoyama [35] suggested that bone resorption occurred on the compressive side was resulted from 4.9 KPa stress. However, the quantitative relationship between the PDL's stress and the bone resorption remains an open question.
The difference between linear elastic and viscoelastic for stress distribution of the PDL at different levels through FE software is compared in the rapid growth stage for the load. With the constant force, the change of strain for the selected elements from each section are exemplified, showing that higher loading level lead to lager strain range, namely stronger creep effect. This can be validated by the creep test, the creep curve of the PDL at three different load levels is plotted in Figure 12. It is found that the creep depth increases with the increase of force. Moreover, the creep effect of the PDL is related not only with inherent material property, but also with the applied stress.
Conclusion
In this investigation, a novel method is used to evaluate the mechanical properties of the PDL at different levels based on a nanoindentation technique with a flat punch, the elastic modulus and the creep compliance for the PDL are obtained by loading and unloading curve, respectively. It is revealed that the minimum value of elastic modulus was in midroot and the maximum was in apex. A good fit was obtained between the generalized Kelvin model and test data. In addition, an accurate FE model is established to predict the stress distribution of the PDL for linear and viscoelastic. Under the constant force, the strain variation of the elements from each level is performed. The limitation of the FE model is without considering the non-uniform thickness for the PDL and the mechanical inter actions of adjacent teeth. Furthermore, a precise and complete model of the PDL needs different types of experimental data. Further research that determining a more accurate viscoelastic model is required based on creep and stress-relaxation test.
Acknowledgements
This work was supported by the National Natural Science Foundation of China (Grant # 51305208).
References
- Storey E. The nature of tooth movement. Am J Orthod 1973; 63: 292-314.
- Melsen B. Tissue reaction to orthodontic tooth movement-a new paradigm. Eur J Orthod 2001; 23: 671-681.
- Hazrati J, Ghalichi MF, Mirzakouchaki B. Numerical simulation of orthodontic bone remodeling. Orthodont Waves 2009; 68: 64-71.
- Badawi H, Major P. Three-dimensional orthodontic force measurements. Am J Orthodont Dentofac Orthop 2010; 137: 299-305.
- Dorow C, Krstin N, Sander FG. Determination of the mechanical properties of the periodontal ligament in a uniaxial tensional experiment. J Orofac Orthop 2003; 64: 100-107.
- Dorow C, Krstin N, Sander FG. Experiments to determine the material properties of the periodontal ligament. J Orofac Orthop 2002; 63: 94-104.
- Toms SR, Lemons JE, Bartolucci AA, Eberhardt AW. Nonlinear stress-strain behavior of periodontal ligament under orthodontic loading. Am J Orthod Dentofacial Orthop 2002; 122: 174-179.
- Burstone CJ, Pryputniewicz RJ. Holographic determination of centers of rotation produced by orthodontic forces. Am J Orthodont Dentofac Orthop 1980; 77: 396-409.
- Hinterkausen M, Bourauel C, Siebers G. In vitro analysis of the initial tooth mobility in a novel optomechanical set-up. Med Eng Phys 1998; 20: 40-49.
- Maia LGM, Maia MLD, Monini AD, Vianna AP, Gandini LG. Photoelastic analysis of forces generated by T-loop springs made with stainless steel or titanium-molybdenum alloy. Am J Orthodont Dentofac Orthop 2011; 140: 123-128.
- Liu DX, Wang HN, Wang CL. Modulus of elasticity of human periodontal ligament by optical measurement and numerical simulation. Angle Orthodontist 2011; 81: 229-236.
- Fill TS, Carey JP, Toogood RW, Major PW. Experimentally determined mechanical properties of, and models for, the periodontal ligament: critical review of current literature. J Dent Biomech 2011; 2011: 312-318.
- Motoyoshi M, Hirabayashi M, Shimazaki T, Namura S. An experimental study on mandibular expansion: increases in arch width and perimeter. Eur J Orthodont 2002; 24: 125-130.
- Katona TR, Qian H. A mechanism of noncontinuous supraosseous tooth eruption. Am J Orthod Dentofacial Orthop 2001; 120: 263-271.
- Tanne K. Stress induced in the periodontal tissue at the initial phase of the application of various types of orthodontic forces: 3-dimensional analysis using a finite element method. Osaka Daigaku Shigaku Zasshi 1983; 28: 209-261.
- Fung YC. Biomechanics: mechanical properties of living tissues. Springer New York 1981.
- Woo SL, Gomez MA, Akeson WH. The time and history-dependent viscoelastic properties of the canine medical collateral ligament. J Biomech Eng 1981; 103: 293-298.
- Romanyk DL, Melenka GW, Carey JP. Modeling stress-relaxation behavior of the periodontal ligament during the initial phase of orthodontic treatment. J Biomech Eng 2013; 135: 91-107.
- Oliver WC, Pharr GM. An improved technique for determining hardness and elastic-modulus using load and displacement sensing indentation experiments. J Mater Res 1992; 7: 1564-1583.
- Huang H, Tang W, Yan B, Wu B, Cao D. Mechanical responses of the periodontal ligament based on an exponential hyperelastic model: a combined experimental and finite element method. Comp Meth Biomech Biomed Eng 2016; 19: 188-198.
- Feng G, Ngan AHW. Effects of creep and thermal drift on modulus measurement using depth-sensing indentation. J Mater Res 2002; 17: 660-668.
- Vollmer D, Bourauel C, Maier K, Jager A. Determination of the centre of resistance in an upper human canine and idealized tooth model. Eur J Orthod 1999; 21: 633-648.
- Schwartz AM. Tissue changes incidental to orthodontic tooth movement. Int J Orthodontia 1932; 18: 331-352.
- Toms SR, Eberhardt AW. A nonlinear finite element analysis of the periodontal ligament under orthodontic tooth loading. Am J Orthod Dentofacial Orthop 2003; 123: 657-665.
- Cattaneo PM, Dalstra M, Melsen B. The finite element method: a tool to study orthodontic tooth movement. J Dent Res 2005; 84: 428-433.
- Sadr A, Shimada Y, Tagami J. Effects of solvent drying time on micro-shear bond strength and mechanical properties of two self-etching adhesive systems. Dent Mater 2007; 23: 1114-1119.
- Pietrzak G, Curnier A, Botsis J. A nonlinear elastic model of the periodontal ligament and its numerical calibration for the study of tooth mobility. Comp Meth Biomech Biomed Eng 2002; 5: 91-100.
- Mandel U, Dalgaard P, Viidik A. A biomechanical study of the human periodontal ligament. J Biomech 1986; 19: 637-645.
- Guangjian P, Yi M, Yihui F. Nanoindentation creep of nonlinear viscoelastic polypropylene. Polym Test 2015; 43; 38-43.
- Chiba M, Yamane A, Ohshima S, Komatsu K. In vitro measurement of regional differences in the mechanical properties of the periodontal ligament in the rat mandibular incisor. Arch Oral Biol 1990; 35: 153-161.
- Van Driel WD, vanLeeuwen EJ, VondenHoff JWM, Kuijpers-Jagtman JCAM. Time-dependent mechanical behaviour of the periodontal ligament. Proc Inst Mech Eng Part H J Eng Med 2000; 214: 497-504.
- Begg P. Begg orthodontic theory and technique. Philadelghia WB Saunders 1977.
- Proffit WR, Fields HW, Ackerman JL, Sinclair PM, Thomas PM, Tulloch JF. Contemp Orthodont Baltimore Mosby-Year Book 1993.
- Penedo ND, Elias CN, Pacheco MCT, Gouve a JP. 3D simulation of orthodontic tooth movement. Dent Press J Orthod 2010; 15: 98-108.
- Aoyama K, Sueyoshi Y, Tomita K, Sawaguchi T, Sakai K, Sakamoto J, Oda J. Influence of mechanical stimuli on bone formation. Proc Ann Meet of Jpn Soc Clin Biomech Rel Res 1994; 79-84.