Research Article - Biomedical Research (2017) Volume 28, Issue 6
An investigation on the statistical significance of spectral signatures of lung sounds
Nishi Shahnaj Haider, Justin Joseph* and Periyasamy R
Department of Biomedical Engineering, National Institute of Technology, Raipur, Chhattisgarh, India
- *Corresponding Author:
- Justin Joseph
Department of Biomedical Engineering
National Institute of Technology, Raipur
Chhattisgarh, India
Accepted date: November 18, 2016
Abstract
Spectral or temporal features employed in computerized lung sound analysis should be statistically significant and capable to distinguish the subjects accurately into respective disease categories, regardless of their age, gender and demography. In this article the spectral features of five different classes of lung sounds; stridors, wheezes bronchial, vesicular and crackles are estimated via an automated method and evaluated for their statistical significance using Analysis of Variance (ANOVA) and Fisher’s Class Separability Measure (FCSM). The spectral features included in this study are median frequency, dominant frequency, maximum frequency, spectral roll off and spectral centroid. The maximum and dominant frequencies and spectral centroid are identified directly from the lung sound spectra. The median frequency and spectral roll off are computed from the Power Spectral Density (PSD) estimate using an analytical method. Before computing the spectrum, the lung sound specimens are preconditioned with offset elimination and normalization. The normalized specimen is windowed with Hanning window to suppress the ripples induced in the spectrum during the computation of Fast Fourier Transform (FFT). The pre-processing, estimation of the spectral features and their statistical evaluation are performed in Matlab®. P-values of 0.0386, 0.7508, 0.0197, 0.055 and 0.6979 were observed at a confidence level of 0.05, for dominant frequency, maximum frequency and median frequency, spectral roll off and spectral centroid, respectively. The values of FCSM are 0.1242, 0.0192, 0.1498, 0.1112 and 0.0222, respectively and in compliance with ANOVA. The median frequency comparatively is more significant than the other four. It is capable of discriminating the stridors and crackles.
Keywords
Lung sounds, Spectral roll off, Spectral centroid, Fisher’s class seperability measure, Median frequency.
Introduction
The automated or computerized analysis of lung sounds gained wide popularity soon after its inception itself because of its objective nature. The ability of computerized lung sound analysis to resolve the subjectivity inherent in the manual auscultation paced its acceptance in clinical practice. The signal processing methods which form the Skelton of the computerized lung sound analysis are in fact powerful to flexibly help the removal of the interferences like heart sounds and artefacts to make the diagnostic interpretation reliable and specific enough. In manual auscultation the clinicians look for the presence of extra-frequency components in the lung sounds and their relative strengths to reach a diagnostic conclusion. In computerized lung sound analysis also, the diagnostic interpretations are made based on the physical characteristics of the lung sound specimens. These characteristic includes the spectral, temporal or spectro-temporal features. Because of the resemblance to the human method of audition, the spectral or frequency domain features are comparatively of more significance than the other two. However, the statistical significance of the spectral features depends on how effectively the qualitative behavioral pattern of the spectrum is translated into numerical indices. Many researchers have tried to represent the behavioral pattern of the lung sound spectra with the help of reduced dimension of spectral features.
Ponte et al. [1] computed the maximum frequency of the lung sounds via discrete pseudo Wigner-Ville distribution, anticipating that the maximum frequency may help to distinguish crackles generated by fibrosis from those generated by the heart failure and pneumonia. However, it was not possible to differentiate crackles generated by pneumonia from those generated by heart failure by means of the maximum frequency of the lung sound spectra. Generally, the frequency domain features are extracted from the spectrum, computed either through parametric or non-parametric methods. Gavriely et al. [2] showed that the spectra of normal lung sounds computed by Fast Fourier Transform (FFT) and Auto Regressive (AR) model have the same characteristic pattern. Usually, the features extracted from the spectrum, such as bandwidth, dominant frequency, maximum frequency, quartile frequencies and other statistical indices which account for the qualitative attributes of the spectrum are equally helpful to characterize the frequency domain representation of signals of biological origin. Xie et al. [3] employed Multi- scale Principal Component Analysis (PCA) to represent the variability of the Fourier power spectra of lung sounds. A Fourier spectrum was used in Oud et al. [4] also. But, the use of Fourier spectra was optimized by applying a power raising transformation (involution). Masada et al. [5] obtained a sequence of power spectra of lung sound epochs through FFT and computed the component spectra by Independent Component Analysis (ICA), from the overlapping sets of consecutive power spectra. Waitman et al. [6] represented the lung sounds by their averaged power spectral density, summed into feature vectors across the frequency spectrum from 0 to 800 Hz.
Gavriely et al. [7] measured the average slope of the power spectrum and the maximal frequency of lung sounds during the inspiratory and expiratory phases individually, over the base of the left and right lungs, inter-scapular region and right anterior chest of healthy controls. This study just explored the spatial variability of these frequency domain signatures rather than their diagnostic feasibility. As a part of the investigations for more comprehensive strategies to express the characteristics of the lung sound spectra, the same author, Gavriely et al. [8] observed that the amplitude spectrum of normal breath sounds comprises two linear segments, corresponding to the low and high frequencies, in the log-log plane and these segments can be characterized by the corresponding regression lines. Slopes of the regression lines and the amplitude and frequency coordinates of their intersection were employed as the features to represent the behavior of the spectra. It was reported that the frequency at which this line crosses the zero dB level, designated as the maximal frequency, is between 736 and 999 Hz during inspiration and 426 and 796 Hz during expiration, with higher values in women than in men. Kawamura et al. [9] calculated the ratio of the power of high and low-pitched sounds from the FFT spectra of lung sounds, correlated it with the Computed Tomography (CT) findings and suggested that the ratio is useful for differential diagnosis of the pulmonary disorders. As a base to this, decades before itself, Fenton et al. [10] had reported that high frequency and high amplitude peaks in the power spectra of respiratory sounds are symptoms of wheezing. Furman et al. [11] also attempted to diagnose bronchial asthma from the characteristics of the FFT spectra of respiratory sounds. In compliment to this, Mazic et al. [12] investigated the feasibility of power spectra of phonopneuograms as the markers of wheezing in asthmatic infants.
Xu et al. [13] analyzed the power spectra of vesicular breathing, rales and wheezes with Band Selectable Fourier Analysis (BSFA) to classify them. Dokur [14] used averaged power spectrum components as the feature vectors for the classification of bronchial, broncho-vesicular, vesicular lung sounds, crackles, wheezes, stridor, grunting, squawks and friction rub. Malmberg et al. [15] employed Self Organizing Maps (SOM), making use of the features from the FFT spectra of the lung sounds during the mid- inspiratory phase to classify asthma, emphysema, fibrosis alveolitis and normal. The strategy failed to distinguish breath sounds of asthmatics without wheezing from those with crackles in fibrosing alveolitis. Ono et al. [16] determined the dominant frequency at the maximum lung sound intensity and the quartile frequencies, from normal controls and patients with Interstitial Pneumonia (IP) and evaluated the diagnostic specificity offered by these frequency domain features. It was indicated that the second and third quartile frequencies had been higher in the IP than in controls, but the diagnostic specificity offered by the quartile frequencies were inferior to that offered by the auscultation. Xu et al. [17] noted that the vesicular lung sounds from normal controls are different in their distribution of the peak frequencies in the spectrum from the wheezes and rales and the power spectrum of rales and wheezes contain more high-frequency components and the vesicular lung sounds contain more low-frequency components.
Charbonneau et al. [18] reported that high-frequency components in the lung sound spectra increases directly proportional to the air flow rate, in both normal and asthmatic subjects. Schreur et al. [19] concluded that lung sound intensity is lower in patients with symptom-free mild asthma than in healthy controls, during expiration, specifically at low airflow rates and the first and third quartile frequencies are higher in asthmatics than in healthy controls during quiet expiration and the variation of these quartile frequencies with respect to the air flow rate is greater in asthmatic than in normal. Nakano et al. [20] calculated the power spectra at various frequency bands and mean airflow rates corresponding to each band, for short epochs of breath sounds, to identify the frequency band, correlated to the changes in the airway calibre. Jane et al. [21] assessed the effect of bronchodilator in asthmatic via spectral analysis of the lung sounds. Habukawa et al. [22] observed that the highest frequency component in the inspiratory phase of the lung sounds at the instant at which the airway resistance is equal to two times of the baseline during the methacholine inhalation challenge is greater than that before the challenge and that after the inhalation of the bronchodilator.
Sovijarvi et al. [23] demonstrated that the median frequency has the best repeatability among the quartile frequencies of lung sounds in healthy subjects. Sovijarvi et al. [24] later investigated the repeatability of the median frequency estimated from lung sound spectra averaged over inspiratory as well as expiratory phases of consecutive respiratory cycles. Different from the healthy subjects; the repeatability of median frequency was not noticeable in fibrosing alveolitis. Sanchez and Vizcaya [25] studied the intra-subject repeatability of the median frequency in normal adults. The median frequency was computed from the spectral power of the lung sounds between 100 Hz and 2 KHz, extracted when the subject was allowed to breathe through the pneumotachograph at a rate of 0.9-1.1 litres. Kanga and Karaman [26] compared the MF of phonopneumograms of full term and premature infants with those of normal adults and pointed out that the median frequencies of term and premature babies are overlapping and the normal lung sounds of newborns contain higher- frequency components than those of adults. Gross et al. [27] concluded that the relation between age, gender and median frequency of lung sounds is not statistically significant. Hidalgo et al. [28] reported, median frequency estimated from the average of the amplitude spectrum of the inspiratory phase of consecutive breath sounds is different for children and adults and in children the median frequency is correlated with height and age.
Anderson et al. [29] and Spence et al. [30] reported that median frequency is well correlated to Forced Expiratory Volume in one second (FEV1) during histamine/ methacholine challenge in asthmatic subjects. Whittaker et al. [31] investigated correlation of median frequency with FEV1 on asthmatic and control subjects after administration of bronchodilator, salbutamol and suggested that the median frequency is sensitive to the measurement frequency range and unlikely to be used as a single marker of lung condition. Malmberg et al. [32] reported a correlation of -0.853 with p<0.001 between median frequency of tracheal expiratory sounds and FEV1 during histamine challenge and subsequent bronchodilation in asthmatics and healthy control subjects. It had been suggested that the increase of median frequency during histamine challenge is significantly larger in asthmatics than in healthy controls. Malmberg et al. [33] in his another endeavor appreciated the correlation between percentage change in FEV1 and the percentage change in median frequency of expiratory breath sounds in asthmatic children. The author postulated that the median frequency of the mean breath sound spectra recorded at the chest is higher in asthmatics than in both the control subjects and the patients with Chronic Obstructive Pulmonary Disease (COPD). According to the study conducted by Malmbarg et al. [34] the median frequency of lung sounds in patients with COPD was not statistically different from control subjects. But, the median frequency of recorded sound at the trachea in the asthmatics was correlated to FEV1.
Among the recent developments in lung sound analysis, Lozano et al. [35,36] tried to differentiate normal and continuous adventitious lung sounds using instantaneous frequency computed by Ensemble Empirical Mode Decomposition (EEMD). In another recent study, Sengupta et al. [37] demonstrated that the statistics of Mel Frequency Cepstral Coefficients (MFCCs) are superior to the raw MFCC coefficients, cepstral features and wavelet based methods, in classifying normal lung sounds, wheezes and crackles. Bokov et al. [38] suggested the feasibility of using spectral roll off for the detection of wheeze in pediatric population. In contrary to this, Tabata et al. [39] exhibited doubt on the ability of dominant and quartile frequencies of lung sounds for detecting air way narrowing in children and showed that spectrum curve indices are better than them.
The literatures are not in unanimous agreement on the statistical significance of the spectral features. The accuracy of diagnostic decision and the specificity offered by the automated diagnostic systems rely purely on the statistical significance and the disease correlation of the elements in the feature vector which feeds the classifier. Irrespective of the classifier, the automated diagnostic system would perform well if the features do have appreciable Seperability in the feature space in terms of ‘between the class variability’ and ‘within the class similarity’. Investigating the statistical significance of the spectral or temporal features of the lung sounds with respect to the age and gender of the subjects, the correlation between the respiratory airflow rate and airway calibre, intra-subject repeatability of the features and their spatial variability alone do not help to devise an automated lung sound analyzer. Rather than the primitive systems which do the binary like classification of the lung sound specimens into asthmatics or non-asthmatics, wheezes or non-wheezes and normal or adventitious, systems which can classify the lung sound samples into their respective classes accurately and can make the diagnostic decision reliable, should come in place. Hence, this article evaluates the statistical significance of five most important spectral features such as median frequency, maximum frequency, dominant frequency, spectral roll off and spectral centroid of lung sounds and their Seperability in feature space by using the specimens from five different classes of lung sounds, stridors, wheezes, bronchial, vesicular and crackles.
During the forthcoming discussions the mathematical formulation for the computation of spectral features from the lung sound specimens are detailed. Prior to this a brief discussion on the pre-processing is incorporated. Following this, the statistical significance of the computed frequency domain features and their Seperability in feature space are analyzed.
Methodology
Median frequency, dominant frequency, maximum frequency, spectral roll off and spectral centroid of five different classes of LS such as stridor, crackles, wheezes, bronchial and vesicular are estimated and their statistical significance is evaluated using Analysis of Variance (ANOVA) and Fisher’s Class Seperability Measure (FCSM). The lung sound samples corresponding to the said classes were collected from the web sources, breathe.missouri.edu, depts.washington.edu, impactednurse.com, littmann.com, meded.ucsd.edu, tracheostomy.com and wilkes.med.ucla.edu. The lung sound specimens are selected in such a way that the specimens contain samples from normal (bronchial and vesicular), continuous-adventitious (wheeze and stridors) and discontinuous-adventitious (crackles), to make the analysis of the statistical significance of the frequency domain signatures more comprehensive.
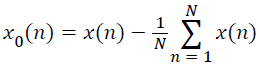
To compute the spectral features of the lung sound specimens they need to be transformed into frequency domain. But before computing the spectrum, the lung sound specimens are preconditioned with offset elimination and normalization. The offset eliminated specimen,
 →(1)
→(1)
Given the x(n) is the lung sound specimen, sampled at a rate 1/fs and comprising N discrete samples,1≤ n ≤ N.
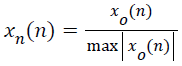
Since, the technical specification of the sensors used for the acquisition of lung sounds and the level of amplification employed in each database remain unknown, to standardize the amplitudes of the lung sounds, the samples were normalized to a range between -1 and +1 as in (2).
 →(2)
→(2)
The spectrum of the normalized specimen is computed using the FFT algorithm. The spectral resolution or frequency resolution which is the ratio of the sampling frequency ‘fs’ and the number of samples, ‘N’, significantly influence the accuracy of spectral coefficients and the spectral or frequency domain features extracted from the spectrum. Even though, FFT allows fast computation of the spectrum, in FFT the technical issues induced by inadequate spectral resolution become too apparent, different from the direct computation of Discrete Fourier Transform (DFT). While computing the spectrum, because of poor spectral resolution, if the frequency bin corresponding to one of the component frequencies is absent, the spectrum appears to be spread between the nearest available frequency bins, rather than a sharp and distinct peak at a particular or single frequency bin. The spectral magnitude of component frequencies which have equal magnitude in time domain would not be equal.
Dominant frequency of a spectrum of signal is usually identified based on the intuition that ‘dominant frequency’ corresponds to the largest peak in the magnitude spectrum. In other words, the dominant frequency is identified based on the relative spectral magnitude of the component frequencies. If the spectral resolution is poor the frequency bin corresponding to the largest peak in the magnitude spectrum need not provide the dominant frequency.
The spectral resolution can be enhanced by increasing the number of samples in the signal. One of the practical ways of increasing the number of samples in the signal is ‘zero padding’. The zero padding improves the spectral resolution by interpolating intermediate bins in the frequency vector. Unfortunately, zero padding drastically induces ripples to the spectrum. The linearity property of the DFT implies, the magnitude of the DFT of a spectrum of signals comprising many component frequencies is equal to the algebraic sum of the spectral magnitude of the individual frequency components so that the ripples introduced by one of the frequency components interfere with spectral magnitude of the neighboring frequencies and hinders the relative spectral magnitude. This issue becomes more significant when the component frequencies are closely spaced.
Ideally, the spectral peaks appear only at the component frequencies. The ripples turn to be a significant issue while computing the maximum frequency component present in the signal. Maximum frequency of a spectrum of signal is an entirely different frequency domain feature from the dominant frequency. Dominant frequency is the frequency component contributing maximum power to the spectrum of signal and maximum frequency is the highest frequency present. ‘Maximum frequency’ is a feature which express the band width of the spectrum of signals.
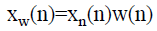
To maintain adequate spectral resolution the number of samples in the lung sound specimen is increased to at least two times of its sampling frequency ‘fs’, through zero padding. The lung sound specimens are windowed with Hanning window prior to the computation of FFT to suppress the ripples which could be induced in the spectrum during the computation of FFT, because of the zero padding. Even though Hanning window is employed here, Hanning and Hamming windows offer similar spectral resolution. The normalized lung sound signal after windowing,
 →(3)
→(3)
where the Hanning window is given by,
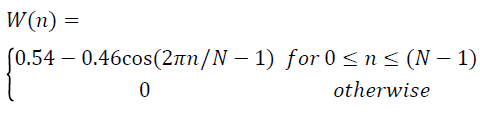 →(4)
→(4)
Xw(n) is the lung sound signal after offset elimination, normalization and windowing, obtained from the raw lung sound signal. The spectrum of the windowed signal is computed as,
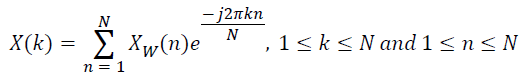 →(5)
→(5)
The first half of the spectrum from 0 to the Nyquist frequency fs/2 is sufficient to identify the component frequencies, since the second half is just a reflection of the first half. Hence, three of the frequency domain signatures are estimated from the half-length spectrum rather than its full length version. The maximum and dominant frequencies can be identified directly from the half-length spectrum. But, the MF is computed from the Power Spectral Density (PSD) estimate. The PSD estimate is computed from the half-length spectrum as,
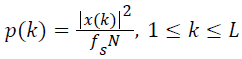 →(6)
→(6)
where, 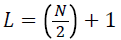
As Nyquist frequency and DC do not appear twice, to conserve the total power, the power spectrum is modified such that, the modified power spectrum,
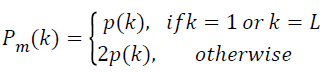 →(7)
→(7)
The PSD estimate expressed in dB/Hz,
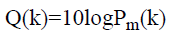 →(8)
→(8)
Distinguishing the median frequency of the lung sound spectra simply from the PSD estimate is not possible. Hence, an analytical technique to compute the median frequency from the cumulative PSD estimate is employed here. The cumulative PSD estimate,
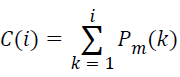 →(9)
→(9)
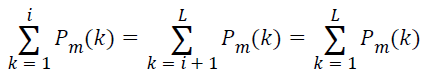
At the median frequency, the total power in the spectrum get divided equally, such that the median frequency,
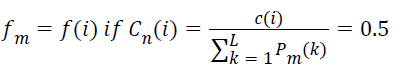 →(10)
→(10)
where Cn(i) is the normalized cumulative PSD estimate. The frequency vector corresponding to the half-length spectrum,
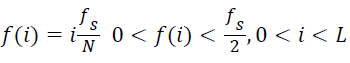 →(11)
→(11)
which implies, at the median frequency ‘f(i)’,
 →(12)
→(12)
The magnitude of the normalized form of cumulative PSD crosses 0.5 exactly at the median frequency. In the automated method employed in this article, the median frequency is identified based on this intuition. The median frequency reflects the band of frequency in which energy of the spectrum is concentrated. It is a frequency domain signature which is not influenced by the non-stationary behavior of the lung sound signal. Hence, median frequency can be computed from the spectrum of the whole discrete samples available, without segmenting the signal into distinct epochs or considering the inspiratory and expiratory phases separately. Spectral roll off [40], another feature used in this article is the frequency below which 95% of energy is concentrated. Analytically, it is the frequency at which normalized cumulative PSD crosses 0.95.
For computing the maximum frequency, only the frequency components with the spectral magnitude above the mean of the spectral coefficients are deemed significant. The maximum frequency in the lung sound specimen,
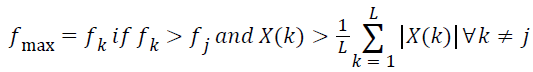 →(13)
→(13)
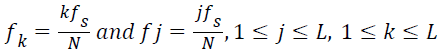 →(14)
→(14)
Dominant frequency of lung sound spectra,
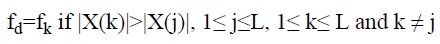 →(15)
→(15)
Spectral centroid (fc) is the sum of frequency values weighted by relative spectral magnitude of each frequency component to the total spectral magnitude. It is computed as [41],
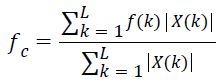 →(16)
→(16)
The pre-processing of the lung sound specimens, estimation of spectral features and statistical evaluation of the extracted features are performed in Matlab®. The statistical significance of the signatures is tested using ANOVA. Another metric used to evaluate the significance of the features is FCSM [42] denoted by ‘J’. It is the ratio of Between Class Scatter Metric (SB) and Within Class Scatter Metric (SW),
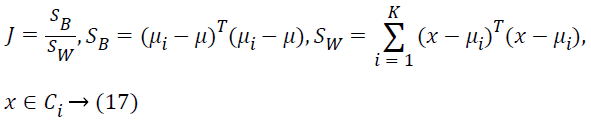
where ‘K’ is the number of classes, ‘μ’ is the total mean of feature values, ‘μi’ is the mean of feature values in the ith class, ‘Ci’.
Result and Discussions
The dominant frequency, maximum frequency and spectral centroid are computed directly from the lung sound spectra. Whereas, the median frequency and spectral roll off are computed using an analytical method from the PSD estimate of the lung sound signal. For visual evaluation, the spectrum of crackle and its PSD estimate are furnished in Figures 1 and 2, respectively, as an example. The numerical values of the spectral features estimated from different classes of lung sounds are furnished in Table 1. The numerical values of fm, fd and fmax, fc and spectral roll off, extracted from five different classes are further analyzed for their statistical significance using ANOVA. The ANOVA tables of the spectral features for different classes of lung sounds are depicted in Tables 2-6. In ANOVA, the validity of certain ‘null hypothesis’ is tested. In feature evaluation using ANOVA, the null hypothesis is, the mean of the feature values of individual classes are equal and the feature is not statistically significant or does not ensure accurate classification. The alternate hypothesis is that the mean of the feature values of classes are different and the feature is statistically significant, favoring an accurate classification. If the F-statistics is less than the critical value, null hypothesis is true and features are not good enough. Appreciably, for a statistically significant or good feature which can offer an accurate classification results, the Fstatistics should be greater than the critical value and sufficiently away from it. The p-value express the probability that null hypothesis can be true. Consequently, the p-value should be negligibly small for a good feature.
| SNo. | Specimen Title | Maximum Frequency | Median Frequency | Dominant Frequency | Spectral Roll off | Spectral Centroid |
|---|---|---|---|---|---|---|
| 1 | Bronchial 1 | 2473 | 249 | 186.6 | 1155 | 849.6 |
| 2 | Bronchial 2 | 940.7 | 14 | 13.87 | 28 | 1045.8 |
| 3 | Bronchial 3 | 896.85 | 14 | 13.86 | 27 | 93.4 |
| 4 | Bronchial 4 | 15734 | 407 | 54.72 | 560 | 708.4 |
| 5 | Bronchial 5 | 1285.6 | 186 | 131 | 966 | 625 |
| 6 | Crackles 1 | 1439.8 | 32 | 18.12 | 108 | 910.3 |
| 7 | Crackles 2 | 3284 | 31 | 14.54 | 115 | 258.6 |
| 8 | Crackles 3 | 985.99 | 19 | 16.92 | 49 | 219.8 |
| 9 | Crackles 4 | 4614.1 | 146 | 152.8 | 431 | 540.9 |
| 10 | Crackles 5 | 801.65 | 33 | 18.07 | 123 | 279.4 |
| 11 | Stridor 1 | 1291.9 | 176 | 39.34 | 547 | 397.8 |
| 12 | Stridor 2 | 1669.2 | 496 | 552.56 | 576 | 454.5 |
| 13 | Stridor 3 | 3771.1 | 568 | 570.6 | 705 | 710.2 |
| 14 | Stridor 4 | 1300.2 | 199 | 17.7 | 990 | 503.1 |
| 15 | Stridor 5 | 789.22 | 269 | 266.45 | 385 | 549.3 |
| 16 | Vesicular 1 | 596.34 | 23 | 15.94 | 38 | 910.7 |
| 17 | Vesicular 2 | 323.57 | 24 | 26.83 | 34 | 54.7 |
| 18 | Vesicular 3 | 4753.5 | 213 | 50.73 | 347 | 528.1 |
| 19 | Vesicular 4 | 4310.9 | 120 | 110.83 | 559 | 1282 |
| 20 | Vesicular 5 | 323.57 | 24 | 26.83 | 34 | 54.7 |
| 21 | Wheezes 1 | 3193.4 | 32 | 10.16 | 85 | 308.3 |
| 22 | Wheezes 2 | 804.62 | 28 | 15.6 | 165 | 320.4 |
| 23 | Wheezes 3 | 629.7 | 197 | 198.24 | 300 | 468.3 |
| 24 | Wheezes 4 | 4643.6 | 320 | 50.8 | 509 | 624.9 |
| 25 | Wheezes 5 | 934.77 | 30 | 10.1 | 85 | 184 |
Table 1: Numerical values of median, dominant and maximum frequency, spectral roll off and spectral centroid estimated from different classes of LS.
| Source | SS | DF | MS | F | Prob>F |
| Column | 220287.4 | 4 | 55071.8 | 3.1 | 0.0386 |
| Error | 355293 | 20 | 17764.7 | ||
| Total | 575580.4 | 24 |
Table 2: ANOVA table of dominant frequency.
| Source | SS | DF | MS | F | Prob>F |
| Column | 20672600 | 4 | 5168150 | 0.48 | 0.7508 |
| Error | 21580000 | 20 | 10790000 | ||
| Total | 23647200 | 24 |
Table 3: ANOVA table of maximum frequency.
| Source | SS | DF | MS | F | Prob>F |
| Column | 261890 | 4 | 65472.5 | 3.75 | 0.0197 |
| Error | 349544 | 20 | 17477.2 | ||
| Total | 611434 | 24 |
Table 4: ANOVA table of median frequency.
| Source | SS | DF | MS | F | Prob>F |
| Column | 968642.6 | 4 | 242160.6 | 2.78 | 0.055 |
| Error | 1742198.8 | 20 | 87109.9 | ||
| Total | 2710841.4 | 24 |
Table 5: ANOVA table of spectral roll off.
| Source | SS | DF | MS | F | Prob>F |
| Column | 241360.6 | 4 | 60340.2 | 0.55 | 0.6979 |
| Error | 2175224.7 | 20 | 108761.2 | ||
| Total | 2416585.3 | 24 |
Table 6: ANOVA table of spectral centroid.

Figure 1: Spectrum of the crackle.

Figure 2: PSD estimate of the crackle.
For the dominant frequency, the F-ratio is 3.1 from Table 2. But the critical value is 2.87 at a confidence level of 0.05. Fstatistics is outside the critical region so that the mean of the dominant frequency of one of the classes could be different. But F-statics lies very close to the critical value. The p-value of 0.0386 is an indication that the dominant frequency may not offer appreciable diagnostic specificity. For maximum frequency, the F-ratio is .48 from Table 3. But the critical value is 2.87 at a confidence level of 0.05. F-statistics is inside the critical region so that the mean of maximum frequency of all the five of the classes could be equal in the worst case. The pvalue of 0.7508 is an indication that the maximum frequency does not offer appreciable diagnostic specificity. For the median frequency the F ratio is 3.75 from the Table 4. But the critical value is 2.87 at a confidence level of 0.05. F-statistics is outside the critical region so that the mean of the median frequency of at least one of the classes could be different. But F-statics lies very close to the critical value. The p-value of 0.0197 is an indication that the median frequency may be helpful to distinguish certain lung sound classes. Spectral roll off (F-statistics=2.78 and p value=0.055) and spectral centroid (F-statistics=0.55 and p value=0.6979) are also statistically insignificant. For dominant frequency, maximum frequency and median frequency, spectral roll off and spectral centroid, the values of FCSM are 0.1242, 0.0192, 0.1498, 0.1112 and 0.0222, respectively. FCSM is an unbounded statistics. However, its value is expected to be amiably high for a good feature. From FCSM values it can be observed that only median frequency can be deemed statistically significant, in compliance with ANOVA (Tables 5 and 6).
The median frequency exhibits comparatively better statistical significance than other features. But from ANOVA it cannot be concluded that for which class of the lung sounds the median frequency would be distinct from the other classes. Analysis of the box whisker plot is informative in this context. The box whisker plot of the median frequency of different classes of lung sounds is furnished in Figure 3. From the box whisker plot it is evident that except the crackles, the median frequency of bronchial, stridors, vesicular and wheezes exhibit a broad dynamic range. The numerical range of median frequency of all the five classes is overlapping. It is difficult to distinguish normal and adventitious lung sounds using median frequency as a feature. However, the median frequency exhibits better variability between stridors and crackles. The statistical analysis of the frequency domain signatures would be comprehensive only when the Seperability and inter-class variability offered by these features are analyzed in feature space. The feature plot of fm, fd and fc extracted from five different classes of lung sounds, stridor, wheeze, bronchial, vesicular and crackles is depicted in Figure 4. The feature plot makes it apparent that except the median frequency, spectral roll off and dominant frequencies do have no contribution to the Seperability of the lung sound classes in the feature space.

Figure 3: Box whisker plot of median frequency of different classes of lung sounds.

Figure 4: Feature plot of significant frequency domain signatures extracted from different classes of lung sounds
Dominant frequency is the strongest frequency component in the lung sound spectra and maximum frequency is the highest frequency component. The maximum frequency specifies the frequency range of the lung sounds. But both of the signatures do not exhibit appreciable statistical significance. The median frequency indicates the band of frequencies in which the energy of the lung sound spectra is concentrated. It is notable that the statistical significance of the median frequency is better than the other four features. Hence, features like Mel Cepstral Coefficients (MFCC) which can account for the qualitative behavior of the spectra and the distribution of frequency components in the spectra would be hopefully better than the distinct features like maximum and dominant frequencies.
Normally, while investigating the statistical significance of the features of the lung sounds, the inclusion criteria of the study population would be very specific and constrained to a narrow range. But to devise an automated lung sound analyzer, features which can offer good Seperability and interclass variability, regardless of the age, gender, ethnicity and demography of the subjects should be employed. The spectral and temporal features are highly correlated to these factors. In this article, the lung sound specimens are carefully selected such that each class contains the lung sounds from pediatric, adolescent, male and female. Moreover, most of the literatures address a binary classification problem. The existing literatures mostly do a classification of lung sound signals into wheezes or non wheezes, normal or adventitious, wheezes or crackles etc. But a comprehensive automated strategy for lung sound analysis should be able to classify the entire categories of lung sounds, accurately identifying the underlying disease, regardless of the demography of the subjects. The correlation proven in literature between the air calibre and the frequency domain signatures indicate that the signatures would be helpful to identify only the obstructive pulmonary diseases.
Many of the researchers involved in lung sound analysis make use of the samples from the web resources for the validation of their feature extraction and evaluation strategies. Most of the data base lung sound signals are meant for auscultatory training rather than applications in research. The reliability of the samples from these web resources remains uninvestigated. The statistical significance of the spectro-temporal features, especially the frequency domain signatures depends purely on the protocols used for the acquisition of lung sounds. The statistical significance of the frequency domain signatures are greatly influenced by the frequency response of the sensors (either microphone or accelerometers) used for lung sound acquisition and the cut off frequency of pre-filters. The very low dominant frequency (Table 1) is a clear indication of improper sensor placement. Heart sound interference is another factor which diminishes the diagnostic utility of the lung sounds. Hence, one should be careful enough and should ensure that the standard signals used in feature evaluation and selections are pre-processed adequately. This emphasizes the need for thorough standardization in lung sound acquisition and processing.
Conclusion
The diagnostic specificity of computerized lung sound analysis always depends on the statistical significance of the features employed. The methods for lung sound analysis available in the literature which make use of the spectral features have reported the statistical significance of the features based on the study performed on a study population with very specific inclusion criteria. Most of the literatures try to classify the lung sound samples into two categories primitively like normal/ adventitious, wheezes/non-wheezes, wheezes/ crackles etc. The correlation between airway calibre and the median frequency of lung sounds established in literature just shows its utility in the diagnosis of obstructive pulmonary diseases. But an automated lung sound analyzer should be capable of performing the diagnosis from multiple classes of pulmonary disorders including the ventilatory and diffusion impairments, regardless of the age and gender of the subject. Hence, the statistical significance of the spectral features was studied on multiple classes of lung sounds from subjects differing in age, gender and other aspects, in this article. A standardized framework for the extraction of the spectral features from lung sounds, their statistical evaluation and feature selection was demonstrated.
The median frequency, dominant frequency, maximum frequency, spectral roll off and spectral centroid were extracted from five different classes of lung sounds, stridors, wheezes, bronchial, vesicular and crackles. The statistical significance of these frequency domain signatures were evaluated using ANOVA and FCSM. P-values of 0.0386, 0.7508, 0.0197, 0.55 and 0.6979 were observed at a confidence level of .05, for dominant frequency, maximum frequency, median frequency, spectral roll off and spectral centroid, respectively. For these features, the observed values of FCSM were 0.1242, 0.0192, 0.1498, 0.1112 and 0.0222, respectively. The median frequency comparatively was found to be more significant than all other spectral signatures. Median frequency was capable of discriminating the stridors and crackles. Features which account for the behavioral pattern of the lung sound spectra and carrying the information regarding the distribution of frequency components in the spectra are necessary to have accurate diagnostic decision from the lung sounds of subjects with diverse demographics.
References
- Ponte DF, Moraes R, Hizume DC, Alencar AM. Characterization of crackles from patients with fibrosis, heart failure and pneumonia. Med Eng Physics 2013; 35: 448-456.
- Gavriely N, Herzberg M. Parametric representation of normal breath sounds. J Appl Physiol 1992; 73: 1776-1784.
- Xie S, Jin F, Krishnan S, Sattar F. Signal feature extraction by multi-scale PCA and its application to respiratory sound classification. Med Biol Eng Comput 2012; 50: 759-768.
- Oud M, Dooijes EH, van der Veen MJ. Classification of asthmatic lung sound spectra. Proc Medicon CD-ROM Conference1998; 1-6.
- Masada T, Kiyasu S, Miyahara S. Unmixed spectrum clustering for template composition in lung sound classification. Proc. 12th Pacific-Asia Conference on Advances in Knowledge Discovery and Data Mining 2008; 964-969.
- Waitman LR, Clarkson KP, Barwise JA, King PH. Representation and classification of breath sounds recorded in an intensive care setting using neural networks. J Clin Monitor Comput 2000; 16: 95-105.
- Gavriely N, Palti Y, Alroy G. Spectral characteristics of normal breath sounds. J Appl Physiol Respir Environ Exerc Physiol 1981; 50: 307-314.
- Gavriely N, Nissan M, Rubin AH, Cugell DW. Spectral characteristics of chest wall breath sounds in normal subjects. Thorax 1995; 50: 1292-1300.
- Kawamura T, Matsumoto T, Miura G, Matsunaga N, Kido S, Jiang Z. Evaluation of abnormal respiratory sound "crackle" using time-expanded waveform and FFT analysis. Int J Appl Electromagnet Mech 2003; 18: 11-21.
- Fenton TR, Pasterkamp H, Tal A, Chernick V. Automated spectral characterization of wheezing in asthmatic children. IEEE Transact Biomed Eng1985;32: 50-55.
- Furman EG, Yakovleva EV, Malinin SV, Furman G, Sokolovsky V. Computer-assisted assay of respiratory sounds of children suffering from bronchial asthma. Clin Med2014.
- Mazic I, Sovilj S, Magjarevic R. Analysis of respiratory sounds in asthmatic infants. Measurement Sci Rev 2003; 3: 9 - 12.
- Xu J, Chen Q, Zhang Y, Liu S. Spectrum analysis of lung sounds. Proc. of the Annual International Conference of the IEEE Engineering in Medicine and Biology Society 1989; 1676-1677.
- Dokur Z. Respiratory sound classification by using an incremental supervised neural network. Pattern Anal Appl 2009; 12: 309-319.
- Malmberg LP, Kallio K, Haltsonen S, Katila T, Sovijarvi AR. Classification of lung sounds in patients with asthma, emphysema, fibrosing alveolitis and healthy lungs by using self-organizing maps. Clin Physiol 1996; 16: 115-129.
- Ono H, Taniguchi Y, Shinoda K, Sakamoto T, Kudoh S, Gemma A. Evaluation of the usefulness of spectral analysis of inspiratory lung sounds recorded with phonopneumography in patients with interstitial pneumonia. J Nippon Med School 2009; 76: 67 - 75.
- Jingping X, Qimin C, Yili Zhang Z, Liu S. Spectrum analysis of lung sounds. Eng Med Biol Soc 1989; 1676-1677.
- Charbonneau G, Racineux JL, Sudraud M, Tuchais E. An accurate recording system and its use in breath sounds spectral analysis. J Appl Physiol 1983; 55: 1120-1127.
- Schreur HJ, Vanderschoot J, Zwinderman AH, Dijkman JH, Sterk PJ. Abnormal lung sounds in patients with asthma during episodes with normal lung function. Chest 1994; 106: 91-99.
- Nakano H, Sano K, Maekawa J, Narita N. Relationship between power spectra of breath sounds and inspiratory flows at different frequencies. Nihon Kyobu Shikkan Gakkai Zasshi 1994; 32: 1142-1148.
- Jane R, Salvatella D, Fiz JA, Morera J. Spectral analysis of respiratory sounds to assess bronchodilator effect in asthmatic patients. Proc. 20th Annual International Conference of the IEEE, Eng Med Biol Soc 1998; 6: 3203-3206.
- Habukawa C, Murakami K, Mochizuki H, Takami S, Muramatsu R, Tadaki H, Hagiwara S, Mizuno T, Arakawa H, Nagasaka Y. Changes in the highest frequency of breath sounds without wheezing during methacholine inhalation challenge in children. Respirology 2010; 15: 485-90.
- Sovijärvi AR, Helistö P, Malmberg LP, Kallio K, Paajanen E, Saarinen A, Lipponen P, Haltsonen S, Pekkanen L, Piirilä P, Näveri L, Katila T. A new versatile PC-based lung sound analyzer with automatic crackle analysis (HeLSA); repeatability of spectral parameters and sound amplitude in healthy subjects. Technol Health Care 1998; 6: 11-22.
- Sovjarvi AR, Malmberg LP, Paajanen E, Piirila P, Kallio K, Katila T. Averaged and time-gated spectral analysis of respiratory sounds: repeatability of spectral parameters in healthy men and in patients with fibrosingalveolitis. Chest 1996; 109:1283-1290.
- Sanchez I, Vizcaya C. Tracheal and lung sound repeatability in normal adults. Respira Med2003; 97: 1257-1260.
- Kanga JF, Karaman SS. Comparison of the lung sound frequency spectra of infants and adults. Paediatr Pulmonol 1986; 2: 292-300.
- Gross V, Dittmar A, Penzel T, Schuttler F, Wichert PV. The relationship between normal lung sounds, age and gender. Am J Critical Care Medicine 2000; 162: 905-909.
- Hidalgo HA, Wegmann MJ, Waring WW. Frequency spectra of normal breath sounds in childhood. Chest 1991; 100: 999-1002.
- Anderson K, Aitken S, Carter R, Macleod JE, Moran F. Variation of breath sound and airway calibre induced by histamine challenge. Am Rev Respira Dis 1990; 141: 1147-50.
- Spence DPS, Bently S, Evans DH, Morgan MDL. Effect of methacholine induced bronchoconstriction on the spectral characteristics of breath sounds in asthma. Thorax 1992; 47: 680-683.
- Whittaker AR, Lucas M, Carter R, Anderson K. Limitations in the use of median frequency for lung sound analysis. Chest 1994; 105: 122-131.
- Malmberg LP, Anssi ARS, Paajanen E, Piirila P, Haahtela T, Katila T. Changes in frequency spectra of breath sounds during histamine challenge test in adult asthmatics and healthy control subjects. Chest 1994; 105: 122-132.
- Malmberg LP, Sorva R, Sovijärvi AR. Frequency distribution of breath sounds as an indicator of bronchoconstriction during histamine challenge test in asthmatic children. Pediatr Pulmonol 1994; 18: 170-177.
- Malmberg LP, Pesu L, Sovijärvi AR. Significant differences in flow standardized breath sound spectra in patients with chronic obstructive pulmonary disease, stable asthma, and healthy lungs. Thorax 1995; 50: 1285-1291.
- Lozano M, Fiz JA, Jané R. Automatic Differentiation of Normal and Continuous Adventitious Respiratory Sounds Using Ensemble Empirical Mode Decomposition and Instantaneous Frequency. IEEE J Biomed Health Informa 2016; 20:486-497.
- Lozano M, Fiz JA, Jané R. Performance evaluation of the Hilbert–Huang transform for respiratory sound analysis and its application to continuous adventitious sound characterization. Signal Process 2016; 120: 99-116.
- Sengupta N, Sahidullah M, Saha G. Lung sound classification using cepstral-based statistical features. Comput Biol Med 2016; 75: 118-129.
- Bokov P, Mahut B, Flaud P, Delclaux C. Wheezing recognition algorithm using recordings of respiratory sounds at the mouth in a paediatric population. Comput Biol Med 2016; 70: 40-50.
- Tabata H, Hirayama M, Enseki M, Nukaga M, Hirai K, Furuya H, Mochizuki H. A novel method for detecting airway narrowing using breath sound spectrum analysis in children. Respira Invest 2016; 54: 20-28.
- Kos M, Kacic Z, Vlaj D. Acoustic classification and segmentation using modified spectral roll-off and variance-based features. Digital Signal Process 2013; 23: 659-674.
- Fuentes WF, Lopez MR, Sergiyenko O, Navarro FFG, Castillo JR, Balbuena DH, Quiñonez JCR. Combined application of power spectrum centroid and support vector machines for measurement improvement in optical scanning systems. Signal Process 2014; 98: 37-51.
- Somorjai RL, Dolenko B, Nikulin A, Roberson W, Thiessen N. Class proximity measures – Dissimilarity-based classification and display of high-dimensional data. J Biomed Informa 2011; 44: 775-788.