Special Issue Article - Journal of Biochemistry and Biotechnology (2020) Biological Investigations on the need for integrated surveillance of SARS-CoV-2
A machine learning explanation of incidence inequalities of SARS-CoV-2 across 88 days in 157 countries.
Eric Luellen*
University of Massachusetts, Amherst, Massachusetts, USA
- Corresponding Author:
- Eric Luellen
Chief Data Scientist of Bioinformatix.io
Researcher at the University of Massachusetts, Amherst
Massachusetts, USA
E-mail: eluellen@bioinformatix.io
Accepted date: June 17, 2020
Citation: Luellen E. A machine learning explanation of incidence inequalities of SARS-CoV-2 across 88 days in 157 countries. J Biochem Biotech 2020;3(1):7-10.
Abstract
Because the SARS-CoV-2 (COVID-19) pandemic viral outbreaks will likely continue until effective
vaccines are widely administered, new capabilities to accurately predict incidence rates by location
and time to know in advance the disease burden and specific needs for any given population are
valuable to minimize morbidity and mortality. In this study, a random forest of 9,250 regression trees
was applied to 6,941 observations of 13 statistically significant independent predictor variables
targeting SARS-CoV-2 incidence rates per 100,000 across 88 days in 157 countries. One key finding is
an algorithm that can predict the incidence rate per day of a SARS-CoV-2 epidemic cycle with a
pseudo-R2 accuracy of 98.5% and explains 97.4% of the variances. Another key finding is the relative
importance of 13 demographic, economic, environmental, and public health modulators to the SARSCoV-
2 incidence rate. Four factors proposed in earlier research as potential modulators have no
statistically significant relationship with incidence rates. These findings give leaders new capabilities
for improved capacity planning and targeting stay-at-home interventions and prioritizing
programming by knowing the atypical social determinants that are the root causes of SARS-CoV-2
incidence variance. This work also proves that machine learning can accurately and quickly explain
disease dynamics for zoonoses with pandemic potential.
Keywords
SARS-CoV-2, Morbidity, Mortality, Machine learning.
Introduction
This section discusses what was known and unknown on this topic, and the resulting hypothesis. This introduction also puts the importance of using machine learning to identify models of viral infection modulators holistically and quickly into context during an era of increasingly pandemic zoonoses and their continuation until vaccines availability [1].
While it has been long believed that respiratory viral incidence rates vary by season, the first impression that humidity and temperature were the root-cause modulators has been widely assumed but is still uncertain [2]. Other studies have indicated with more certainty that respiratory viruses are modulated by humidity, temperature, and precipitation. Studies have also found that seasonal viral modulators of incidence may relate to oscillations in human hosts of pathogens [3].
Similarly, it is understood that vaccination rates impact complex models of infectious disease incidence rates [4]. However, for new zoonoses, it is usually unknown which vaccinations for other diseases are protective or increase risks against the new pathogen.
Malnourishment and obesity have been previously found to be associated with risk factors of higher susceptibility to respiratory viruses [5]. Obesity has also been found to be a morbidity and mortality risk for SARS-CoV-2, but not an infection risk factor [6].
Finally, early SARS-CoV-2 researchers observed frequency correlations with ABO blood-type groups, specifically typos O for protective qualities and types A for risks [7]. However, this result has not, before now, been generalized across time and locations.
What has been unknown for SARS-CoV-2, and most, if not all, viruses of pandemic potential, is a method to timely understand how all these types of variables combine to form a model to explain incidence rate inequalities statistically. Therefore, this study hypothesizes that machine learning can use brute-force statistical calculations to identify which factors have statistically significant associations with changes in incidence rates during a pandemic and combine and quantify them into a useful model.
Methods
In this study, machine learning--a robust statistical version of artificial intelligence--was applied to a data set of 6,941 observations to identify the relative importance of 13 demographic, economic, environmental, and public health factors in modulating the incidence rate per 100,000 population of SARS-CoV-2 across 88 days in 157 countries. The data was sourced from the public domain, such as the World Bank and United Nations, select journal articles, and weather stations [8]. The period of the epidemic curve measured began the day after cases in a country began to grow until case growth stopped or the 88-day period expired between January 23 and April 18, 2020.
Specifically, Rattle library (version 5.3.0; Togaware) in the programming language R (version 3.6.2, CRAN) was used to apply generalized linear models (GLM) to learn the p-values of each term relative to incidence rate, the targeted dependent variable. From which five terms believed to be potential modulators of incidence rate were excluded because of pvalues in excess of 0.05: maximum ultraviolet (UV) index (pvalue= 0.348), minimum temperature (p-value=0.896), humidity (p-value=0.956), dengue fever incidence rate (pvalue= 0.131), and median age (p-value=0.062) [9,10]. Where after, a series of differently sized random forest algorithms were applied, ranging from 500 to 10,000 regression trees, to learn the optimum number of regression trees to minimize error. The lowest error rate was approximately 9,250 regression trees, which was applied, using four variables at a time, which was the closest whole number to the square root of the number of predictors.
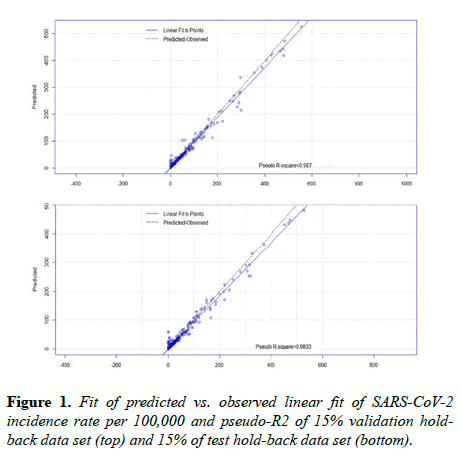
The algorithm randomly partitioned the data to select and train on 70% (n=4858), validate on 15% (1041), and test on 15% (1041) of observations. The algorithm also imputed missing numbers with the median from each data category. Two evaluation methods were used: (1) plots of linear fits of the predicted versus observed incidence; and, (2) a pseudo-R2 measure calculated as the square root of the correlation between the predicted and observed values. Results from a random forest of 9,250 regression trees were compared against results from a single regression tree (with 7 and 20 as the minimum and the maximum number of observations per split), a GLM, and a neural network model. Pseudo-R2 measure results were evaluated twice, each using the validation and testing hold-back data sets that were randomly selected during partitioning and used the average of the two accuracy findings for the results. Minitab 19 (version 19.2020.1, Minitab LLC) was used to calculate means, medians, and 95% confidence intervals.
Results
Based on the artificial intelligence and statistical analysis, 13 independent variables, each demonstrating a statistically significant relationship with incidence rate by a p-value<0.05, explains 97.4% of the variability between incidence rates during the growth phase of the SARS-CoV-2 epidemic cycle across 88 days in 157 countries. Moreover, the algorithm predicts incidence rate per 100,000 with an average pseudo-R2 accuracy of 98.5% (validation=98.7%, test=98.2%) (Figure 1). The mean of squared residuals was 229.7, making the mean residual +/- 15.2 per 100,000. The mean incidence rate per 100,000 was 25.4 (95% CI 23.4 to 27.5), with a standard deviation of 86.7 (95% CI 85.3 to 88.2). An Anderson-Darling normality test indicated the data does not follow a specific, or normal, distribution (p-value<0.005).
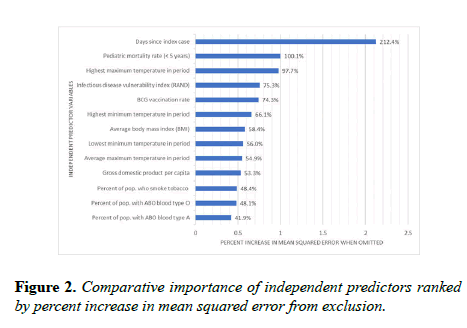
The relative importance of independent predictor variables was computed by percent increase in mean squared error (Figure 2). The mean error is the average distance between the predicted and observed values.
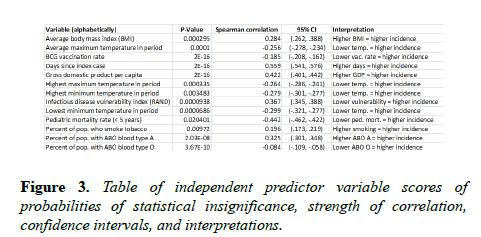
It is squared to ensure positive values and to weight greater distances. The percent increase in mean squared error is the proportional increase in the error of predictions when a variable is randomly excluded, or muted. For example, when the number of days since the index case was muted, the mean squared error increased by 212.4%, making it the most comparatively significant input predictor. Scores of tests of statistical significance, Spearman rho correlation strengths and directions, 95% confidence intervals, and high-level interpretations are in Figure 3.
Discussion
The primary importance of this work is a new capability to know in advance the order of magnitude of the disease burden of SARS-CoV-2 for any given population and time in a growth cycle. This new capability will enable leaders to make more accurate and precisely targeted decisions regarding public health interventions to minimize morbidity and mortality. For example, the incidence rates of those with a high BMI, smoke tobacco and have ABO blood type A are in three elevated risk groups for infection [7].
The secondary importance of this work is new knowledge quantifying the relative importance of the social determinants that are root causes of incidence variance. This knowledge will enable leaders to target and prioritize programming more accurately. It is distinctly crucial because several of the findings are atypical from historic viral modulators.
For example, to reduce SARS-CoV-2 morbidity and mortality, leaders may want to prioritize public health interventions focused on reducing body mass index, smoking, and pediatric mortality contributors because traditional infectious disease vulnerability and economic strength have a negative association with incidence rates [11]. Moreover, humidity and ultraviolet light exposure, which previous research suggests modulate the virus, have no statistically significant relationship with SARS-CoV-2 incidence variances.
The tertiary importance of this report is proof that machine learning methodologies can accurately and quickly inform our understanding of zoonoses' disease dynamics with pandemic potential. For example, by entering dozens of possible demographic, economic, environmental, and public health measurements as independent predictors into machine learning algorithms, they can accurately determine within hours or days which factors explain inequalities in incidence, prevalence, or disease transmission. Moreover, the algorithms can also quantify and ordinally rank the social determinants to the root causes of variances.
This report has several limitations related to data dependencies of the model. One, because the current pandemic was seeded first and most heavily in more developed countries, it may have contributed to paradoxical findings such as higher incidence where infectious disease vulnerability is lower, and economies are more robust. Two, in geographically large countries, environmental measurements vary widely. Three, approximately 3,557 (3.7%) of 97,174 data points were missing and imputed with a median; actual observations may differ from the categorical medians. Four, the analysis was conducted mid-pandemic across only 88 days. Findings after the pandemic across its duration will be more definitive. Five, because testing availability was scant during the period of observation, the incidence rates measured probably reflect more severe cases that were symptomatic and hospitalized for testing rather than the actual incidence rate. This limitation could be significant if a large portion of those infected are asymptomatic but still contagious.
Conclusion
One implication of these findings is the importance of basic public health behaviors such as weight control and tobacco use, and the factors that contribute to pediatric survivability (e.g., education, nutrition, vaccinations). The second implication of these findings is that while previous research indicates viruses are modulated by temperature and humidity, this study found that these factors may only nominally slow the transmission of more contagious viruses. A third implication of these findings is that the causes of disease incidence variances are complex and sometimes surprising. A fourth and final implication of these findings is that the usefulness of machine learning as a public health tool is encouraging.
Acknowledgements
The author wishes to thank Dr. Luka Fajs and Mr. W. Andy Chang for their helpful comments on drafts of this article.
References
- Kissler SM, Tedijanto C, Goldstein E, et al. Projecting the transmission dynamics of SARS-CoV-2 through the postpandemic period. Science. 2020;368(6493):860-68.
- Fisman D. Seasonality of viral infections: mechanisms and unknowns. Clinical Microbiology and Infection. 2012;18(10):946-54.
- Dowell SF, Ho, MS. Seasonality of infectious diseases and severe acute respiratory syndrome (SARS)-what we do not know can hurt us. The Lancet: Infectious Diseases. 2004;4:704-08.
- Earn D, Rohani P, Bolker B, et al. A simple model for complex dynamical transitions in epidemics. Science. 200;287:667-70.
- Moser JS, Galindo-Fraga A, Ortiz-Hernandez AA, et al. Underweight, overweight, and obesity as independent risk factors for hospitalization in adults and children from influenza and other respiratory viruses. Influenza and Other Respiratory Viruses. 2018;13(1):3-9.
- Petrakis D, Margina D, Tsarouhas K, et al. Obesity-a risk factor for increased COVID-19 prevalence, severity, and lethality (Review). Molecular Medicine Reports. 2020;9-19.
- Zhao J, Yang Y, Huang H, et al. Relationship between the ABO blood group and the COVID-19 susceptibility. medRxiv. 2020.
- Bhatt S, Gething, PW, Brayd OJ, et al. The global distribution and burden of dengue. Nature. 2013;496(7446)504-07.
- Seyer A, Sanlidag T. Solar ultraviolet radiation sensitivity of SARS-CoV-2. The Lancet. 2020;1(1):E8-9.
- Sajadi MM, Habibzadeh P, Vintzileos A, et al. Temperature, humidity, and latitude analysis to predict potential spread and seasonality for COVID-19. Social Science Research Network (SSRN). 2020;1-18.
- Moore M, Gelfeld B, Okunogbe A, et al. Identifying future disease hot spots: Infectious Disease Vulnerability Index (IDVI). RAND Corporation. 2016. Retrieved from https://www.rand.org/pubs/research_reports/RR1605.html


