Research Article - Biomedical Research (2020) Volume 31, Issue 1
A comparative study of application of different non-conventional filters on electroencephalogram.
Gauri Shanker Gupta1, Maanvi Bhatnagar1, Shikhar Kumar2, Rakesh Kumar Sinha3*1Department of Electrical & Electronics Engineering, Birla Institute of Technology, Jharkhand, India
2Department of Electrical & Electronics Engineering, IIT (ISM), Jharkhand, India
3Department of Bio-Engineering, Birla Institute of Technology, Jharkhand, India
- *Corresponding Author:
- Rakesh Kumar Sinha
Department of Bio-Engineering
Birla Institute of Technology Jharkhand
India
Accepted Date: June 17, 2019
Abstract
Electroencephalography (EEG) is an electrophysiological monitoring technique to capture the brains
electrical activity. It is a noninvasive recording technique in which electrodes are placed over the scalp.
EEG records the variations in voltage resulting from ionic current inside the brain neurons. In a clinical
perspective, EEG corresponds to the recording of the brain's impulsive electrical activity during a given
time period. EEG is used to diagnose epilepsy, sleep disorders, encephalopathies, etc. Hence, EEG
signals are very useful in detecting abnormalities in the human brain. But the main problem in the
analysis of these signals is due to the noise that gets added to them. These artefacts arise due to various
reasons such as due to power line disturbance (50 or 60 Hz) or due to other natural rhythms of the body
like the heartbeat, muscle movement, blinking of eyes etc. These signals get added as noise while
recording of the EEG signal and pose difficulty in correct clinical analysis. Therefore, it is necessary to
develop methods that are efficient in removing noise from these signals. Several methods such as those
based on time and frequency have been earlier utilized but failed due to their inability to remove lowfrequency
noise. In this work, several pre-processing filters have been tested on EEG data. An attempt
has been made to find the best pre-processing technique that can be used for effective cleaning of EEG
signals. From the results obtained it can be concluded that the proposed modified self-filter shows the
best results when compared with other filtering techniques such as Kalman filter, recurrent quantum
neural network (RQNN) filter, moving average (MA) filter, modified self-filter, Savitzky Golay (SG)
filter and Weiner filter.
Keywords
Electroencephalography (EEG), Modified self-filter, Savitzky Golay (SG) filter, Weiner filter, Recurrent quantum neural network (RQNN) filter, Moving average (MA) filter.
Introduction
Motivation and Incitement
The human brain is the most complex yet the most fascinating organ. Methods to decode its neuronal functions or dysfunctions are yet to be entirely definitized so far. Several neuroimaging techniques such as fMRI (functional magnetic resonance imagining), SPECT (single photon resonance imaging tomography), PET (positron emission tomography) and EEG (electroencephalography) are vastly applied in the analysis of brain functions as these are highly effective in providing the cerebral metabolic information that can easily be visualized [1]. With the advent of these techniques, it has become easier to understand the various processes occurring in the brain and their quantification has become much simpler. Amongst all the available neuroimaging techniques EEG is widely used because of its ease of acquisition, reliability, high temporal resolution, easy portability and less risk to the users [2]. The spatial resolution and specificity of the EEG recordings are low because of the volume conduction effects occurring in the brain but still, this technique has managed to outperform other methodologies for determining the kaleidoscopic brain functions and understanding the how, where, what and when functional modalities of the brain. These signals are extensively being used in cognitive science, neurophysiological studies, and clinical research applications for identification and cure of diseases such as epilepsy and sleep disorders along with the development of rehabilitation systems [3-5].
EEG signals are recorded non-invasively using an electrode cap which consists of 16, 32, 64 or more recording electrodes or using headbands or head gear that consists of dry electrodes and wireless systems. Though special precautions are taken while recording the EEG signals, these signals still get contaminated with what is called as artefacts [6]. Artefacts are unnecessary and unwanted noise signals that get mixed with the original EEG signals and distort the relevant neuronal information provided by them and makes their analysis difficult. They hide as actual EEG components and mix with the original EEG signals and hence cause an incongruity between the motivation of research and realization for actual system implementation. Moreover, the wrong diagnosis by the medics may lead to the loss of someone’s life or any other permanent damage. Also, the recorded signals have low signal to noise ratio (SNR), usually of the order 0.067-0.0954 [7]. Having such low SNR causes hindrance in the removal of noisy signals because the noise signals correspond to very low frequency. Therefore, methods that focus on both high and low-frequency noise removal have been chosen in order to cover the maximum bandwidth of EEG signals (4-50 Hz). These artefacts may arise from various environmental and biological sources such as the powerline sources used for the recording devices, a change in impedance of the recording devices, blinking of the eye, unwanted muscle movements, muscle contractions, cardiac activity, breathing, sweating, swallowing [8].
Any discrepancy in the original EEG signal indirectly or directly has an effect on the application for which these signals are being used. In clinical applications the inaccurate interpretation of EEG signals may lead to the wrong diagnosis of the disease and hence wrong medication to the patient may prove to be fatal. It is therefore very important to deal with them before further processing or analysis of these signals. It is easier to get rid of technical artefacts by improvement in recording techniques, but biological artefacts pose to be a problem. Also, in countries like India where healthcare equipment’s and facilities are not of very good quality and get corrupted with noises the need for the development of filtering techniques that are software based and do not require any extra hardware installation is necessary.
Related work
Many artefact rejection techniques have been designed and being implemented not only to make the signals noise free but be able to preserve the true nature of the EEG signal. Some conventional artefact removal techniques include principal component analysis (PCA), independent component analysis (ICA), common spatial patterns (CSP) filtering, blind source separation (BSS), regression and filtering as reviewed by Kanoga et al. [9]. Artoni et al. [10] implemented the decomposition techniques based on PCA and ICA for noise elimination from EEG signals recorded during visual memory experiment and computed that these are more suitable for offline analysis. However, the disadvantage of using PCA is that it becomes difficult to reconstruct the overall signals using the linear combinations of the principal components because of the ignorance of signals with small amplitudes and irregular changes. On the other hand, ICA faces the difficulty of detecting signal components if Gaussian noise is contaminated in the manner that noise spreads over in an undesirable way into the signal components. BSS technique for rejection of muscle and ocular artefacts was implemented by Mowla et al. [11] on EEG signals recorded from healthy males sitting idle. But decomposition using this technique prove to be tedious, time-consuming and computationally complex. In the mid-1990’s regression techniques for this purpose were widely used for non-stationary EEG data as for example by Kenemans et al. [12]. Sanjana and Patel [13] presented a technique, to categorise Ocular Artefact region and create reference signal, in which Discrete Wavelet Transform (DWT) is applied with Adaptive method. The problem in using wavelet signals is that the disintegration of contaminated signals could not be distinguished from EEG substitutes having more ocular artefacts. Chavez et al. [14] discussed a novel surrogate-based artefact removal (SuBAR) for automatic eradication of artefact from single-channel EEG. The limitation of this method, however, was as the spectrum of noisy EEG was similar to the stationary process, this method was unable to find the long and stubborn muscular artefacts. Most of the research is either focused on the improvement of existing techniques or the development of hybrid techniques that can be used for this purpose [15]. Limited literature is available on the comparison of different techniques used for artefact rejection. A common methodology that can be utilized to perfectly remove artefacts has still not been defined.
Methods
Contributions
Methods based on digital filtering such as Kalman filter [16], Savitzky Golay (SG), recurrent quantum neural network (RQNN) [17], self-filtering and moving average (MA) filter have been tried and tested upon in this paper to detect the best filter for artefact removal. Further modifications in self filter has been done to enhance its efficiency for artefact removal. Kalman filter has been used to remove the uncorrelated noise in time. SG and MA filters are commonly used for signal smoothing. RQNN filters rely on quantum mechanics and Schrodinger wave equation for improving the SNR ratio. The advantage of using time domain filters is that the raw data can directly be applied to the filter and the output is obtained, unlike frequency domain filtering techniques which require computation of root mean square value and Fourier transform of the signal which has a high latency rate and delay. Also, they are found to be more efficient in removing the Gaussian noise, random noise and pink noise which occur due to different sources as mentioned before [18]. Although these filters have consistently been used for noise removal from EEG signals, in this paper slight modifications have been done in the existing methods to improve their performance. The aforementioned filters are used for data smoothing and removal of noise. Their filtering capabilities are tested on EEG data. A known amount of machine generated noises are added to these signals and the comparison of filters is done based on various parameters such as signal correlation and mean square error. Hence, the scope of the work proposed is concentrated on the optimal selection of time domain-based filter that are robust to variations in real-time implementation.
Review of Filtering Techniques
Kalman filter
This algorithm finds a wide application in removing noise from time series data. The main advantages of these filters are their small computational time and requirements, sophisticated recursive properties and its ability as an estimator for one dimensional linear system embedded with Gaussian noise. To make estimations it uses the past and present observations because of its recursive nature [19]. Estimation of the state of the system at a given time ‘T’ is computed from the previous state obtained at ‘T-1’, described with the help of stochastic linear differential equation given as:
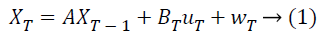
Here, XT represents the state vector, µT is the control input vector, A is the state transition matrix, BT is the input control matrix and wT represents the system noise.
The measured signal is given as follows:
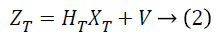
Here, ZT is the measurement vector, HT represents the transformation matrix that correlates the measurement ZT with system state XT. VT is the random variable which represents the measurement vector.
This algorithm is used for removing the noise from the data with the help of a two-layer network of prediction and measurement stage. An autoregressive model of order 3 is utilized for parameter estimation [20].
Savitzky-Golay filter
Savitzky-Golay (SG) algorithm is a digital FIR smoothing polynomial filter used for noise removal in low frequency data. Smoothing is done based on the least squares fitting of polynomials to frames of noisy data segments. This is achieved by fitting consecutive subsets of end-to-end data points using a lower degree polynomial with the help of least squares. The filter parameters are chosen using experimental procedure and a frame length of 41 and polynomial of order 3 is chosen for the SG filter [21]. It is known to maintain the original morphology of the signal while simultaneously giving the smallest peak distortion and an increased signal to noise ratio for non-stationary signals like EEG.
Moving average filter
This is also a kind of low pass finite impulse response filter (FIR) used for data smoothing applications of short-term fluctuations occurring in time series data. It analyses the data points by decomposing the whole dataset into smaller subsets also known as windows and taking their average. The subsets are so chosen such that they are equal in number from either side of the central value [22]. In our study a window of length 6 is taken for which the moving average can be defined as:
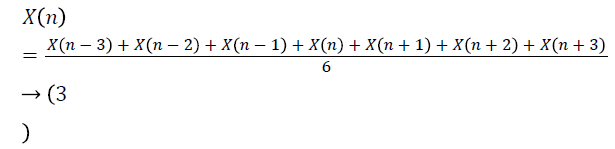
here X(n) is the original signal.
Recurrent Quantum Neural Network (RQNN) filter
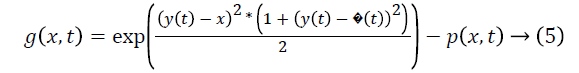
Gandhi et al. proposed RQNN architecture in which a noisy signal is used to excite the neural lattice making the topology stable [23]. Here the output of the probability density function act as a feedback to the kernel function. The error generated here is weighted to evaluate the potential function V(x,t) expressed as:

Where  is scaling factor used to activate the potential
function. W (x, t) is weight matrix and g (x, t) is the Gaussian
kernel function which is given as:
is scaling factor used to activate the potential
function. W (x, t) is weight matrix and g (x, t) is the Gaussian
kernel function which is given as:
Where y(t) is raw signal and  is the estimated signal x
position of the particle in the neural lattice, t is the time and p
(x, t) is the pdf. The potential function V (x, t) modulates the
Schrodinger Wave equation (SWE) which can be expressed in
terms of wave function ψ (x, t) as:
is the estimated signal x
position of the particle in the neural lattice, t is the time and p
(x, t) is the pdf. The potential function V (x, t) modulates the
Schrodinger Wave equation (SWE) which can be expressed in
terms of wave function ψ (x, t) as:
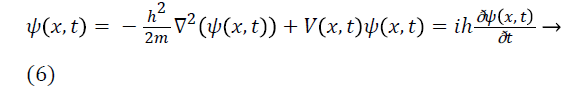
Where h is planks constant taken as 1 and m mass of particle. The estimated signal can be found through maximum likelihood function (MLE) which is given as:
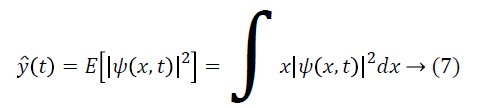
Here  is the pdf of the signal and E [.] is expected
vector. The synaptic weight can be updated by following rule:
is the pdf of the signal and E [.] is expected
vector. The synaptic weight can be updated by following rule:

 is the de-learning rate which is used to forget the previous
value of the weight matrix since EEG signal is nonstationary
signal and λ is learning rate which is used to update the weight
matrix. The de-learning rate is used to limit the weight matrix
from going to infinite as the rightmost term is positive. The
SWE is evaluated by Crank-Nicolson method [24]. The
parameters of RQNN m, λ and ζ is evaluated by using particle
swarm optimization.
is the de-learning rate which is used to forget the previous
value of the weight matrix since EEG signal is nonstationary
signal and λ is learning rate which is used to update the weight
matrix. The de-learning rate is used to limit the weight matrix
from going to infinite as the rightmost term is positive. The
SWE is evaluated by Crank-Nicolson method [24]. The
parameters of RQNN m, λ and ζ is evaluated by using particle
swarm optimization.
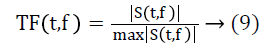
Self-filtering
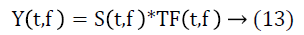
For the development of transfer function Stockwell transform (ST) [25] and modified ST (MoST) has been used. The transfer function TF for self-filtering is given as:
Where S (t, f) is the ST or MoST of the EEG signal. The S transform S (t, f) of a signal x (t) is given as:
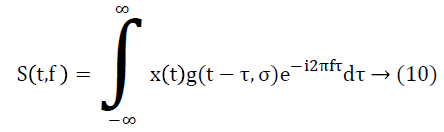
Where g(t-τ,σ) is Gaussian function is given
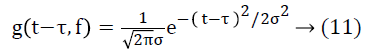
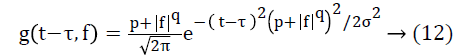
Where τ is translational in time domain t and σ is dilation in frequency domain. The standard ST cannot handle the noise in the EEG signal therefore MoST introduced by Zhang et al. [26] has been employed here which increases the time and frequency domain resolution. The Gaussian window used for MoST is given as:
After evaluating the transfer function of SF from (10), the filter is realized by following equation
The filtered signal y(t) has been reconstructed is given as:
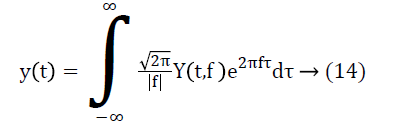
It is to be noted that SF deemphasizes the low amplitude feature on S spectrum compared to the large amplitude therefor the random noise feature, which has low amplitude is attenuated.
Performance Evaluation
Implementation on EEG signal
EEG signals are widely used in detection of various diseases as well as psychophysiological disorders and hence need to be free of noise so as to avoid incorrect diagnosis. The correct pre-processing methods play an important role which most importantly maintains the original signal structure. Keeping this in mind and taking into account the complex nature of EEG signals different filtering techniques is tested upon complex EEG data.
Dataset description
The dataset used in this paper is the BCI Competition IV 2012 Dataset 2b which is comprised of 2 classes of motor imagery (http://www.bbci.de/competition/iv/#dataset2a) [27].
These signals are then added with a known amount of noise. The final signal embedded with noise can be described as:
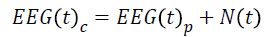
Where EEG(t)c the contaminated is EEG signal, EEG(t)p is
the pure EEG signal and N(t) represents the noise components.
The noise added is either white Gaussian, random or pink noise
[28]. Here analysis is done mainly on machine generated noise
because they are the major source of noise which occur during
recording of EEG data. Gaussian noise is a form of statistical
having probability density function (pdf) similar to that of the
normal distribution which is also called the Gaussian
distribution. The different values that the noise can be taken
varying according to the Gaussian distribution. It is referred to
as white noise because it is assumed that the power is
uniformly distributed across the entire frequency spectra or in
simpler words it can be said that it has equal amount of all the
colours. Hence, white noise is equally present in all the
frequency bands having same power [29]. Therefore, in
frequency domain, level of noise is flat throughout at each
frequency. The term Gaussian comes from the fact that the
noise signal has a normal distribution in time domain having a
zero-mean value. Random noise is also derived from white
Gaussian noise. Pink noise is a type of coloured noise whose
PSD is inversely proportional to the frequency. Hence it is also
called as  noise or flicker noise. It derives its name from the
pink appearance of visible light having this power spectrum. In
pink noise the noise energy is equally distributed per octave
[30]. The PSD shows a decrease of 3 dB per octave which is
equivalent to 10 dB/decade. It is predominantly found in lower
frequency bands having a PSD given as
noise or flicker noise. It derives its name from the
pink appearance of visible light having this power spectrum. In
pink noise the noise energy is equally distributed per octave
[30]. The PSD shows a decrease of 3 dB per octave which is
equivalent to 10 dB/decade. It is predominantly found in lower
frequency bands having a PSD given as  with
exponent θ being equal to 1 for electrophysiological signals.
This is also known as the power law which can be generalized as
with
exponent θ being equal to 1 for electrophysiological signals.
This is also known as the power law which can be generalized as The value of θ ranges from -2 to 2 and X X is
a constant function.
The value of θ ranges from -2 to 2 and X X is
a constant function.
The EEG signals are given as an input to different filters and their performance is tested.
Performance evaluation
Performance evaluation is done to validate the goodness of a filter in removing the noise from the EEG signals. The true EEG signals are embedded either with 0 dB random noise, 5 dB or 15 dB white Gaussian noise and 5 dB and 15 dB pink noise. Efficiency of the filters is tested using different filter evaluation parameters as discussed henceforth.
Evaluation parameters: The different parameters used for evaluation of filters are as follows:
Correlation: It is the measure of dependence between two variables. It is calculated using:
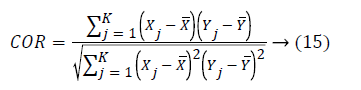
Here and Yj are the signals being compared with mean X andX.
A perfect correlation is achieved between the filtered and pure EEG signal if the correlation coefficient is 1 [31].
Coherence: Coherence is the measure of similarity between
two signals, that is how well a signal x corresponds to another
signal y at different frequencies. Its values are bounded
between 0 and 1. 0 indicates that the two signals Xj are linearly
independent and the value 1 corresponds to linearly dependent
signals. Coherence of two signals x and y is calculated as
follows: 
Here Pxy is the cross PSD of signals x and y and Pxx and Pyy are the PSD of the signals with respect to itself [32].
Signal to noise ratio (SNR): Signal-to-noise ratio (abbreviated SNR) is a measure that compares the level of a desired signal to the level of background noise. SNR is defined as the ratio of signal power to the noise power, often expressed in decibels. A ratio higher than 1:1 (greater than 0 dB) indicates more signal than noise.
Power spectral density estimation: It determines the distribution of signal power over the entire frequency range. It is an important measure in determining the effectiveness of the filter. Maximum the difference between the PSDs of a signal before and after the filtration, the better is the filter quality. It is an indicator of the amount of other frequency components present in a signal apart from those in the desired frequency range [33,34]. Lesser the value of PSD lesser are the other unwanted signals present. PSD here is obtained using the Fast Fourier Transform with the help of the following equation:
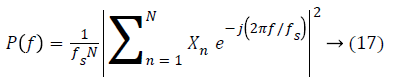
Here, N represents the number of samples, fs is the sampling frequency and xn is the signal whose PSD is to be calculated.
Mean Square Error (MSE): It is obtained by calculating the difference between true EEG signals and filtered EEG signals.
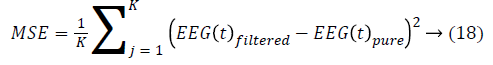
Here K represents the number of samples.
Results and Discussion
The noisy EEG signals are denoised using different filters one by one and their efficiency is tested based on the filter parameters. The EEG signals are added to each of the different type of noises. All the noisy signals are filtered using the filters and an attempt has been made to find the most suitable filter for a given type of signal. The different filter parameters used for developing the filters are discussed as follows.
SG a finite impulse response smoothing filter is designed having an order of 3 with a frame length of 31. A SG filter performs much better than other conventional filters if correct frame length and order are chosen. The parameters chosen are as presented by [31]. The plot obtained after filtering the EEG signal embedded with random noise of 0 dB is shown in Figure 1. Similarly, for MA smoothing filter a frame length of 6 was chosen and the filtering plot obtained using this signal for EEG wave filtration embedded with 5 dB white Gaussian noise is as shown in Figure 2. For filtration using RQNN filters a number of tuning parameters are taken into consideration, which needs to be tuned appropriately. These parameters are chosen with the help of PSO. For EEG signals the chosen value of m, lambda and zeta are 0.5, 0.9 and 2, respectively. Similarly, parameters of self-filter and modified self-filter are also tuned to obtain the best results. Figure 3 represents the filtering plot for RQNN filter for EEG wave embedded with 15 dB Gaussian noise. The filtering plots obtained for EEG waves embedded with 5 dB pink noise and 15 dB white Gaussian noise are as shown in Figures 4 and 5 for SF and modified Figure 6 shows the plot for filtering using Kalman for 0 dB random noise for EEG wave. The noisy signal and filtered signal are both plotted in the same graph for all the cases. As stated, before the classification of best filter was done based on different evaluation parameters discussed before. Table 1 discuses correlation, PSD and SNR values obtained using different filters for class 1 signal of dataset 2b. Table 2 illustrates the result for coherence and MSE values after filtration for the same signal. From the results as seen in Tables 1 and 2 it can be observed that all the filters show a correlation value of almost 0.9 for all the filters between the raw EEG and filtered EEG. This indicates that all the filters apart from removing noise also retain the original signal effectively. Therefore, choosing the best filter based on just this parameter is difficult. The coherence values lie between the range of 0.2 and 0.7 for all the filtering techniques used while mostly being on the lower side. The lower the coherence value the more likely it is for the two signals to be related to each other. The MSE value obtained is found to be the least in case of SG filter, almost nearer to 0 for all the types of added noise. Kalman filter also exhibits a very low MSE of 0.159 for random noise addition. SNR ideally should be as high as possible because more the SNR more is the signal content. All the filters exhibit a SNR value of 22-24 dB for random noise signals. PSD is the measure of how the signal is distributed with respect to frequency. It determines the distribution of signal power over the entire frequency range. It is an important measure in determining the effectiveness of the filter. Maximum the difference between the PSDs of a signal before and after the filtration, the better is the filter quality. It is an indicator of the amount of other frequency components present in a signal apart from those in the desired frequency range. The PSD before filtration was -11.64 dB/Hz and it varied between -13.178 to -30.3015 dB/Hz.

Figure 1: Filtration plot using SG filter for EEG signal added with 0 dB random noise.

Figure 2: Filtration plot using MA filter for EEG signal added with 5 dB white Gaussian noise.

Figure 3: Filtration plot using modified RQNN filter for EEG signal added with 15 dB white Gaussian noise.

Figure 4: Filtration plot using SF filter for EEG signal added with 5 dB pink noise.

Figure 5: Filtration plot using modified SF filter for EEG waves added with 15 dB white Gaussian noise.

Figure 6: Filtration plot using Kalman filter for EEG signal added with 0 dB random noise.
| Filter\Type of Noise | Random Noise | White Noise (5 dB) | White Noise (15 dB) | Pink Noise(5 dB) | Pink Noise(15 dB) | ||||||||||
|---|---|---|---|---|---|---|---|---|---|---|---|---|---|---|---|
| Corr. | SNR | PSD | Corr. | SNR | PSD | Corr. | SNR | PSD | Corr. | SNR | PSD | Corr. | SNR | PSD | |
| M.A. | 0.963 | 22.92 | -17.7 | 0.974 | 5.29 | -17.4 | 0.691 | 1.6 | 1.98 | 0.953 | 9.2 | -18.1 | 0.863 | 8.1 | -17.1 |
| S. G. | 0.985 | 24.83 | -16.6 | 0.978 | 5.73 | -17 | 0.944 | 3.15 | -13.1 | 0.969 | 11.3 | -17.7 | 0.799 | 1023 | -18.3 |
| S. F. | 0.941 | 21 | -13.3 | 0.92 | 2.66 | -19.5 | 0.487 | 5.22 | -12.8 | 0.944 | 7.62 | -26.3 | 0.784 | 6.2 | -16.2 |
| Modified S. F. | 0.924 | 22.3 | -27 | 0.915 | 3.77 | -22.5 | 0.829 | 5.49 | -15 | 0.895 | 7.98 | -25.5 | 0.915 | 8.8 | -35.6 |
| RQNN | 0.824 | 21.7 | -28 | 0.953 | 4.79 | -23.5 | 0.979 | 5.89 | -17 | 0.995 | 9.98 | -28.5 | 0.978 | 6.8 | -18.3 |
| Kalman | 0.996 | 24.4 | -12.2 | 0.901 | 6.8 | -1.43 | 0.552 | 28.6 | -7.57 | 0.959 | 10.59 | -8.74 | 0.853 | 11.29 | -9.4 |
Table 1. Evaluation parameters (corr, SNR, PSD) for class 1 EEG wave embedded with different types of noise.
| Filter\Type of Noise | Random Noise | White Noise (5 dB) | White Noise (15 dB) | Pink Noise(5 dB) | Pink Noise (15dB) | |||||
|---|---|---|---|---|---|---|---|---|---|---|
| Coherence | MSE | Coherence | MSE | Coherence | MSE | Coherence | MSE | Coherence | MSE | |
| M.A. | 0.272 | 1.245 | 0.25 | 0.818 | 0.176 | 1.542 | 0.24 | 1.595 | 0.31 | 0.52 |
| S. G. | 0.262 | 0.404 | 0.233 | 0.59 | 0.2 | 1.537 | 0.235 | 0.801 | 0.33 | 0.9 |
| S. F. | 0.345 | 2.847 | 0.213 | 2.922 | 0.145 | 2.492 | 0.312 | 2.573 | 0.12 | 3.2 |
| Modified S. F. | 0.257 | 2.508 | 0.229 | 2.581 | 0.184 | 1.415 | 0.26 | 3.24 | 0.29 | 4.4 |
| RQNN | 0.24 | 1.308 | 0.329 | 0.585 | 0.194 | 0.425 | 0.32 | 0.23 | 0.22 | 0.13 |
| Kalman | 0.776 | 0.159 | 0.255 | 2.789 | 0.198 | 0.975 | 0.388 | 1.068 | 0.28 | 2.1 |
Table 2. Evaluation parameters (Coherence, MSE) for class 1 EEG wave embedded with different types of noise.
The correlation and coherence values indicate the difference between pure and impure EEG signals. It can be observed that modified self-filter has correlation and coherence values, which clearly indicate its efficiency in filtration. The signal to artefact ratio and MSE obtained using modified self-filter is also low, which corresponds to very less artefacts in filtered signals.
The plot for MSE for EEG signals added with random noise is as shown in Figures 7, 8. x-axis indicates the different filters. 1 stands for SG, 2 for MA, 3 for SF, 4 for modified SF, 5 for RQNN and 6 for Kalman filter.

Figure 7: MSE plot for random noise added class 1 EEG wave.

Figure 8: MSE plot for 15 dB white Gaussian noise added class 1 EEG wave.
Taking into consideration all signals and all the filtering techniques it cannot be stated that one filter is superior to others. Choice of filter depends mainly on signal to be filtered and the quantity and type of noise added in it. According to the feasible filter orders suggested by Xian et al. [35] to obtain best filtration using SG filter, further analysis was also conducted on filter of order 2 and 4 and according to the results obtained it was concluded that filter of order 3 was found to be most suitable. Similarly, MA filter with varying window lengths were also tested, ranging from 4-7 and window length of 6 was found to be most efficient. Parameters for RQNN were chosen using PSO hence, hence obtained filter is most optimized.
Conclusion
The different adaptive filters are designed and applied for EEG signals. The design parameters of the filter are varied in a certain feasible range and all the possible combinations are evaluated using dataset 2b. The parameters corresponding to the highest correlation coefficient are the optimal design parameters of the filter. The designed filter is tested successfully on noisy EEG signal for different values of SNR. It is revealed that the modified SF filter removes the noise as well as the original shape of the signal is, maintained. The technique proves to be computationally simple, fast and efficient. Further, the method can also be used for other signals such as ECG, EMG, EOG, and EGG. In this article, the authors presented consistent comparison of the most popular methods of EEG signal pre-processing to facilitate subsequent EEG classification process. Automatic algorithms such as: Self- Filtering, Weiner Filtering (in the task of EEG artefact removing) and combinations of these algorithms were implemented and tested. Experiments show that the best results (classification accuracy improvement) was obtained for modified self-filtering. The developed pre-processing algorithms that use self-filtering are more difficult to implement on-line. While the modified self-filtering algorithm can be used without any problem in any BCI. In addition, it was observed that the sophisticated pre-processing methods improved classification results particularly.
Acknowledgement
The authors would like to acknowledge with much obligation the crucial role of Graz University and the team who involves in EEG signal recordings and make it available online for new findings and analysis. Authors are also very thankful for the help received from Mr. Subhojit Ghosh faculty member Department of Electrical Engineering, National Institute of Technology, Raipur in the completion of this work in present form.
References
- Ramadan RA, Vasilakos AV. Brain computer interface: control signals review. Neurocomputing, 2017; 223: 26-44.
- Ang KK, Chua, KS, Phua KS, Wang C, Chin ZY, Kuah CW, Low W, Guan C. A randomized controlled trial of EEG-based motor imagery brain-computer interface robotic rehabilitation for stroke. Clin EEG Neurosci 2015; 46: 310-320.
- Ang KK, Guan C. EEG-based strategies to detect motor imagery for control and rehabilitation. IEEE Trans Neural Syst Rehabil Eng 2016; 25: 392-401.
- Chaudhary U, Birbaumer N, Ramos-Murguialday A. Brain–computer interfaces for communication and rehabilitation. Nat Rev Neurol 2016; 12: 513-525.
- Ang KK, Guan C, Chua KSG, Ang BT, Kuah C, Wang C, Phua KS, Chin ZY, Zhang H. Clinical study of neurorehabilitation in stroke using EEG-based motor imagery brain-computer interface with robotic feedback. Conf Proc IEE Eng Med Biol Soc 2010; 2010: 5549-5552.
- Noureddin B, Lawrence PD, Birch GE. Online removal of eye movement and blink EEG artifacts using a high-speed eye tracker. IEEE Trans Biomed Eng 2012; 59: 2103-2110.
- Muthukumaraswamy SD. High-frequency brain activity and muscle artifacts in MEG/EEG: a review and recommendations. Fronti Hum Neurosci 2013; 7: 138.
- Lawhern V, Hairston WD, McDowell K, Westerfield M, Robbins K. Detection and classification of subject-generated artifacts in EEG signals using autoregressive models. J Neurosci Methods 2012; 208: 181-189.
- Kanoga S, Mitsukura Y. Review of Artifact Rejection Methods for Electroencephalographic Systems: In Electroencephalography 2017.
- Artoni F, Monaco V, Micera S. Selecting the best number of synergies in gait: preliminary results on young and elderly people. IEEE Int Conf Rehabil Robot 2013; 1-5.
- Mowla MR, Ng SC, Zilany MS, Paramesran R. Artifacts-matched blind source separation and wavelet transform for multichannel EEG denoising. Biomed Signal Process Control 2015; 22: 111-118.
- Kenemans JL, Logemann HA, Lansbergen MM, Van OSTW, Böcker KB. The effectiveness of EEG-feedback on attention, impulsivity and EEG: a sham feedback controlled study. Neurosci let 2010; 479: 49-53.
- Sanjana VD, Patel VP. A combination of RLS algorithm with Wavelet transform for Detection and Removal of OA from EEG signal. AIJRSTEM 2015; 15: 161-165.
- Chavez M, Grosselin F, Bussalb A, Fallani FDV, Navarro-Sune X. Surrogate-based artifact removal from single-channel EEG. IEEE Trans Neural Syst Rehabil Eng 2018; 26: 540-550.
- Lawhern V, Hairston WD, McDowell K, Westerfield M, Robbins K. Detection and classification of subject-generated artifacts in EEG signals using autoregressive models. J Neurosci 2012; 208: 181-189.
- Shahabi H, Moghimi S, Zamiri-Jafarian H. 2012, October. EEG eye blink artifact removal by EOG modeling and Kalman filter. In: International Conference on BioMedical Engineering and Informatics 2012.
- Gandhi V, Prasad G, Coyle D, Behera L, McGinnity TM. EEG-based mobile robot control through an adaptive brain–robot interface. IEEE Trans Syst Man Cybern A Syst Humans 2014; 44:1278-1285.
- Shin Y, Lee S, Ahn M, Cho H, Jun SC, Lee HN. Noise robustness analysis of sparse representation based classification method for non-stationary EEG signal classification. Biomed Signal Process Control 2015; 21: 8-18.
- Wang Y, Veluvolu KC, Lee M. Time-frequency analysis of band-limited EEG with BMFLC and Kalman filter for BCI applications. J Neuroeng Rehabil 2013; 10: 109.
- Muhammad B, Jusof MFM, Shapiai MI, Adam A. Feature selection using binary simulated Kalman filter for peak classification of EEG signals. In: 8th International Conference on Intelligent Systems, Modelling and Simulation 2018.
- Acharya D, Rani A, Agarwal S, Singh V. Application of adaptive Savitzky–Golay filter for EEG signal processing. Perspect Sci 2016; 8: 677-679.
- Azami H, Mohammadi K, Bozorgtabar B. An improved signal segmentation using moving average and Savitzky-Golay filter. JSIP 2012; 3: 39-44.
- Gandhi V, Prasad G, Coyle D, Behera L, McGinnity TM. Quantum neural network-based EEG filtering for a brain–computer interface. IEEE Tran Neural Netw Learn Syst 2014; 25: 278-288.
- Gandhi, Vaibhav S. Quantum neural network based EEG filtering and adaptive brain-robot interfaces (Doctoral dissertation, University of Ulster). Proc Int Jt Conf Neural Netw 2013; 4: 522-528.
- Dylov DV, Fleischer JW. Nonlinear self-filtering of noisy images via dynamical stochastic resonance. Nat Photonics 2010; 4: 323.
- Zhang XS1, Roy RJ, Jensen EW. EEG complexity as a measure of depth of anesthesia for patients. IEEE Trans Biomed Eng 2001; 48: 1424-1433.
- Ang KK1, Chin ZY, Wang C, Guan C, Zhang H. Filter Bank Common Spatial Pattern Algorithm on BCI Competition IV Datasets 2a and 2b. Front Neurosci 2012; 6: 39.
- Estrada E, Nazeran H, Sierra G, Ebrahimi F, Setarehdan SK. Wavelet-based EEG denoising for automatic sleep stage classification. Conf Proc IEEE Eng Med Biol Soc 2018; 1151: 295-298.
- Higashi H, Rutkowski TM, Washizawa Y, Cichocki A, Tanaka T. EEG auditory steady state responses classification for the novel BCI. Conf Proc IEEE Eng Med Biol Soc 2011; 4576-4579.
- Wei Q, Xiao M, Lu Z. A comparative study of canonical correlation analysis and power spectral density analysis for SSVEP detection. PLoS One 2011; 2: 7-10.
- Zhang Y, Zhou G, Jin J, Wang M, Wang X, Cichocki A. L1-regularized multiway canonical correlation analysis for SSVEP-based BCI. IEEE Trans Neural Syst Rehabil Eng 2013; 21: 887-896.
- Tung SW, Guan C, Ang KK, Phua KS, Wang C, Zhao L, Teo WP, Chew E. Motor imagery BCI for upper limb stroke rehabilitation: An evaluation of the EEG recordings using coherence analysis. Conf Proc IEEE Eng Med Biol Soc 2013; 261-264.
- Park Y, Luo L, Parhi KK, Netoff T. Seizure prediction with spectral power of EEG using cost-sensitive support vector machines. Epilepsia 2011; 52: 1761-1770.
- Al Ghayab HR, Li Y, Siuly S, Abdulla S. Epileptic EEG signal classification using optimum allocation based power spectral density estimation. IET Signal Processing 2018; 12: 738-747.
- Shu-Xian H, Xi-Ru W, Chin L, Shou-Yu H. Landau-Kleffner syndrome with unilateral EEG abnormalities: Two cases from Beijing, China. Brain Dev 1989; 11: 420-422.