Research Article - Environmental Risk Assessment and Remediation (2017) Volume 1, Issue 1
Water quality surveillance of boreholes around landfill site in Eligbolo-Eliozu, Obio/Akpor local government area, Rivers State, Nigeria.
1Department of Geography and Environmental Management, University of Port Harcourt, Nigeria
2Department of Geology, Faculty of Science, University of Port Harcourt, Nigeria
- *Corresponding Author:
- Dr. Nwankwoala HO
Department of Geography and Environmental
Management
University of Port Harcourt
Nigeria
Tel: +234 (0) 803 672 3009, +234 (0) 705 528 5704
Email: nwankwoala_ho@yahoo.com
Accepted date: February 21, 2017
Citation: Nwankwoala HO, Ogbonna VA. Water quality surveillance of boreholes around landfill site in Eligbolo-Eliozu, Obio/Akpor local government area, Rivers State, Nigeria. Environ Risk Assess Remediat. 2017;1(1):44-49
Abstract
This study evaluated the water quality status of boreholes around a landfill site in Port Harcourt, Nigeria. Borehole water samples were taken around the landfill site and standard analytical methods were employed. The results indicated that Electrical Conductivity (EC), TDS, Fe, CO2, and NH3 have high concentrations exceeding DPR guideline. EC and TDS with values ranging from 39.5 μS/cm to 102.4 μS/cm and 110mg/l to 1355 mg/l indicated high concentrations of dissolved organic contents on the landfill. NH3 concentration were also high with values ranging from 4.57 mg/l to 9.61 mg/l. Salinity concentration ranges from 180.50 mg/l to 481.37 mg/l and Chloride with concentration values of (300 mg/l and 266.67 mg/l) are below DPR guideline, indicating low salt content in the water. COD has a high value of (117.39 mg/l). Carbondioxide (CO2), with high values range between 2420.09 ppm to 6634 ppm. This is because of high amount of organic and inorganic matters released from the landfill and can be toxic to human's health. Ammonia (NH3) with values of (3.26 mg/l), (2.95 mg/l), (9.61 mg/l), (4.57 mg/l), (9.61 mg/l) and (8.24 mg/l), respectively is above DPR limit, indicating that the landfill is characterized by biogas. This is due to an oxygen deficit in decomposition of organic matters. Regular monitoring of groundwater quality in the area is recommended.
Keywords
Water quality, Boreholes, Groundwater, Landfill, Pollution, Port Harcourt, Nigeria.
Introduction
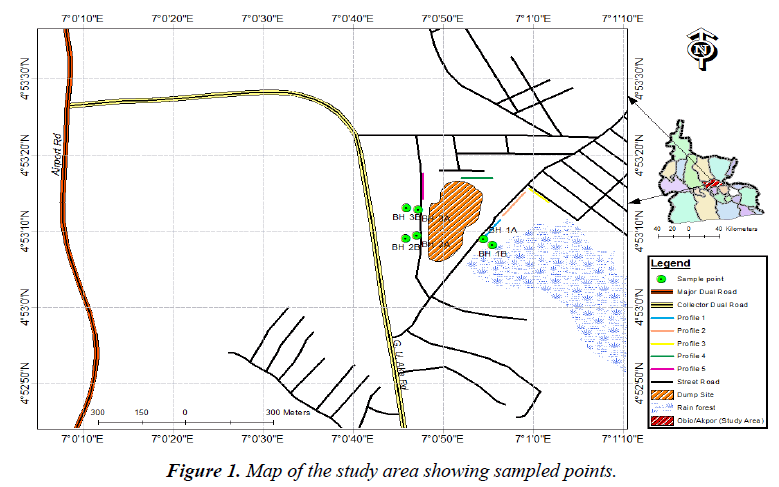
The Eligbolo-Eliozu community is located in Obio/Akpor Local Government Area between latitudes 4o 45'N and 4o 60'N and longitudes 6o50'E and 8o00'E in the Niger Delta of Nigeria. The dump site is about 0.22 km away from G.U Ake Road formerly known as Olu-Obasanjo By-pass (Eliozu) and 2.72 km away from Rumuokoro junction. Figure 1 is the map of Obio/Akpor Local Government Area indicating the study area.
The study area is located on sedimentary basin of the Southern Part of Nigeria with topography configuration that have evolved from the sedimentary patterns of the last 75,000 years as reported by Allen, sited in Oyegun. The areas fall within the coastal belt on the sedimentary environment that corresponds lithologically to the Agbada, Akata, and Benin formations from earliest to recent of the modern Niger Delta [1]. The soils in the region are mainly sandy-loams, humus, alluvium and outer belt of salt water swamps, clay and mud. The soils are rich in phosphorus because of nutrients from the volcanic parents’ materials.
The sands are fine, coarse grained, unconsolidated and granular in texture. The depth to the usable aquifer in the area is approximately 30 m - 45 m, which is penetrated by most burials in the vicinity of the dumpsite [2]. The vegetation found is thick mangrove forest, raffia palms, and light rainforest, due to drainage pattern. It also drains both fresh and salt water. The salt water is caused by intrusion of sea water inland.
Solid waste management is a serious problem in Nigeria, as most cities lack standard engineered landfills. The lack of provision of proper engineered sanitary landfills for disposal of wastes by the local government authorities and the state governments has given room for the proliferations of open dumps that are scattered in every nook and cranny [3]. Landfill constitutes potential health hazards and environmental problems. In spite of these deleterious effects of landfills, they remained the cheapest and most widely accepted methods of depositing municipal solid waste (MSW) in most parts of the world [4-7]. The solution to health hazards related to open dump site inevitably lies in the use of standard engineered landfills and recycling ofwaste, which are lacking in most developing countries, including Nigeria.
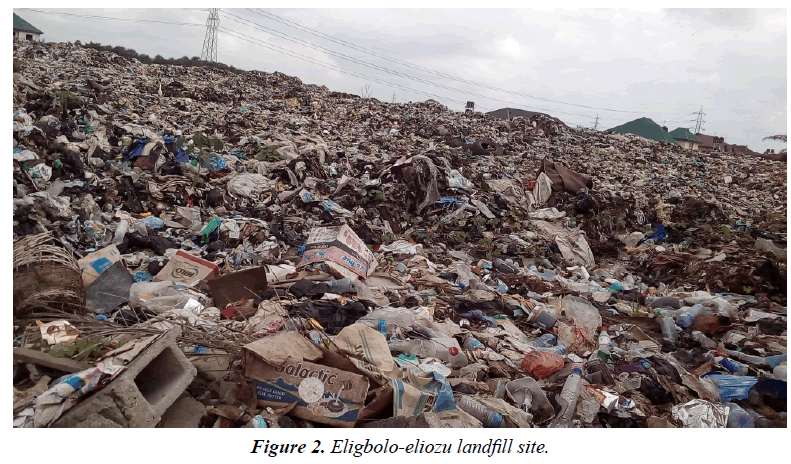
High amounts of waste generation, improper disposal and management in Eligbolo-Eliozu (Figure 2) community is probably a threat to the residence, as they inhaled some doses of polluted air from the dumpsite through decomposition of organic matters and burning of tyres, exposed to contaminated groundwater and agricultural products, due to cluster settlements round the landfill and some cases of water tap odour and ill-health are major problem facing the people. Landfills has generated high dosage of heavy metals that have been implicated to illness in some landfills, such as ulcers, diarrheal, nausea, abdominal pain, gastrointestinal disorder, psychological disturbances as well as others to life threatening disease such as cancers, cardiovascular disease, asthma, kidney and liver damage, coma and diabetes [8]. Of which, some residents may not be far from the infection of disease around the study landfill. Therefore, urgent attention by the Government and non-governmental organization to redress the waste management policy that will sustain life and properties in our environment is necessary. This study therefore is to determine the impacts of Landfill on groundwater quality across Eligbolo-Eliozu landfill.
Methodology
The Sampling points were divided into three classes (class one, two, and three) and raw Samples were collected at 2 points in each class with an interval of 40m between points, BH1A &B, BH2A & B, and BH3A & B (Table 1). The collection point of class one is 200 m away from collection points of class two and three. The Samples of classes two and three was collected at the distance of 20 m away from the landfill due to high topography while class one Sample point was collected at 10 m away from the landfill and the depths of the sampled points were determined as well. The Sampled points include: BH-1A, BH-1B, BH-2A, BH-2B, BH-3A, and BH-3B. The Samples were randomly collected, sealed, and kept in the cooler and immediately taken to research laboratory for analysis to avoid microbial contamination [9].
| Raw Samples Result of Boreholes 1 AB, 2AB and 3AB | |||||||
|---|---|---|---|---|---|---|---|
| Sample Identifications | BH 1 A | BH 1 B | BH2A | BH2B | BH3A | BH3B | DPR EGASPIN Intervention levels (mg/l) |
| pH | 6.2 | 6.3 | 6.7 | 6.5 | 6.5 | 7.0 | 6.5-8.5 |
| Temperature (°C) | 24 | 24.2 | 23°C | 24°C | 24.5 | 24.3 | 35°C |
| Conductivity | 65.0 | 67.5 | 43.5 | 39.5 | 39.4 | 102.4 | 8 µS/cm |
| Salinity | 541.53 | 302.87 | 240.69 | 180.50 | 481.37 | 361.03 | 600 mg/l |
| DO | 4.20 | 3.14 | 5.43 | 4.57 | 4.86 | 2.57 | 7.5-8.5 |
| Chloride | 300 | 166.67 | 133.33 | 100.00 | 266.67 | 200.00 | 250 mg/l |
| TDS | 510 | 565 | 240 | 115 | 110 | 1355 | 800 mg/l |
| BOD | 0.08 | 0.112 | 0.456 | 0.228 | 0.572 | 0.456 | 10.00 mg/l |
| COD | 23.91 | 36.09 | 30.44 | 26.09 | 117.39 | 36.09 | - |
| CO2 | 2420.09 | 5503.39 | 6634.08 | 6300.43 | 4004.19 | 4698.36 | - |
| NO3 | 11.89 | 10.75 | 35.00 | 16.63 | 35.00 | 30.00 | - |
| Ammonia (NH3) | 3.26 | 2.95 | 9.61 | 4.57 | 9.61 | 8.24 | 0.20 mg/l |
| Cadmium (Cd) | -0.004 | -0.004 | -0.129 | -0.088 | -0.210 | -0.025 | 0.01 mg/l |
| Chromium (Cr) | -0.139 | -0.081 | -0.004 | -0.004 | -0.005 | -0.010 | 0.03 mg/l |
| Lead (Pb) | -0.054 | ND | ND | ND | ND | ND | 0.075 mg/l |
| Arsenic (As) | ND | ND | ND | ND | ND | ND | 0.06 mg/l |
| Iron (Fe) | 1.152 | 0.389 | 0.466 | 0.319 | 0.158 | 3.856 | 1 mg/l |
| Depth (m) | 3 m | 2.37 m | 4.70 | 3.91 | 1.76 | 1.05 | - |
Table 1. The physiochemical Characterisation of groundwater in all the three classes.
Results
Discussion of Results
Table 2 shows that there is no significant relationship between depths and groundwater quality around the study Area. Classes 1, 2 and 3 of BH 1, 2 and 3 indicates that pH ranges from 6.2 to 7.0, at different depths. The pH increases from BH1A (6.2) to BH1B (6.3) and declined in BH2B (6.5) and picked up in BH3B (7.0). Temperature ranges from 23°C to 24.5°C at the depths of 1.05 m to 4.70 m indicating an increasing concentration on groundwater. The temperature increased from BH1A (24°C) to BH1B (24.2°C) in class one, more higher in BH2A (24.5°C) and declined in BH2B (24.3°C), declining to 23°C in BH3A and increasing to 24°C in BH3B and at the depth of 4.7 m in BH 3A the value decreases to 23°C and is below DPR guideline.
| No | pH | EC | Temp. | Salinity | DO | Cl2 | TDS | COD | BOD | CO2 | NO3 | NH3 | Fe | Depth (m) |
|---|---|---|---|---|---|---|---|---|---|---|---|---|---|---|
| 1 | 6.2 | 65 | 24 | 541.53 | 4.2 | 300 | 510 | 23.91 | 0.08 | 2420.09 | 11.89 | 3.26 | 1.52 | 3 |
| 2 | 6.3 | 67.5 | 24.2 | 302.87 | 3.14 | 166.67 | 565 | 36.09 | 0.112 | 5503.39 | 10.75 | 2.95 | 0.389 | 2.37 |
| 3 | 6.7 | 65 | 24.5 | 240.69 | 5.43 | 133.33 | 240 | 30.44 | 0.456 | 6634.08 | 35 | 9.61 | 0.466 | 4.7 |
| 4 | 6.5 | 43.5 | 24.3 | 180.5 | 4.57 | 100 | 115 | 26.09 | 0.228 | 6300.43 | 16.63 | 4.57 | 0.319 | 3.94 |
| 5 | 6.5 | 38.5 | 23 | 481.37 | 4.86 | 266.67 | 110 | 117.39 | 0.572 | 4004.19 | 35 | 9.61 | 0.158 | 1.76 |
| 6 | 7 | 102.4 | 24 | 361.03 | 2.57 | 200 | 135 | 36.09 | 0.456 | 4698.36 | 30 | 8.24 | 3.856 | 1.05 |
Table 2. Spearman's rank correlation of depths and groundwater.
Electrical Conductivity (EC) ranges from 39.5 μS/cm in BH 3A to 102.4 μS/cm in BH3B showing high proportion of salt in the groundwater at the depth of 1.76 m to 1.05 m. Conductivity increases in class1 from BH1A (65 μS/cm) to BH1B (67.5 μS/ cm) and declining in class 2 from BH2A (65 μS/cm) to BH2B (43.9 μS/cm) while in class3 it declined more in BH3A (39.9 μS/cm) and picked up in BH3B (102.4 μS/cm), exceeding DPR Guideline.
Salinity concentration ranges from 180.50 mg/l to 481.37 mg/l, increases from class 2 with values of BH2A (240.69 mg/l and 180.50 mg/l) to class3 with values of BH3A (481.37 mg/l and BH3B361.03 mg/l) and increases more in class1of BH1A with values 541.53 at the depth of 3.0 m and decreases in BH1B (302.87 mg/l) at 40m interval. The high values are indicated in charts, and below DPR Guideline. The concentration of Dissolved oxygen ranges from 2.57 mg/l to 5.43 mg/l at the depths of 1.05 m to 4.70 m. In class one, BH1A (4.2 mg/l) declined in BH1B (3.14 mg/l), class2 of BH2A (5.43 mg/l) declined in BH2B (4.57 mg/l) and class3 of BH3A (4.86 mg/l) and BH3B (2.57 mg/l. Chloride content ranges from 100 mg/l to 300 mg/l. In class one, BH1A rises from 300 mg/l and falls in BH1B (166.67 mg/l), increases in BH2A (133.38 mg/l) and declined in BH2B(100 mg/l) and again increases in BH3A (266.67 mg/l) and declined in BH3B (200 mg/l), BH1A (300 mg/ l),high values above DPR Guideline are recorded in BH1A(300 mg/l)at the depth of 3.91 m and BH3A (266.67 mg/l) at the depths of 3 m and 1.76 m and is below DPR Guideline. This compound contains more than 50% chlorine and about 20% sodium. Therefore, high chloride concentration also coincides with wells of high sodium concentration.
TDS concentration ranges from 110 mg/l to 1355 mg/l, increases in class one of BH1A (510 mg/l) and BH1B (565 mg/l) at interval of 40 m. Whilst decreasing in class2 of BH2A (240 mg/l), BH2B (115 mg/l) and in Class3 of BH3A (110 mg/l) which could be probably due to low permeability of water to drive dissolved matters or low amount of TDS present in the contour line. And it picked up in BH3B with 1355 mg/l at shallow depth above DPR Guideline at the depth of 1.05 m. The concentration of biological oxygen demand (BOD) is between the ranges of 0.08 mg/l to 0.572 mg/l. The concentration of chemical oxygen demand (COD) ranges from 23.91 mg/l to 117.39 mg/l. The concentration of Carbon dioxide (CO2) ranges from 2420.09 ppm to 6634.08 ppm at the depths of 1.05 m to 4.70 m, due to lack of gas diffusion, temperature and content of organic compound in the subsurface. The concentration is higher in BH2A (6634 ppm) and BH2B (6300.43 ppm) at the depths of 4.70 m and 3.91 m indicating that deep Aquifer accommodates more gas than shallow aquifer. Nitrate concentration is predominant in all the boreholes, but higher in BH2A,3A, and 3B at the depths of 4.70 m,1.76 m and 1.05 m, rises in BH1A (11.89 mg/l) and falls in BH1B (10.75 mg/l), picked up in class2 of BH2A (35 mg/l) and declined in BH2B (16.63 mg/l). In class three, it increased in BH3A (35 mg/l) and declined in BH3B (30 mg/l), indicating trickling down of concentration.
Ammonia concentration ranges from BH1B (2.95 mg/l) to BH2A (9.61 mg/l) and 3A (9.61 mg/l) trickling down from the source point. While Iron concentration ranges from BH3A (0.158 mg/l) to BH3B (3.856 mg/l) at the depths of 1.76 m to 1.05 m. The concentration of Iron in BH2B (0.319 mg/l), 1B (0.389 mg/l), 1A (1.152 mg/l) and BH3B (3.856 mg/l) is above the DPR guideline.
The results analyzed from the two techniques applied in this study indicates that pH value ranges from 6.2 to 7.0, indicating neutrality of water, due to high concentration of CO2, decreases the concentrations of volatile acids solubilisation of organic matters on the landfill [10]. The temperature is at the range of BH1B (24.2°C), BH2A (24.3°C) and BH2B (24.5°C) below DPR guideline, which probably lead to decrease in DO, BOD, nitrification and the oxidation of ammonia to nitrate that led to oxygen deficit in water. The concentration of Electrical Conductivity (EC) ranges from 39 cm to 102 cm exceeding the DPR guideline, indicating higher proportion of sodium and chloride, and high amount of dissolved materials. TDS with concentration values of (510 mg/l, 565 mg/l) and (1355 mg/l), indicating high concentration of dissolved organic matters in shallow bore hole with value of (1335 mg/l) exceeding DPR guideline and may cause gastro-intestinal irritation, undesirable taste and corrosion of pipes. Salinity concentration ranges from 180.50 mg/l to 481.37 mg/l and Chloride with concentration values of (300 mg/l and 266.67 mg/l) are below DPR guidelines, indicating low salt content in the water. COD has a high value of (117.39 mg/l). Carbondioxide (CO2) with high values, ranges between 2420.09 ppm to 6634 ppm. This is because of high amount of organic and inorganic matters released from the landfill and can be toxic to human's health. Ammonia (NH3) with values of (3.26 mg/l), (2.95 mg/l), (9.61 mg/l), (4.57 mg/l), (9.61 mg/l) and (8.24 mg/l) is above DPR limit, indicating that the landfill is characterized by biogas. This is due to an oxygen deficit in decomposition of organic matters and it causes pulmonary irritation and nervous system damage [11,10]. While Iron, the only trace Metals was detected with values of (1.152 mg/l, 0.389 mg/l, 0.466 mg/l, 0.319 mg/l, and 3.856 mg/l) exceeded DPR Guideline. It causes nuisance to health in terms of taste, colouration of water and corrode materials.
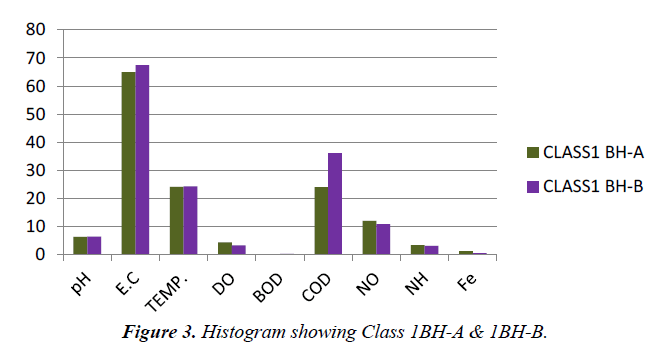
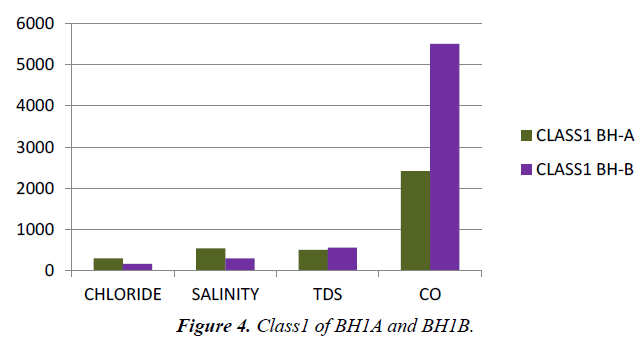
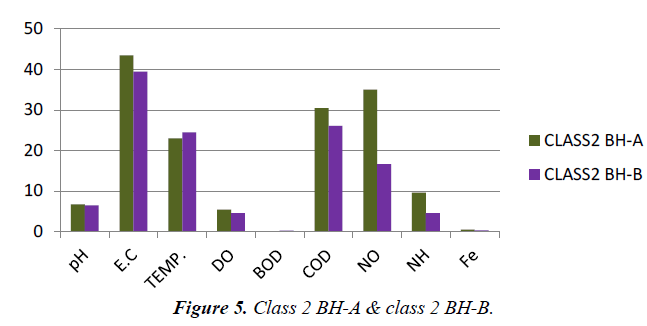
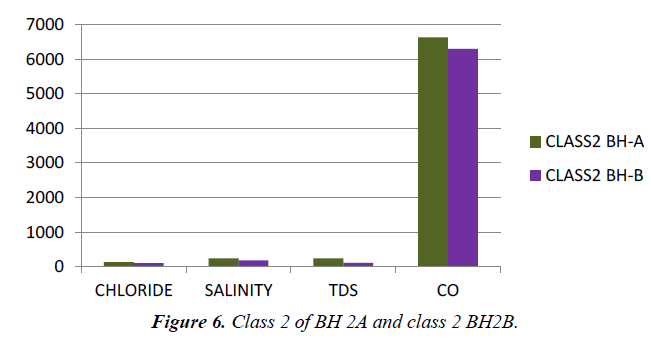
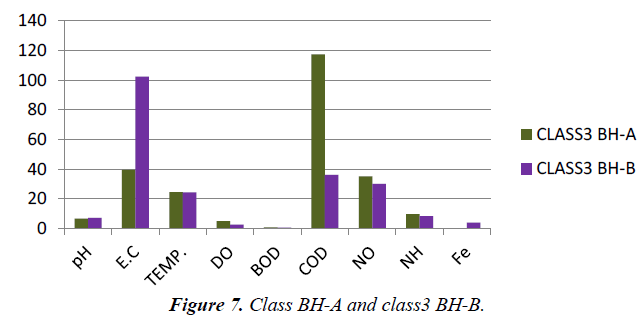
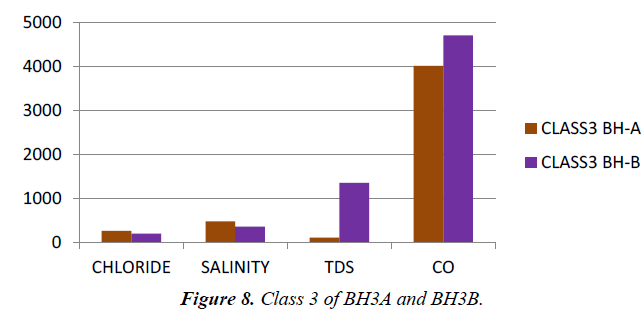
Heavy Metals such as Lead (Pb+), Cadmium (Cd+), Arsenic (As), and Chromium (Cr+) were not detected in the study. Because the anaerobic degradation that is taking place in the landfill is characterized by waste gases such as Ammonia, CO2 and probably methane, leading to neutral pH and low COD. This is as a result of low concentration of volatile acids that dwindles the growth of toxic metals whilst Ammonia will continue to be released by acet-ogenic process [10]. Figure 3 shows the Class 1BH-A & 1BH-B while Figure 4 Class1of BH1A and BH1B. Figure 5 shows Class 2 BH-A and Class 2 BH-B. Figure 6 depicts Class 2 of BH 2A and Class 2 BH2B while Figure 7 shows Class BH-A and Class3 BH-B. Figure 8 shows Class 3 of BH3A and BH3B.
Conclusion
This study revealed that Electrical Conductivity (EC), TDS, Fe, CO2, and NH3 have high concentrations exceeding DPR guideline. EC and TDS with values range between 39.5 μS/ cm to 102.4 μS/cm and 110 mg/l to 1355 mg/l respectively indicated high concentrations of dissolved organic contents on the landfill [12]. Carbondioxide (CO2), with high values range between 2420.09 ppm to 6634 ppm. This is because of high amount of organic and inorganic matters released from the landfill and can be toxic to human's health. Ammonia (NH3) with values of (3.26 mg/l), (2.95 mg/l), (9.61 mg/l), (4.57 mg/l), (9.61 mg/l) and (8.24 mg/l), respectively is above DPR limit, indicating that the landfill is characterized by biogas. This is due to an oxygen deficit in decomposition of organic matters. It is recommended that regular monitoring of groundwater quality in the area is necessary.
References
- Short KC, Stauble AJ. Outline geology of Niger Delta. Am Assoc of Petr Geol Bull. 1967;51:761-79.
- Ebeniro JO, Ehirim CN. 2-D Electrical Resistivity Monitoring of a municipal Solid waste dumpsite in Port Harcourt, Nigeria. Journal of Environmental Toxicology and Food Technology. 2013;2:29-34.
- Agozu IE, Oghama OE, Akinyemi OO. Physico-chemical Assessment of Leachate Quality in Effurun Waste Dumpsite, Southern Nigeria. Journal of Nigerian Environmental Society (JNES). 2015;9(1):1-11.
- El-Fadel M, Findikakis AN, Leckie JO. Environmental impacts of solid waste landfilling. Journal of Environmental Management. 1997;50(1):1-25.
- Daskalopoulos E, Badr O, Probert SD. An integrated approach to municipal solid waste management. Res Cons Rec. 1998;24(1):33-50.
- Jhamnani B, Singh SK. Groundwater contamination due to Bhalaswa Landfill site in NewDelhi. World Academy of Science, Engineering and Technology. 2009;3:413-17.
- Ugwu SA, Nwankwoala HO, Worlu SN. 2-D Resistivity Imaging and Modeling of a Dumpsite in Eneka, Rivrs State, Nigeria. Issues in Scientific Research. 2016;1(3):37-44.
- Ajah CK, Ademiluyi J, Nnaji CC. Spatiality, seasonality and ecological risk and heavy metals in the vicinity of a degenerate municipal central dumpsite in Enugu, Nigeria. Journal of Environmental Health Science & Engineering. 2015;3(1):55-65.
- Ehirim CN, Ebeniro JO, Olanegan OP. A geophysical investigation of Solid Waste Landfill Using 2-D Resistivity Imaging and Vertical Electrical Sounding Methods in Port Harcourt Municipality, Rivers State, Nigeria. The Pacific Journal of Science and Technology. 2009;10(2):12-22.
- Heyer KU, Stegman R. Landfill Systems, Sanitary Landfilling of Solid wastes, long term problems with Leachate: Biotechnology. 1998;11:44-51.
- https://www.scribd.com/document/319887512/What-Do-Your-Water-Test-Results-Mean.
- Ehirim CN, Itota GO. Radiological Impact of a Municipal Solid Waste Dumpsite on Soil and Groundwater Using 2-D Resistivity Tomography and Gamma Ray Spectroscopy. The Pacific Journal of Science and Technology. 2013;10(2):23-9.
