Research Article - Biomedical Research (2017) Volume 28, Issue 12
SOM clustering approach: investigation on cataract surgery structural changes in iris
Preethi DMD1* and Jayanthi VE21Department of Computer Science and Engineering, PSNA College of Engineering and Technology, Kothandaraman Nagar, Dindigul, Tamil Nadu, India
2Department of Electronics and Communication Engineering, PSNA College of Engineering and Technology, Kothandaraman Nagar, Dindigul, Tamil Nadu, India
- *Corresponding Author:
- Preethi DMD
Department of Computer Science and Engineering
PSNA College of Engineering and Technology
Tamil Nadu, India.
Accepted date: March 11, 2017
Abstract
We present a novel technique to examine the consequence of cataract surgery. Iris is one of the best biometric due to its unique biological properties. It is stable throughout the life. Cataract surgery may cause changes in the iris structure. A cataract is an eye disease that causes the eye’s lens to become cloudy and opaque with decreased vision. Aging, obesity, family history, heavy drinking, high blood pressure, smoking, diabetes, myopia or sun exposure are the risk factors of cataract. This paper proposes an algorithm to improve the level of security or match the unmatched person due to structural and textural changes in irises. Feature vector results from gober are applied to SOM clustering approach. Our proposed method has been evaluated by a dataset composed of different irises of an individual before and after the surgery which are collected from various studies. Experimental results and performance comparisons have presented.
Keywords
Eye, Retina, Feature selection, Classification, Image analysis, Ocular disease, Cluster analysis.
Introduction
Biometric verification is the process by which a person can uniquely identify by evaluating one or more distinguishing biological markers either physical characteristics like facial shape, fingerprint, hand geometry, earlobe geometry, retina [1] and iris patterns, DNA, etc., or behavioral characteristics like voice, signature, typing rhythm, etc. Biometric uses irises [2] to identify a person by enrolling the basic information, storing the basic information and comparing with the existing database information. Human iris is stable throughout the life span [3]. Iris may get affected structurally and texturally due to many reasons. External factors that influence changes in the iris are medication, diseases, surgery, and age. Difficult to predict the level of changes when iris affected by cataract. Blurring of the lens in the eye and possessions in inadequate vision. Blurred vision, faded color, glare, bad night vision and duple visualization are the symptoms of cataract. In 2014 world health report published that 33% of blindness caused by cataract [4]. Proteins inside the lens of age populace are prone to tie and turn into stiffer to form cloudy spots (cataracts) which have specified [5]. More than 50% of all Americans at the age of 65 or above suffer from age-related cataracts in U.S. [6].35% of the Singapore Chinese population over the age of 40 have age-related cataracts [7]. Diabetes is one of the risk factor of cataract. In India, peoples at an early age of 20 to 40 years suffer from diabetes [8]. Posterior sub capsular cataract, cortical cataract, and nuclear cataract are the three various types of age-related cataracts [9]. Automatic detection of cataract based on texture and intensity analysis is proposed [10]. Global thresholding is demoralized to solve the underdetection problem for strict cataract images. Cataract diagnosis is possible at the early stage and measured the attenuation coefficient of lens from echo signals and it is exemplified [11]. Model-based approach [12] has used to detect robust lens structure, and then the grading features are extracted. Support Vector Machine (SVM) regression model has applied to determine the nuclear cataract. Moreover, cataract surgery has no upshot on iris recognition, whereas pupil dilation of drops may conquer in iris based authentication system [13]. Segmentation has applied to extract the iris, then DCT (Discrete Cosine Transform) has applied to get the iris codes, finally numerical distance between the two iris codes are determined by hamming distance. Eye conditions of patients can be checked by slit-lamp images and cataract disease easily diagnosed [14]. Densitometry analysis for grading nuclear cataract has verified with the use of slit-lamp cinematography [15]. It is more reliable to grade the severity of nuclear opacity.
Automatic grading approach nuclear cataract diagnosis has demonstrated using Wisconsin cataract grading protocol, lens contour has discovered and features have designated from the segmented lens area then, SVM regression scheme is inspected to envisage the grade of nuclear cataract [16]. Automatic iris recognition technique for healthy eyes and those influenced by cataract is presented [17]. Significant degradation in iris recognition also reliability has decreased. LASIK (Laser- Assisted in-Situ Keratomileusis) surgery [18] causes structural changes in iris. Therefore, it degrades iris recognition system. Masek's algorithm has implemented, structural changes have recorded in pupil diameter and a visible deviation from pupil circularity during refractive surgery. Out of 14 iris images taken for experiment one iris image is failed in matching, false rejection rate is 7.14%. Computer-aided diagnosis method via ranking for nuclear cataract diagnosis was evaluated using a ranking measure with the use of learning to rank method is enlightened [19]. Systematic survey about medical conditions that affect iris recognition is provided [20]. Author described that cataract is also one of the disease to fail in iris biometric. About 50% of people matured 65–74 and about 70% of those matured 75 and older have visually momentous cataracts [21]. In [22], hamming distance is used to verify the patients before and after the cataract surgery. Iris has deeply predisposed and people necessitate to re-enroll in iris biometric systems after the cataract surgery. The principle of cataract surgery is to eradicate the natural lens of the eye and insert an imitation one (referred as an Intra Ocular Lens, or IOL) in order to renovate the lens’ transparency. Automatic recognition of high-level surgical tasks using microscope video analysis for cataract surgeries is demonstrated [23]. Refractive index irregularities in older lenses have nearly relation to degenerative changes in structure with various forms of cataract have designated [24]. An x-ray Talbot interferometric method using synchrotron radiation shows fine changes in lenses with opacities is explained [25]. Awareness of cataract symptoms, how to gauge, elementary appreciative of the surgery to correct cataracts has expounded [26]. Recent development in cataract surgery is explained [27].
This article presents a new novel technique for the consequence of cataract surgery in the iris recognition system and performance analysis for image quality verification. An overview of the remainder of this article is as follows. Section 2 describes the materials and methods used in the proposed system. Results and performance analysis reports are explained in section 3. Conclusion is given in section 4.
Materials and Methods
A functional diagram of proposed iris recognition system based on cataract surgery is illustrated in Figure 1. Pre-processing, edge detection, feature extraction, template generation, pattern matching, classification are the building blocks of this proposed system.

Figure 1: Block diagram of the proposed system.
Pre-processing
Pre-processing is used to improve the quality of the captured and stored iris image in order to increase the chances of the successful completion of the subsequent processes to be carried out on the image and this preprocessing enhances the contrast of the image, removes the noise which occurs while sending the captured image to the storage section of the camera and also isolates the objects of interest in the image. In this process, original color image is converted into a grayscale image [28].
Edge detection
Discontinuities in intensity values of the image has found with the use of edge detection. It is detected by using first and second-order derivatives. A Canny edge detection [29] algorithm is applied to detect the edges of the iris and find s accurate parameters of pupil and limb in the iris. Equation 1 is used for canny edge detection.
[g, t]=edge (I, ‘canny', thresh) → 1
Specifies sensitivity thresholds for the canny method. Thresh denotes a two-element vector. First element and second element specifies low threshold and high threshold. Non-sparse 2D numeric array represented as I. A logical array g represents 1s at the locations where edge points detected in the array I and 0s elsewhere. A parameter t is optional.
Template generation
Template matching [30] is to encode the iris image from two dimensional brightness data down to a two dimensional binary signature referred to as a template. This is the input data which are passed into two directional filters to determine the existence of ridges and their orientation. Segmentation, normalization, feature encoding are the steps involved in template generation. Flow of template matching is represented in the Figure 2.

Figure 2: Illustration of iris template generation.
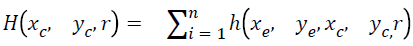
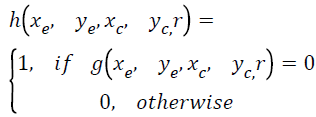
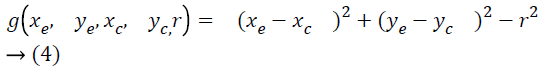
Gray image conversion, histogram equalization are the steps involved in preprocessing. Automatic segmentation is performed to find an iris region from an eye image. It isolates noise areas such as occluding eyelids and eyelashes. Thresholding is applied to remove the eyelashes. Hough transform has involved to find a circle that returns the coordinates of a circle in an image with radius r, center (xc, yc), edge points (xe, ye) is represented by the Equations 2-4.
 →(2)
→(2)
Where
 →(3)
→(3)
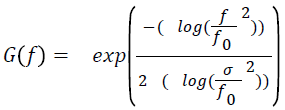
Canny edge detection is applied to create the edge map. Normalization and 1D-log gober filter is applied to produce the iris template and it is described in Equation 5.
 →(5)
→(5)
f0 represents center frequency and σ indicates the bandwidth of the filter.
Feature extraction
Feature extraction [31] transforms preprocessed data into a set of features (also named feature vector). Proposed system use a gabor filter [32] algorithm to get adequate texture information for different frequency. Two-dimensional Gabor filters in discrete domain are represented by the following Equations 6 and 7.
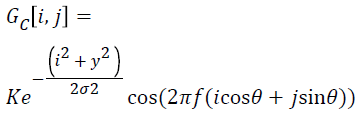 →(6)
→(6)
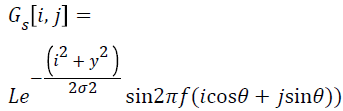 →(7)
→(7)
Where K and L are normalizing factors to be determined. f defines the frequency, θ represents direction, σ denotes the size of the image region being analysed.
Pattern matching
After cataract surgery, image is compared to database image (before cataract surgery image). If iris features are matched, then iris is perfect, otherwise structural changes can be identified.
Classification
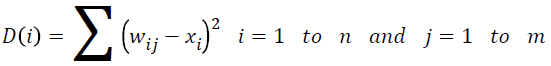
One of the neural network techniques, SOM (Self Organizing Map) [33] is used in this proposed work. It is an unsupervised learning algorithm [34]. Topological structure property is observed in SOM [35]. There are ‘m’ cluster units, arranged in a one or two dimensional array and the input signals are n-tuples [36]. The cluster unit whose weight vector matches the input pattern is approximately selected as winner. Input vector is compared with the target vector and if they differ, the weights of the network are altered slightly to reduce the error in the output. Euclidean distance (D) is computed between the input vector and weight vectorwij is represented is Equation 8.
 →(8)
→(8)
Smallest distance is computed and updated the weights using Equation 9.
 →(9)
→(9)
Where x denotes the input vector, i and j indicates index values .This is repeated many times and with many sets of vector pairs until the network gives the desired output. SOM topology, SOM Neighbor weight distances, SOM input planes, SOM weight positions, SOM neighbor connections, SOM sample hits are represented in the following Figure 3.

Figure 3: SOM clustering results.
Experimental Results and Discussion
Proposed method is tested on before and after the surgery due to cataract clinical data base iris image. For this test ten set of images are taken and few of their simulation results are viewed in Figures 4 and 5. Figure 4 individual image size is 249 × 96 pixels.

Figure 4: Results of edges and feature.

Figure 5: Template generated for before and after the cataract surgery.
Performance analysis
Risk factors [37] are considered as critical factors of cataract such as age greater than 45, diabetics [38], family history, blood pressure, obesity, dry eye, smoking, alcohol, ultraviolet sunlight, genetic characteristics. In decision tree exploration probability, cost, benefits are basic elements. Decision tree is an artistic representation that helps clinicians in raising a decision constructed on the history of a patient’s disease. Based on the past patients results, problems are treated easily. Probability can be calculated based on the strongest evidence. Study is carried out on various patients from general public, along with survey reports. Structural changes due to cataract are represented as decision tree in Figure 6.

Figure 6: Decision tree of structural change due to cataract.
Probability based structural changes is evaluated by assigning weighted value for different ranks are 1.0, 0.75, 0.5, and 0.0. When all people are examined, chance of structural change is 40% and not yet is 60%. Event probability has been calculated as
Probability for all people: 0.4 × 0.75+0.6 × 0.5=0.3+0.3=0.6
Probability for selected people: 0.4 × 0.00+0.6 × 1.0=0.0+0.6=0.6
This analysis is helpful for clinicians to identify the changes in the iris.
The object of this work is to identify whether the structure get change due to cataract surgery or not. In general conventional metrics are used to measure the quality of an image. Structural metrics are used to find the dimensional changes in an image.
Conventional metrics values [39] of PSNR (Peak Signal to Noise Ratio), SNR (Signal to Noise Ratio), Mean Square Error (MSE), Correlation Quality (CQ), Normalized Cross Correlation (NC), Image Fidelity (IF), Normalized Mean Square Error (NM) and Correlation Coefficient (CC) are calculated and listed in Table 1 by using before cataract and after cataract surgery image and it also shown in graphically in Figure 7.
| Retina image | PSNR | SNR | MSE | CC | NC | IF | NMSE | CQ |
|---|---|---|---|---|---|---|---|---|
| C1 after | 17.3239 | 1.90E+20 | 3.75E+03 | 0.9914 | 5.91E+23 | -1.90E+20 | 3.19E-04 | 1.07E+19 |
| C2 after | 4.8834 | 7.16E+20 | 1.33E+04 | 0.9935 | 4.10E+23 | -7.16E+20 | 0.0011 | 7.23E+18 |
| C3 after | 25.7881 | 3.76E+19 | 2.52E+03 | 0.9952 | 5.78E+22 | -3.76E+19 | 7.26E-04 | 1.91E+18 |
| C4 after | 31.4851 | 4.37E+19 | 2.02E+03 | 0.9875 | 9.89E+22 | -4.37E+19 | 4.00E-04 | 2.69E+18 |
| C5 after | 14.0752 | 7.26E+19 | 4.62E+03 | 0.9973 | 6.81E+22 | -7.26E+19 | 0.0013 | 2.12E+15 |
| AVG quality | Poor | Poor | poor | Good | Poor | Poor | Poor | poor |
Table 1: Conventional metric values are calculated in between before and after cataract surgery images.

Figure 7: Conventional metric results with before cataract image.
Sometimes we won’t get the image of before cataract surgery, in this case bench mark image is used for evaluating conventional parameters and it is shown in Figure 8. Conventional metric values tested with bench mark and cataract surgery image is listed in Table 2 and it also shown in graphically in Figure 9.
| Retinal image | PSNR | SNR | MSE | CC | NC | IF | NMSE | CQ |
|---|---|---|---|---|---|---|---|---|
| C1after | 14.6481 | 1.4390e+20 | 4.4391e+03 | 0.9951 | 3.0543e+23 | -1.4390e+20 | 5.8817e-04 | 6.8604e+18 |
| C2after | 14.9512 | 1.4098e+20 | 4.3492e+03 | 1.0143 | 1.9574e+23 | -1.4098e+20 | 5.7624e-04 | 4.3492e+03 |
| C3after | 14.2563 | 1.4785e+20 | 4.5611e+03 | 1.0021 | 1.8638e+23 | -1.4785e+20 | 6.0433e-04 | 4.1863e+18 |
| C4after | 9.8884 | 2.1316e+20 | 6.5759e+03 | 1.0163 | 2.1183e+23 | -2.1316e+20 | 8.7128e-04 | 4.7579e+18 |
| C5after | 11.3897 | 1.8507e+20 | 5.7091e+03 | 0.9657 | 1.9541e+23 | -1.8507e+20 | 7.5643e-04 | 4.3891e+18 |
| AVG Quality | Poor | Poor | poor | Good | Poor | Poor | Poor | poor |
Table 2: Conventional metric values are calculated in between benchmark and after cataract surgery images.

Figure 8: Benchmark image.

Figure 9: Conventional metric results with benchmark image.
Satellite image quality is analysed by quality metric is described [40] .Stir mark value of an image quality is clearly explained in [41] based on this report, Conventional metrics table value shows the image quality is poor while the iris affected by the cataract disease.
Structural metrics [42] are MSSIM (Mean Structural similarity), SSIM (Structural similarity), FSIM (Feature similarity) and FSIMC (Feature similarity chrominance) are analysed by using before cataract images, bench mark and after cataract surgery image Evaluations results are listed among the three images are tabulated in Table 3 and Table 4 their corresponding graphical representation is shown in Figures 10 and 11.
| Retinal image | MSSIM | SSIM | FSIM | FSIMC |
|---|---|---|---|---|
| C1 after | 0.5602 | 0.5602 | 0.6722 | 0.6722 |
| C2 after | 0.5139 | 0.5139 | 0.6688 | 0.6688 |
| C3 after | 0.3436 | 0.3436 | 0.7103 | 0.7103 |
| C4 after | 0.6090 | 0.6090 | 0.8055 | 0.8055 |
| C5 after | 0.4767 | 0.4767 | 0.6602 | 0.6602 |
| Quality | Poor | Poor | Poor | Poor |
Table 3: Structural metric values are calculated in between before and after cataract surgery images.
| Retinal image | MSSIM | SSIM | FSIM | FSIMC |
|---|---|---|---|---|
| C1after | 0.5602 | 0.5602 | 0.4346 | 0.4346 |
| C2after | 0.5139 | 0.5139 | 0.4391 | 0.4391 |
| C3after | 0.3436 | 0.3436 | 0.3523 | 0.3523 |
| C4after | 0.4081 | 0.4081 | 0.7021 | 0.7021 |
| C5after | 0.4767 | 0.4767 | 0.6332 | 0.6332 |
| Quality | Poor | Poor | Poor | Poor |
Table 4: Structural metric values are calculated in between benchmark and after cataract surgery images.

Figure 10: Structural metric values with before cataract image.

Figure 11: Structural metric values with benchmark cataract image.
Texture changes can be occurred due to intra ocular methods during cataract surgery [16]. Due to dilation drops after cataract surgery non-elastic deformation seen in iris [25]. According to Tables 3 and 4 structural metric values are poor according with the stir mark [42] value because of cataract surgery.
Conclusion
This paper elaborated the system epitomizes changes in the iris due to cataract surgery and the consequences. Cataract can be identified under the flow of pre-processing, edge detection, feature extraction, template generation, classification and performance analysis. Templates can be compared to identify the changes in iris due to cataract. The original image is compared with the benchmark and database images. Cataract is diagnosed and classified by using SOM clustering technique. Three methods are used to analysis the performance of the technique such as study, decision tree, conventional and structural metric. From the analysis it has been perceived that structural changes have been identified in the iris. Therefore, re-enrolling can be desirable in the iris recognition system. Diagnosis is helpful for the professionals like police, customs control and clinicians to indulgence in advance and dodges blindness in the near future.
References
- Dua S, Rajendra A. Computational analysis of the human eye with applications.World Scientific 2011.
- Mohandass G, Ananda Natarajan R, Hari Krishnan G. Comparative analysis of optical coherence tomography retinal images using multidimensional and cluster methods. Biomed Res 2015; 26: 273-285.
- Omaima NAA, Shahlla A, Abdalkader AAT. Pattern recognition neural network for improving the performance of iris recognition system. Int J Sci Eng Res 2013; 4: 661-667.
- http://www.who.int/mediacentre/factsheets/fs282/en/.
- Henderson BA, Pineda R, Ament C, Chen SH, Kim JY. Essentials of cataract surgery. Thorofare NJ SLACK 2007.
- https://www.rpbusa.org.
- Wong TY, Loon SC, Saw SM. The epidemiology of age related eye diseases in Asia. Br J Ophthalmol 2006; 90: 506-511.
- https://www.ncbi.nlm.nih.gov/pmc/articles/PMC3920109/.
- Coleman AL, John C, Morrison E. Management of cataracts and glaucoma. CRC Press 2004.
- Chow YC, Gao X, Li H, Lim JH, Sun Y, Wong TY. Automatic detection of cortical and PSC cataracts using texture and intensity analysis on retro-illumination lens images. Proc Ann Int Conf IEEE Eng Med Biol Soc EMBS 2011; 5044-5047.
- Sugata Y, Murakami K, Ito M, Shiina T, Yamamoto Y. An application of ultrasonic tissue characterization to the diagnosis of cataract. Acta Ophthalmol Suppl (Oxf ) 1992; 204: 35-39.
- Li H, Lim JH, Liu J, Mitchell P, Tan AG. A computer-aided diagnosis system of nuclear cataract. IEEE Trans Biomed Eng 2010; 57: 1690-1698.
- Dhir L, Habib NE, Monro DM, Rakshit S. Effect of cataract surgery and pupil dilation on iris pattern recognition for personal authentication. Eye (Lond) 2010; 24: 1006-1010.
- Martinyi CL, Bahn CF, Meyer RF. Slit lamp: examination and photography. Sedona AZ Time One Ink (3rd edn.) 2007.
- West SK, Rosenthal F, Newland HS, Taylor HR. Use of photographic techniques to grade nuclear cataracts. Investig Ophthalmol Vis Sci 1988; 29: 73-77.
- Li H, Lim JH, Liu J, Wong TY, Tan A, Wang JJ. Image based grading of nuclear cataract by SVM regression. SPIE Med Imaging 2008; 6915: 691536-691536 Trokielewicz M, Czajka A, Maciejewicz P. Cataract influence on iris recognition performance. Proc SPIE Int Soc Opt Eng 2014; 9290: 1-14.
- Yuan XY, Hao Z, Shi PF. Iris recognition: a biometric method after refractive surgery. J ZHEJIANG Univ A 2007; 8: 1227-1231.
- Huang W, Chan KL, Li H, Lim JH, Liu J. A computer assisted method for nuclear cataract grading from slit-lamp images using ranking. IEEE Trans Med Imaging 2011; 30: 94-107.
- Bowyer KW, Hollingsworth K, Flynn PJ. Image understanding for iris biometrics: A survey. Comput Vis Image Underst 2008; 110: 281-307.
- http://www.nlm.nih.gov.
- Roizenblatt R, Schor P, Dante F, Roizenblatt J, Belfort R. Iris recognition as a biometric method after cataract surgery. Biomed Eng Online 2004; 3: 2.
- Lalys F, Riffaud L, Bouget D, Jannin P. A framework for the recognition of high-level surgical tasks from video images for cataract surgeries. IEEE Trans Biomed Eng 2012; 59: 966-976.
- Bahrami M, Hoshino M, Pierscionek B, Yagi N, Regini J. Refractive index degeneration in older lenses? A potential functional correlate to structural changes that underlie cataract formation. Exp Eye Res 2015; 140: 19-27.
- Thompson J, Lakhani N. Cataracts. Prim Care 2015; 42: 409-423.
- Borgen H, Bours P, Wolthusen SD. Simulating the influences of aging and ocular disease on biometric recognition performance. Lecture in Computer Science Artificial Intelligence Lecture Notes Bioinform 2009; 857-867.
- Saraiva J, Neatrour K, Waring Iv GO. Emerging technology in refractive cataract surgery. J Ophthalmol 2016; 2016: 7309283.
- Baskaran V, Guergachi A, Bali R, Naguib R. Predicting breast screening attendance using machine learning techniques. IEEE Trans Inf Technol Biomed 2011; 15: 251-259.
- Ali M, Clausi D. Using the canny edge detector for feature extraction and enhancement of remote sensing images. Geosci Remote Sens Symp 2001; 5: 2298-300.
- Tyukin I, Tyukina T, van Leeuwen C. Invariant template matching in systems with spatiotemporal coding: A matter of instability. Neural Networks 2009; 22: 425-449.
- Kanchanamani M, Perumal V. Performance evaluation and comparative analysis of various machine learning techniques for diagnosis of breast cancer. Biomed Res- India 2016; 27: 623-631.
- Franklin SW, Rajan SE. Retinal vessel segmentation employing ANN technique by Gabor and moment invariants-based features. Appl Soft Comput J 2014; 22: 94-100.
- Vishnuvarthanan G, Rajasekaran MP, Subbaraj P, Vishnuvarthanan A. An unsupervised learning method with a clustering approach for tumor identification and tissue segmentation in magnetic resonance brain images. J Appl Soft Computing 2016; 38: 190-212.
- Melody K. Extending the Kohonen self-organizing map networks for clustering analysis. Comput Stat Data Anal 2001; 38: 161-180.
- Sitao W, Tommy WS. Clustering of the self-organizing map using a clustering validity index based on inter-cluster and intra-cluster density. Pattern Recogn 2004; 37: 175-188.
- Madheswaran M, Dhas DAS. Classification of brain MRI images using support vector machine with various Kernels. Biomed Res 2015; 26: 505-513.
- Vîrgolici B, Popescu L. Risk factors in cataract. Oftalmologia 2006; 50: 3-9.
- Khan HA, Sobki SH, Alhomida AS. Regression analysis for testing association between fasting blood sugar and glycated hemoglobin in diabetic patients. Biomed Res 2015; 26: 604-606.
- Preethi DMD, Jayanthi VE. Ocular disease diagnosis based on LBP and gabor filter. Int J Sci Eng Res 2014; 5: 297-304.
- Rajkumar S, Malathi G. A comparative analysis on image quality assessment for real time satellite images. Indian J Sci Technol 2016; 9: 1-11.
- Taylor P, Jayanthi VE, Rajamani V, Karthikayen P. Performance analysis for geometrical attack on digital image watermarking. Iternational J Electron 2011; 98: 1565-1580.
- Kutter M, Petitcolas FP. A fair benchmark for image watermarking systems. SPIE 3657 Secur Watermarking Multimed Contents 1999; 3657: 25-27.