Review Article - Journal of Biomedical Imaging and Bioengineering (2017) Volume 1, Issue 1
Practicality and importance of selected endothelial dysfunction measurement techniques ? Review
Michael D Whitt*
Discipline of Pharmacology, School of Pharmacy, University of the Western Cape, Bellville 7535, South Africa
- *Corresponding Author:
- Michael D Whitt
Chief Technical Officer
California Polytechnic State University, USA
Accepted date: November 15, 2016
Citation: Michael D Whitt. Practicality and importance of selected endothelial dysfunction measurement techniques ? Review. J Biomed Imag Bioeng. 2017;1(1):1-7.
Abstract
The measurement of endothelial dysfunction (ED) has importance in that it indicates the presence of coronary artery disease in addition to acting as a predictor of future adverse events. Various tools, methods, and metrics exist that can provide an indicator of endothelial dysfunction. Given the significance of ED, it is of utmost importance to find a measurement technique that is reliable, while defining a metric providing a framework for an overall system that is practical, accurate, and repeatable. Success would provide a tool for early detection of cardiovascular disease not only moving patients that are currently classified as asymptomatic to symptomatic but also providing a method to monitor efficacy of treatments.
Keywords
Endothelial dysfunction, Diastolic pressure, Plethysmography, Thermo dilution
Background
ED is defined as a condition in which the inner lining of the artery, the intima, does not function normally [1-3]. It can be quantified via measurement of arterial vasodilation in response to drug administration or other physiological stimuli that would normally result in increased arterial flow as a response to endothelium derived nitric oxide in a healthy individual.
Stimuli involved in endothelial dysfunction measurement include drug administration, cold pressor testing, and reactive hyperemia while associated metrics include thermal changes, cardiac output measurements, pulse wave velocity, flow mediated dilation, and changes in arterial compliance. Genome analysis can also be used to detect endothelial dysfunction. Healthy endothelial function is associated with the measurement of increased arterial flow, increased arterial diameter, and increased arterial compliance following drug administration, reactive hyperemia, or cold pressor testing.
Associated technologies used to perform these measurements include; duplex ultrasonography, arterial tonometry, plethysmography, electromagnetic flowmeter, intravascular ultrasound (IVUS), liquid metal/mercury strain gage (LMSG), magnetic resonance imaging, and genetic analysis. Only the most prominent of these technologies will be explored in later sections.
Measurement and Stimuli
Drug administration
Various drug classifications exist that can have a significant effect on vasodilation and demonstrate improved endothelial function. Some of these include antihypertensive therapies (acetylcholine, adenosine 5’diphosphate, and thrombin) [4-7] angiotensin converting enzyme inhibitors [8-11], and Substance P [12]. It has even been observed that Vitamin C stimulates a significant improvement in flow mediated dilation (FMD) measured endothelial dysfunction improvements [13]. These drugs result in arterial vasodilation in subjects with a healthy endothelium that are able to exhibit normal endothelial function.
Cold pressor
The cold pressor test takes place when a subject submerges their hand into a container of ice water resulting in sympathetic nervous system activated vasodilation [14]. The measured effect can be seen in both coronary arteries as well as in contralateral hand immersion where brachial artery measurements are performed. Both coronary artery and brachial artery vasoconstriction have been observed in patients with cardiovascular disease following cold pressor stimulation [15-18]
Reactive hyperemia
Reactive hyperemia is defined as an increase in blood flow that takes place after a brief period of ischemia (e.g. arterial occlusion) [19]. Reactive hyperemia experiments have been shown to have the following results [20].
• Increased arterial compliance
• Increased arterial area
As a result of this increased arterial compliance and area, increased arterial flow also results.
The following factors can cause a reduction in smooth muscle activity and subsequent arterial vasodilation [21,22].
• Increased carbon dioxide levels
• Increased metabolic activity
• Increased flow velocity stimulating the release of endothelium derived relaxing factors (EDRF) (e.g. nitric oxide and prostacyclin).
Measurement – Technology Platforms
Duplex ultrasonography
Duplex ultrasonography is defined as ultrasonography that combines standard Bmode ultrasonography with pulsed Doppler signals. In summary, B mode ultrasonography is brightness modulated display ultrasonography with imaging capability. As a result, duplex ultrasonography has the capability to provide images of cardiovascular structures and conduits in addition to blood flow [23].
Ultrasound imaging provides the dimensions of organs, vessels, and tissues in a variety of medical applications. There are two fundamental relationships in ultrasonic imaging. The first is:
• d=0.5 tc
where d is the distance of an object from the transducer, t is the round trip transit time from the transducer to the object, and c is the speed of sound in the medium. The relationship provides the distance that an object is from the transducer as a function of the transmission signal transit time and speed [24].
The second relationship in the frequency domain expresses the received signal strength, S(f), as a function of transmitted signal strength, T(f), transducer properties, B(f), strength of scatter, n(f), and the attenuation of the signal path to and from the scatterers, A(f).
• S (f)=T (f) B (f) A (f) n (f)
A 2D image of the artery can be found from the ultrasound signal. The diameter of the brachial artery can be obtained from this image.
Intravascular Ultrasound (IVUS)
IVUS is Bmode ultrasonography that takes place via an ultrasound transducer placed at the tip of a catheter [25]. Although the general use of IVUS is in conjunction with an arterial angiography or stent placement to provide diagnostic information related to plaque distribution and composition, location of calcium, and lesion severity, it has been used to provide measurements of the metrics associated with endothelial dysfunction measurement.
One possible use is via placement of an IVUS catheter into the brachial artery such that intraarterial pressure, crosssectional area, and wall thickness were obtained [26]. As a result, the following brachial artery metrics were calculated:
Brachial artery crosssectional compliance (C):
C=[a/(π × c)]/[1/(P/c-b/c)2]
where P is transmural pressure, defined as mean arterial pressure minus external pressure applied by a cuff, and a, b, and c are parameters that characterize an arterial pressurearea curve via a model developed by Langewouters [27].
Additional cardiovascular metrics that can be obtained via IVUS include:
Incremental elastic modulus (Einc):
Einc=0.75 × (dsσ/dε)
The dσ/dε is determined from changes in:
Circumferential wall stress (σ):
σ=P x (rm/h)
where rm is midwall radius and h is wall thickness
Circumferential strain (ε)
ε=(rm/ro)
where ro is the effective unstressed midwall radius (midwall radius at 0 transmural pressure)
Pulse wave velocity (PWV) via the MoensKortoweg equation:
PWV=[(Einc x h)/(2d × ri)]1/2
where d is blood density (1.055 g/ml) and ri is the inner radius of the artery.
IVUS has the capability to provide important metrics associated with endothelial dysfunction measurement. However, IVUS is an invasive procedure and is only capable of providing information in the positive transmural pressure region of the artery [28]. Increased pulse wave velocity is an indicator of cardiovascular disease.
Transcutaneous brachial artery duplex ultrasonography
Ultrasound can also be used to obtain lumen measurements of peripheral arteries such as the brachial artery. Oftentimes, electrocardiogram recordings are simultaneously obtained and the images are consistently obtained at diastole and systole. The brachial artery is most often imaged at a location 37 cm above the antecubital crease and located via use of an ultrasound attenuator that can be taped to the subjects arm.
In addition to the subjective error that can take place as a result of edge detection, other sources of error could be introduced based on the quality of the blood vessel image definition. Image depth and gain settings must be properly adjusted by the ultrasonographer to best delineate the arterial wall [29].
In addition to providing brachial artery data measurements, this method has successfully provided measurements of aortic diameter and flow velocity via transducer placement at the suprasternal notch [30]. Both Doppler flow velocity and diameters at systole and diastole can be obtained via this method.
Magnetic resonance imaging and angiography
Magnetic resonance imaging (MRI) uses a magnetic field and radio wave energy pulse to provide images within the body. The images are generated using the concepts of nuclear magnetic resonance (NMR) physics where the ultimate image is derived from a signal generated via precession of protons [31].
Magnetic resonance angiography (MRA) provides arterial images in addition to blood flow information. In some cases, a contrast medium is used to improve the arterial image. MRA successfully provides images of both coronary and peripheral arteries [32,33] In each setup, the magnetic resonance system is used in conjunction with cardiac software, Food and Drug Administration (FDA) approved MRA sequence and receiver coil such as a cardiac synergy receiver coil or a standard flexible extremity coil. These images provide arterial compliance and flow measurements in addition to pulse wave velocity (PWV) and flow mediated dilation (FMD) of the imaged artery [34].
X‐ray angiography
Xray angiography provides arterial images via intraarterial injection of a radiopaque dye [35]. Dimensional information including the metric intimamedia thickness and FMD are obtained via this methodology.
Digital imaging technologies replacement of film recording has optimized the use of angiography. Images of the brachial artery can be successfully obtained via intravenous digital angiography where a catheter is inserted into the right antecubital basilic vein and passed into the right atrium [36].
Arterial tonometry
The arterial tonometer is a pressure pulse sensor that must be properly positioned over an artery (most often the radial artery) located near the skin surface. The sensor must not only be properly centered over the artery but also have the proper pressure applied to the artery. Comparisons to intraarterial pressure measurements have shown average errors of -5.6 mmHg for systolic pressure and -2.4 mmHg for diastolic pressure [37]. Accurate placement of the sensor makes arterial tonometry very operator dependent in obtaining a high resolution pressure pulse. However, a flexible diaphraghm tonometer can be used where proper positioning is easier and a lower resolution pressure pulse is obtained [38].
Studies have been performed that support the use of peripheral arterial tonometry (PAT) as a predictor of future cardiac events with mixed results [39-41] Although there is a strong significant positive correlation between PAT and ultrasound arterial diameter and flow data while the subject is in a baseline condition, no correlation was observed between PAT data and ultrasound measured flow mediated dilation values when the subject underwent reactive hyperemia [42].
Measurement – Thermal Platforms
Thermodilution
The classical thermodilution methodology is an invasive method where cardiac output is measured. In summary, an indicator (which is usually cold saline) is injected into the right atrium and temperature in the pulmonary artery is recorded. The relationship between temperature change and cardiac output (CO) is: [43].
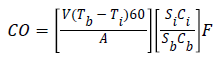
where
• V=volume of indicator injected in ml
• Tb=temperature average of pulmonary artery blood in degrees Celsius
• Ti=temperature of the indicator
• 60=multiplier required to convert ml/s to ml/min
• A=area under the dilution curve in seconds x degrees Celsius
• S=specific gravity of indicator (i) and blood (b)
• C=specific heat of indicator (i) and blood (b)
• F=empiric correction factor for heat transfer through injection catheter
Although thermodilution is a classical method for cardiac output measurement, errors can be introduced into the measurement as a result of heat loss through the catheter wall, respiration, choice of heat transfer medium, and other environmental factors.
Digital thermal monitoring
Digital thermal monitoring uses two fingertip RTD (resistance temperature detector) probes placed on the index finger of both hands [44]. In two minute hyperemia experiments, it was observed that metrics defined as temperature rebound (TR) and area under the curve (TMP AUC) correlated closely to Doppler ultrasound measured flow velocity. The metrics are defined as:
TR=TMPmax TMPi
where
TMPmax is the maximum temperature observed at the RTD following the two minute reactive hyperemia occlusion
TMPi is the initial temperature observed at the RTD prior to the two minute hyperemia occlusion
TMP AUC is defined as the area under the curve post occlusion where the yaxis is temperature and the xaxis is time.
However, the metrics must be adjusted to account for environment and patient factors including; room temperature, wind/air speed, patient finger size, estimated finger thermal properties, and estimated arteriovenous temperature drop. A lumped capacity energy balance modeling estimated conduction, convection, and evaporative losses of a finger are a part of the solution [45].
Measurement – Volumetric Platforms
Plethysmography
Plethysmography is defined as a technique that measures the volume changes in an organ, limb, or the body through the measurement of blood flow [46] Within the classification of plethysmography, various modalities exist including ocular plethysmography which is a noninvasive method for measuring blood flow via the ophthalmic artery to the brain. This measurement takes place via placement of suction cups on the eyes that measure ocular pressure. However, in this section only those modalities that are deemed to provide a practical method for endothelial dysfunction measurement and presence of cardiovascular disease will be discussed.
Arterial plethysmography is a manometric test used to determine if an occlusion exists in either the upper or lower extremities. If measured systolic blood pressure differs by more than 20 mmHg, between the upper and lower extremities, an arterial blockage is deemed present [47].
A photoplethysmograph requires two items, a light source and a photodetector, and records blood volume changes through physiological tissues and vessels noninvasively at the skin surface [48]. The physiological area of measurement is determined by the optical probe design light intensity and operating wavelength [49]. As the light source illuminates the tissue, the photodetector records the changes in light intensity that correlate with volume changes in the area of measurement [50].
Two photoplethysmograph frameworks exist; the transmission (‘transillumination’) method where the light source and photodetector are on opposite sides of the sample and reflection (‘adjacent’) mode where the light source and photodetector are on the same side of the sample. The primary sources of error in photoplethysmography are movement as the probetissue interface and ambient light in addition to concerns with reproducibility caused by these factors in addition to subject posture, respiration, and degree of calmness [51-53]. Although the signals obtained have a direct correlation with blood volume changes, the signals have not been successfully calibrated to provide actual volume magnitudes [54].
Some of the clinical metrics obtained via photoplethysmography include: arterial oxygen saturation and heart rate via pulse oximetry [55] in addition to blood pressure. Although there are some issues with accuracy at low arterial saturation levels [56] as well as unreliability issues in obtaining ankle brachial pulse indices to assess peripheral vascular disease using photoplethysmography [57-59] However, there have been algorithms where frequency analysis and pulse frequency characterization have detected a high degree of patients with peripheral stenosis and occlusions [60-64].
The segmental plethysmograph is a technique through which oscillometric volume pulses are obtained. Limb volumetric changes are directly correlated to pressure or diaphragm displacement via the mathematical relationship; [65] Ad=kdV; where A is the diaphraghm crosssectional area, d is the diaphraghm displacement, k is the constant that changes as a function of system volume, and dV equals limb volumetric displacement.
Limb volumetric displacement can be accurately and noninvasively obtained if k can be solved for at all system conditions. This concept provides a fundamental through which arterial compliance and thus degree of endothelial dysfunction can be noninvasively and accurately determined.
Measurement – Genetic Platform
Genome analysis
Genome analysis may provide a method for detection of endothelial function in the future. Genetic polymorphisms can be used to identify the presence of coronary endothelial dysfunction [66,67]. Polymerase chain reaction (PCR) is a technique that can be used to identify the DNA sequences via the PCR DNA sequence amplification process. In summary, the target DNA is denatured at a high temperature, cooled to permit annealing of primers to their sites, and temperature is readjusted to permit synthesis [68]. Analysis could be performed via a standard PCR unit which is a large device. The more portable Open PCR units are still evolving in the marketplace and only a few companies manufacture these devices.
Endothelial dysfunction metrics
The following metrics can be used to identify endothelial dysfunction:
Flow mediated dilation (FMD) following hyperemia. Defined as increased arterial blood flow, arterial compliance, and arterial area following reactive hyperemia or cold pressor testing.
Ultrasound is the tool most often associated with these measurements. However, plethysmography is also used in some cases.
Pulse wave velocity (PWV) calculated via the MoensKortoweg equation: [69,70]
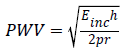
where Einc is incremental elastic modulus, h is arterial wall thickness, r is arterial radius, and ρ is blood density.
Following reactive hyperemia or cold pressor testing, PWV has a measureable decrease for patients without endothelial dysfunction. Ultrasound is most commonly used to provide this measurement.
Conclusion
The measurement of endothelial dysfunction (ED) has clinical importance in that ED is an independent predictor of future cardiovascular adverse events. Many of the tools discussed have application issues that include practicality of use, accuracy, degree of invasiveness, etc. However, a tool based on the fundamentals of segmental plethysmography would provide a tool that would not only be noninvasive but accurate. Such a tool would have the greatest potential to have an impact on cardiovascular disease via early detection and a practical method for monitoring efficacy of treatments.
References
- Kuvin JT, Patel AR, Sliney KA, Pandian NG, Rand WM, Udelson JE, Karas RH. Peripheral Vascular Endothelial Function Testing as a Noninvasive Indicator of Coronary Artery Disease. J Am Coll Cardiol 2001; 38: 1843-1849.
- Halcox JP, Schenke WH, Zalos G, Mincemoyer R, Prasad A, Waclawiw MA, Nour KR, Quyyumi AA. Prognostic value of coronary vascular endothelial dysfunction. Circulation 2002; 106: 653-658.
- Cooke J. Endothelial function and peripheral vascular disease, In Spittell J (ed): Contemporary Issues in Peripheral Vascular Disease. Philadelphia, FA Davis 1992; pp: 1-17.
- Furchgott RF, Zawadzki JV. The obligatory role of endothelial cells in the relaxation of arterial smooth muscle by acetylcholine. Nature 1980; 288: 373-376.
- Lüscher TF, Cooke JP, Houston DS, Neves RJ, Vanhoutte PM. Endothelium-dependent relaxations in human arteries. Mayo Clin Proc 1987; 62: 601-606.
- Tschudi MR, Criscione L, Novosel D, Pfeiffer K, Lüscher TF. Antihypertensive therapy augments endothelium-dependent relaxations in coronary arteries of spontaneously hypertensive rats. Circulation 1994; 89: 2212-2218.
- Lüscher TF, Vanhoutte PM, Raij L. Antihypertensive treatment normalizes decreased endothelium-dependent relaxations in rats with salt-induced hypertension. Hypertension 1987; 9: 193-197.
- Palmer RM, Ferrige AG, Moncada S. Nitric Oxide release accounts for the biological activity of endothelium-derived relaxing factor. Nature 1987; 327: 524-526.
- Takase H, Moreau P, Küng CF, Nava E, Lüscher TF. Antihypertensive therapy prevents endothelial dysfunction in chronic nitric oxide deficiency. Effect of verapamil and trandolapril. Hypertension 1996; 27: 25-31.
- Clozel M, Kuhn H, Hefti F. Effects of angiotensin converting enzyme inhibitors and of hydralazine on endothelial function in hypertensive rats. Hypertension 1990; 16: 532-540.
- D’Uscio L Shaw S, Barton M, Lüscher TF. Losartan by not Verapamil Inhibits Angiotensin II – Induced Tissue Endothelin-1 Increase:Role of Blood Pressure and Endothelial Function. Hypertension 1998; 31: 1305-1310.
- Cocks TM, Angus JA. Endothelium-dependent relaxation of coronary arteries by noradrenaline and serotonin. Nature 1983; 305: 627-630.
- Hornig B, Arakawa N, Kohler C, Drexler H. Vitamin C improves endothelial function of conduit arteries in patients with chronic heart failure. Circulation 1998; 97: 363-368.
- Lafleche AB, Pannier BM, Laloux B, Safar ME. Arterial response during cold pressor test in borderline hypertension. Am J Physiol 1998; 275: H409-415.
- Corretti MC, Plotnick GD, Vogel RA. Correlation of cold pressor and flow-mediated brachial artery diameter responses with the presence of coronary artery disease. Am J Cardiol 1995; 75: 783-787.
- Nabel EG, Ganz P, Gordon JB, Alexander RW, Selwyn AP. Dilation of normal and constriction of atherosclerotic coronary arteries caused by the cold pressor test. Circulation 1988; 77: 43-52.
- Zeiher AM, Drexler H, Wollschläger H, Just H. Modulation of coronary vasomotor tone in humans. Progressive endothelial dysfunction with different early stages of coronary atherosclerosis. Circulation 1991; 83: 391-401.
- Nitenberg A, Chemla D, Antony I. Epicardial coronary artery constriction to cold pressor test is predictive of cardiovascular events in hypertensive patients with angiographically normal coronary arterie and without other major coronary risk factor. Artherosclerosis 2004; 173: 115-123.
- Klabunde RE. Cardiovascular Physiology Concepts. Lippincott, Williams and Wilkins 2012.
- Whitt M. Noninvasive Determination of Peripheral Arterial Lumen Area, Rutgers University/University of Medicine and Dentistry of New Jersey 1999.
- Rockson SG Cooke JP. Peripheral arterial insufficiency mechanisms, natural history, and therapeutic options. Advances in Internal Medicine 1998; 42:253-277.
- Ganong WF. Review of Medical Physiology 15th edition, Appleton and Lange: Norwalk 1992.
- Segen JC. Concise dictionary of modern medicine, McGraw-Hill: New York 2002.
- Mottley JG. Ultrasonic imaging. In Bronzino JD (editor in chief), The Biomedical Engineering Handbook. CRC Press 1995; Pp.1093-1098.
- Nishimura RA, Edwards WD, Warnes CA, Reeder GS, Holmes DR, Tajik AJ, Yock PG. Intravascular ultrasound imaging: in vitro validation and pathologic correlation. J Am Coll Cardiol 1990; 16: 145-154.
- Bank AJ, Wilson RF, Kubo SH, Holte JE, Dresing TJ, Wang H. Direct effects of smooth muscle relaxation and contraction on in vivo human brachial artery elastic properties. Circulation Research 1995; 77: 1008-1016.
- Langewouters GJ, Wesseling KH, Goedhard WJ. The static elastic properties of 45 human thoracic and 20 abdominal aortas in vitro and the parameters of a new model. J Biomech 1984; 17: 425-435.
- Bank AJ, Wang H, Holte JE, Mullen K, Shammas R, Kubo SH. Contribution of collagen, elastin, and smooth muscle to in vivo human brachial artery wall stress and elastic modulus. Circulation 1996; 94: 3263-3270.
- Sussenbacher A, Dörler J, Wunder J, Hohenwarter F, Alber HF, Pachinger O, Frick M. Comparison of Brachial Artery Wall Thickness Versus Endothelial Function to Predict Late Cardiovascular Events in Patients Undergoing Elective Coronary Angiography, Am J Cardio 2013; 111: 671- 675.
- Mackay RS. Non-invasive cardiac output measurement. Microvasc Res 1972; 4: 438-452.
- Connolly S. In Bronzino JD (editor in chief), The Biomedical Engineering Handbook. CRC Press 1995; Pp.1093-1098.
- Klocke FJ. Epicardial coronary artery vasomotion. J Am Coll Cardiol 2010; 56: 1666-1667.
- Greil GF, Stuber M, Botnar RM, Kissinger KV, Geva T, Newburger JW, Manning WJ, Powell AJ. Coronary Magnetic Resonance Angiography in Adolescents and Young Adults in Kawasaki Disease. Circulation 2002, 105: 908-911.
- Wiesmann F, Petersen SE, Leeson PM, Francis JM, Robson MD, Wang Q, Choudhury R, Channon KM, Neubauer S. Global impairment of brachial, carotid, and aortic vascular function in young smokers: direct quantification by high-resolution magnetic resonance imaging. J Am Coll Cardiol 2004; 44: 2056-2064.
- Shroy RE. X-Ray, In Bronzino JD (editor in chief), The Biomedical Engineering Handbook. CRC Press 1995; Pp.1093- 1098.
- Hofammann KE, Moneim MS, Omer GE, Ball WS. Brachial Artery Disruption Following Closed Posterior Elbow Dislocation in a Child – Assessment with Intravenous Digital Angiography. Clinical Orthopaedics and Related Research 1984; 184:145-149.
- Drzewiecki G. Noninvasive assessment of arterial blood pressure and mechanics. In Bronzino JD (editor in chief), The Biomedical Engineering Handbook. CRC Press 1995; Pp.1093-1098.
- Bansal V. Design of a flexible diphraghm tonometer. Thirteenth S Biomed Eng Conf 1994; p148-151.
- Matsue Y. Endothelial dysfunction measured by peripheral arterial tonometry predicts prognosis in patients with heart failure with preserved ejection fraction. Int J Cardiol 2012; 59: E1014.
- Ruggiero D. Endothelial dysfunction in type 2 diabetic patients with normal coronary arteries: A peripheral arterial tonometry study. Monaldi Arch Chest Dis 2012; 78: 34-39.
- Espinoza F, Kunstmann S, Urzúa A, Michea L, Marusic ET, Vukusich A. Assessment of arterial damage by noninvasive peripheral arterial tonometry in non- diabetic hemodialysis patients, Rev Med Chil 2012; 140: 153-160.
- Lee Bass A, Ellis K, Tran B, Steele S, Caughey M, Stouffer GA, Hinderliter AL. Relation between digital peripheral arterial tonometry and brachial artery ultrasound measures of vascular function in patients with coronary artery disease and in healthy volunteers. Am J Cardiol 2012; 109: 651-657.
- Geddes L. Cardiac Output Measurement, In Bronzino JD (editor in chief), The Biomedical Engineering Handbook. CRC Press 1995; pp: 1093-1098.
- Ahmadi N, McQuilkin GL, Akhtar MW, Hajsadeghi F, Kleis SJ, Hecht H, Naghavi M, Budoff M. Reproducibility and variability of digital thermal monitoring of vascular reactivity. Clin Physiol Funct Imaging 2011; 31: 422-428.
- Ahmadi N, Nabavi V, Nuguri V, Hajsadeghi F, Flores F, Akhtar M, Kleis S, Hecht H, Naghavi M, Budoff M. Low fingertip temperature rebound measured by digital thermal monitoring strongly correlates with the presence and extent of coronary artery disease diagnosed by 64-slice multi-detector computed tomography, Int J Cardiovasc Imaging 2009; 25:725-738.
- Ganong WF. Review of Medical Physiology (15th edition), Appleton and Lange: Norwalk, CT 1991.
- Merriam-Webster’s Medical Desk Dictionary. Merriam-Webster, Inc.:Springfield, MA 1993.
- Allen J. Photoplethysmography and its application in clinical physiological measurement. Physiol Meas 2007; 28: R1-39.
- Murray A, Marjanovic D. Optical assessment of recovery of tissue blood supply after removal of externally applied pressure. Med Biol Eng Comput 1997; 35: 425-427.
- Challoner AVJ. Photoelectric plethysmography for estimating blood flow, In Rolfe P (ed), Non-Invasive Physiological Measurements. London: Academic 1979; 1: 125-151.
- Webster JG. Design of Pulse Oximeters, Bristol: Institute of Physics Building 1997.
- Hanowell L, Eisele JH, Downs D. Ambient light affects pulse oximeters. Anesthesiology 1987; 67: 864-865.
- Teng XF, Zhang YT. The effect of applied sensor contact force on pulse transit time. Physiol Meas 2006; 27: 675-684.
- Hertzmann AB. The blood supply of various skin areas as estimated by the photoelectric plethysmograph. Am J. Physiol 1938; 124: 328-340.
- Aoyagi T, Miyasaka K. Pulse oximetry: its invention, contribution to medicine, and future tasks. Anesth Analg 2002; 94: S1-3.
- Kyriacou PA. Pulse oximetry in the oesophagus. Physiol Meas 2006; 27: R1-35.
- Jönsson B, Laurent C, Skau T, Lindberg LG. A new probe for ankle systolic pressure measurement using photoplethysmography (PPG). Ann Biomed Eng 2005; 33: 232-239.
- Goldman JM, Petterson MT, Kopotic RJ, Barker SJ. Masimo signal extraction pulse oximetry. J Clin Monit Comput 2000; 16: 475-483.
- Hayes MJ, Smith PR. A new method for pulse oximetry possessing inherent insensitivity to artifact. IEEE Trans Biomed Eng 2001; 48: 452-461.
- Oliva I, Ipser J, Roztoc AK, Guttenbergerová K. Fourier analysis of the pulse wave in obliterating arteriosclerosis. Vasa 1976; 5: 95-100.
- Sherebrin MH, Sherebrin RZ. Frequency analysis of the peripheral pulse wave detected in the finger with a photoplethysmograph. IEEE Trans Biomed Eng 1990; 37: 313-317.
- Grohmann G. NIR-photoplethysmography- a noninvasive method for the early diagnosis and control of circulation parameters in peripheral vascular diseases. 1. Theory and Technical Devices, Perfusion 1996; 9:268-277.
- Grohmann G. NIR-photoplethysmography- a noninvasive method for the early diagnosis and control of circulation parameters in peripheral vascular diseases. 2. Bedside measurements, Perfusion 1996; 9:300-310.
- Oliva I, RoztoAK. Toe pulse wave analysis in obliterating atherosclerosis. Angiology 1983; 34: 610-619.
- Winsor T. The segmental plethysmograph; a description of the instrument. Angiology 1957; 8: 87-101.
- Deanfield J, Donald A, Ferri C, Giannattasio C, Halcox J, Halligan S, Lerman A, Mancia G, Oliver JJ, Pessina AC, Rizzoni D, Rossi GP, Salvetti A, Schiffrin EL, Taddei S, Webb DJ. Endothelial function and dysfunction. Part I: Methodological issues for assessment in the different vascular beds: a statement by the Working Group on Endothelin and Endothelial Factors of the European Society of Hypertension. J Hypertens 2005; 23: 7-17.
- Hermann M, Hellermann JP, Quitzau K, Hoffmann MM, Gasser T, Meinertz T, Münzel T, Fleming I, Lüscher TF. CYP4A11 polymorphism correlates with coronary endothelial dysfunction in patients with coronary artery disease – the ENCORE Trials. Artherosclerosis 2009; 207:476-479.
- Kaiser R. Tools for Genome Analysis, In Bronzino JD (editor in chief), The Biomedical Engineering Handbook. CRC Press 1995; pp: 1093-1098.
- Nichols W, O'Rourke M, Vlachopoulos C. McDonald’s Blood Flow in Arteries: theoretical, experimental, and clinical properties (3rd ed) Philadelphia: Lea and Febiger 1990.
- Rubinshtein R, Kuvin JT, Soffler M, Lennon RJ, Lavi S, Nelson RE, Pumper GM, Lerman LO, Lerman A. Assessment of endothelial function by non-invasive peripheral arterial tonometry predicts late cardiovascular adverse events. Eur Heart J 2010; 31:1142-1148.