Research Article - Biomedical Research (2016) Computational Life Sciences and Smarter Technological Advancement
MRI brain image analysis for tumour diagnosis using hybrid MB-MLM pattern classification technique
Shenbagarajan A1*, Ramalingam V1, Balasubramanian C2 and Palanivel S11Department of Computer Science and Engineering, Annamalai University, Chidambaram, India
2Department of Computer Science and Engineering PSR Rengasamy College of Engineering for Women, Sivakasi, India
- *Corresponding Author:
- Shenbagarajan A
Department of Computer Science and Engineering, Annamalai University, India
Accepted on August 31, 2016
Abstract
Brain tumours are rooted by atypical and abandoned enlargement of brain cells, which are the subsequent source of death associated to cancer in less than 30 years age of people in recent years. Early stage diagnosing of these brain tumours will reduce the unconditional deaths of young people. For that the most suggested one of the finest expertises is Magnetic Resonance Imaging (MRI). In this work, proposed a brain MRI image based medical image analysis process, which consists of Modified Bat Algorithm with Modified Levenberg Marquardt (MB-MLM) classification with Active Contour Method (ACM) segmentation method to identify or classify tumor or non-tumor at earlier stage. For optimal results, this work also proposes the methods like advanced median filter pre-processing method for enhance the input image, parallelized clustering method for surface feature extraction and Intensity in Homogeneity (IIH) for high segmentation accuracy, hybrid wavelet and Sobel and Canny feature extraction method and Fast Independent Component Analysis (Fast ICA) feature selection method for dimensionality reduction, these proposed methods are increase the efficiency of the proposed MRI brain image based tumor diagnosis process. The performance of this proposed work is measured by standard parameters such as sensitivity, specificity and accuracy.
Keywords
Brain tumours, Magnetic resonance imaging (MRI), Modified levenberg marquardt (MB-MLM), Active contour method (ACM), Hybrid wavelet and sobel and canny feature extraction, Fast independent component analysis (Fast ICA).
Introduction
Recent years medical imaging is extensively utilized for examination and analysis of image based applications. The improvement on the medical imaging systems at reduced cost can solve many current problems in medical field such as image-guided surgery, therapy evaluation and diagnostic tools [1]. Thus, Magnetic Resonance Imaging (MRI) has been widely used due to its excellent spatial resolution, tissue contrast and non-invasive character [2,3]. Typically MRI supported imaging equipment utilized in brain images grounded by diagnosis procedure, since it is distinguished that the brain has a problematical structure; thus, truthful examination of brain is highly significant for identifying tumors founded on MRI method, in sort to offer appropriate treatment [4]. A method to categorize tissues into these grouping is an essential stride in quantitative morphology of brain since the largest part of brain organizations is distinct by restrictions of these tissue modules [5]. Contrasting additional diagnostic processes, MRI schemes generate recurrent images, where varied essential factors of interior anatomical organization in the identical body segment are tinted by every image with numerous contrasts. In the largest part of the MRI supported medical imaging investigations, primarily spotlights on pre-processing method. The main popular pre-processing approach is noise correcting or suppression for nonuniformities. There are numerous algorithms anticipated for this duty that adjacent to their profits, they may have offputting effects on auxiliary processing phase [6]. Previous to several examinations on an exact objective in the image, it is essential to section or categorize that from further divisions in the image.
In general segmentation in medical images is dividing the pixels to distinguish and divide the intended area generally a tissue or an injury from the surroundings and strong tissues. In some study meadows, segmentation of a definite tumor or tissue is the major principle. In other words, segmentation is an intermediary stage for auxiliary investigation such as categorization or added measurements. In case of brain tumors, it is a tricky task concerning to the distinctiveness of the tumour in the MRI brain descriptions [7]. Image segmentation procedures make use of region, edge, or intensity possessions of the goal tissue in the image to divide them from the surroundings [8]. The plan of edge-based segmentation techniques is to discover the margins of two neighbouring regions that have dissimilar individuality. The most admired algorithms for recognition of tumour edges in MRI descriptions is utilizing level-sets [9] and/or coalesce it with categorization or grouping techniques [10]. One more gradually more significant process in the medical field is categorization of MRI brain images because it is vital for surgical preparation and intrusion. Physical categorization of Magnetic Resonance (MR) brain tumor descriptions is a demanding and sustained job [11]. In a large amount of surroundings the assignment is completed by blotting the tumor area slice-by-slice, which restrictions the human observer’s sight and produces jaggy images. Physical categorization is also characteristically prepared with intensity improvement offered by an inserted distinction agent [12]. In case, categorization based on the human spectator is extremely prone to fault. As a product, the categorization outcomes are extremely substandard which directs to severe results. Thus, a routine or automatic medical image investigation using categorization with segmentation technique is extremely attractive as it diminishes the consignment on the human viewers and acquiesces better outcomes. In the recent times, several classification techniques have been evolved for brain MRI image analysis for the cause of tumor diagnosis. However these methods don’t consider noise removal and Intensity level of the pixels is not focused by recent works. Here this proposed work describes the most efficient techniques along with classification process for tumor diagnosis obtained from the brain MRI images. Removal of noises from the image is an early stage in the image processing, which improves the images for further proceedings, since noises in images results in the errors such as blurring effects.
In this proposed work uses following processes for MRI brain image based tumor diagnosis, such as pre-processing techniques Advanced Median Filter (AMF), parallelized clustering method and Intensity in Homogeneity (IIH) for enhancing the given MRI images for further process in image analysis. Then feature extraction methods such hybrid wavelet transform and Sobel and Canny methods is proposed for extracting texture features. After features extraction, in order to reduce the dimensionality problem in this work uses the Fast Independent Component Analysis (Fast ICA) feature selection approach for best features selection. These two approaches are mainly significant and impartibly component of MB-MLM classification task performed with region based ACM segmentation for diagnosing process.
Related Work
Xuan et al. proposed tumor segmentation method based on statistical structure investigations [13]. At first, symmetrybased, intensity-based, and texture-based features are hauled out from structural rudiments. After that Ada boost categorization method using that study by choosing the majority of distinguished features is anticipated to categorize the structural components into usual tissues and irregular tissues. This proposed method’s experimental results on more than 100 tumor-contained brain MR descriptions attain an average accurateness of 96.82% on tumor division.
Shah et al. offered computationally intellectual methods to categorize brain MRI images into usual and irregular (having tumor) ones [14]. Initially Gabor filters technique used to haul out the consistency features from MRI brain images and then executes categorization among usual and unusual images with the use of Support Vector Machine (SVM). Subsequently new histogram contrast technique is utilized in right and left halves of brain grounded on Bhattacharya coefficient and this technique discovers bouncing box as Region of Interest (ROI). Then texture characters are hauled out with Gabor filters from the ROI. Lastly, the categorization of images was done using artificial neural networks. A contrast of both the anticipated ways is given at closing stages.
Gopal et al. designed an intellectual method to identify brain tumor in the course of MRI using image dispensation, fuzzy-c means grouping algorithms along with intellectual optimization apparatus, similar to Genetic Algorithm (GA), and Particle Swarm Optimization (PSO) [15]. The tumor detection process is performed in two stages such as pre-processing and the second stage consists of segmentation and classification in processes. Wu et al. proposed the k-means grouping method grounded on color segmentation technique that is utilized to trail tumor substances in Magnetic Resonance (MR) brain images [16]. This color-based segmentation procedure with kmeans is the key idea, in which it renovate into a provided gray-level MR image to a color space image and then divide the spot of tumor substances from additional items of an MR image with the use of k-means grouping and histogramgrouping. The outcomes of this anticipated technique reveals that these techniques can effectively attain segmentation for MR brain images to assist pathologists differentiate precisely region and lesion size.
Kharrat et al. introduced a well-organized revealing of brain tumor from cerebral MRI descriptions [17]. In this proposed method comprises of following vital three steps such as segmentation, enhancement, and classification. In order to improve the image quality and risk limitation of different sections combination in the partitioning stage an improvement procedure is functional. In this proposed work adopts numerical morphology to amplify the dissimilarity in MRI images. Then wavelet transform is applied in the division procedure to decay MRI images. Finally the k-means algorithm is employed to haul out the distrustful tumors or regions. The proposed method’s performance results showed the feasibility of brain image process.
Proposed Methodology
In MRI brain medical image investigation research methods usually comprises of numerous parts, which use diverse processes in a sequence. In this proposed work at first, advanced median filter pre-processing method is used to prepare the image for optimal results. Then these medical image examination study methods consist of following process such as feature extraction, segmentation, feature selection and classification. Region based Active Contour Method (ACM) segmentation method is proposed to segmenting the MRI brain image grounded on visual demonstrations, which are associated to the grey-levels. In features are arithmetic information and measurements of the image that can be hauled out from a preferred division of the image. The Figure 1 shows the block diagram of the proposed methodology.

Figure 1. Flow of the proposed methodology.
In this work most significant shape and texture features are hauled out from the MRI image using hybrid wavelet method and Sobel and Canny method. Finally the classification process is used to categorization of the input MRI brain image grounded on their characteristics which is an essential phase for evaluating the tumors. For classification MB-MLMM method is proposed. The final evaluation results show the efficacy of proposed methods for tumour diagnosis process in medical image analysis.
Pre-processing step for MRI brain image process
The proposed MRI brain image processing method using preprocessing step, which plays a vital role in enhancing the input MRI brain images, which is also a crucial and essential step that tunes the MRI image for further processes such as segmentation, feature extraction, feature selection and classification.
Advanced median filter for noise removal
A novel denoising algorithm namely known as advanced median filter is presented in this work to remove noises from the input MRI images. The proposed advanced median filtering method is customized description of hybrid median filtering technique, which is discussed in detail as follows.
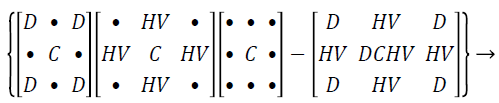
Hybrid median filter: Assume the input representation as pixels in figure of 3 × 3 matrix, the 45˚ neighbours median values shapes an ‘x’ and the neighbours of the representation pixels forming a ‘+’ are evaluated with the median value and the central pixel of that set is then kept as the novel pixel standards. The three pace position process does not inflict a solemn computational consequence as in the case of median strain. Each of the position process is greatly smaller number of standards than utilized in a square region of the similar size. In the hybrid technique, each one of the two clusters holds only 5 pixels, and the concluding assessment engrosses only three standards. Even with the supplementary manipulation and logic of values, the hybrid median filter technique is quicker than the conservative median. This median strain results the propensity of median and shortened median filters to rub out lines which are slender than the half width of the neighbour and to encircling corners.
Hybrid median filter preserves edges better than other median filter since it processes a three-step ranking operation, in which information from diverse spatial instructions are categorized independently. There are three median values computed by using hybrid median filtering method such as HV signifies the median of horizontal h, vertical v pixels, D represents the median of oblique d pixels, the strained value is the median of the two median standards, the central pixel C, median of the vertical and horizontal, diagonal and central is represents as HV, D, C.
 (1)
(1)
Proposed advanced median filter: It is also known as windowed filter. Advanced median filter has better edge preserving characteristics compare than the other median filter versions. In this proposed pre-processing technique, advanced median filters are used to remove impulse noises while preserving edges of the MRI brain images. The fundamental suggestion at the rear filter is for neighbourhood pixels of the MRI image apply median technique numerous periods, unstable window shape and then obtain the median to attain median values. This anticipated filter is the customized description of the hybrid median filter explicated above. It functions on the sub windows comparable to hybrid median filter. The maximum value of the neighbouring pixels forming an and the median value of the neighbours forming a are compared with the central pixel and the median value of that set is then saved as the new pixel value.
Algorithm for advanced median filter
Step 1. Find the median HV of the horizontal and vertical pixels marked as HV and the central pixel C in the 3 × 3 matrix
Step 2. Find the maximum Dmax of the diagonal pixels marked as D and the central pixel C in the 3 × 3 matrix
Step 3. Finally compute new median value Mnew
Mnew=median (HV, Dmax, C)
Step 4. Filter median out value Ii, i =Mnew; here are indices of the spatial locations.
From the process of advanced median filter obtained a noise free pixel, these are used in the further MRI brain image process.
Image surface extraction
Here this work present parallel methods for surface feature extraction represented in the MRI brain image. The proposed clustering based methods are more memory-efficient and fast processing algorithm, iterative simplification puts more emphasis on high surface quality. The proposed method for image surface feature extraction is discussed in detail as follows:
Parallelized method for surface feature extraction in MRI brain image: In this proposed work used parallelized feature extraction and clustering method. The first phase of the parallelized method is feature extraction method, which is using Hidden Markov model (HMM), which is described as follows,
Hidden markov model (HMM): The method for surface feature extraction using HMMs can be summarized by the following algorithm. Consider a given a set of N surfaces of MRI images to be clustered; the algorithm performs the following steps [18]:
1. Train one HMM profile λi for surfaces si.
2. Calculate the distance matrix D={D (si; si)} representing a similarity measure between surface features; this is typically obtained from the forward probability that gained by the HMM profile.
3. The Log-Likelihood (LL) of each model, given surfaces that computed in step 2 used to build an LL matrix. This matrix has N × N numeric value. Where each row is a feature for one surface. That includes the similarity measure from all other surfaces of image.
4. At this stage where parallelized by distribute all the surface areas of images to the available process.
K-mean clustering: This proposed k-means clustering method [19] algorithm uses an iterative refinement technique, summarized in the following algorithm.
1. Place C points into the space represented by the surface feature vectors that are being clustered. These points represent initial group centroids C’
2. Assign each sequence to the group that has the closest centroid C’.
3. Update and recalculate the positions of the C centroids.
4. Repeat steps 2 and 3 until the centroids no longer move or max iteration is reached.
The sequential procedures/algorithms expend most of its time computing novel centroids (step 3) and computing the distances among n image pixels and C centroids (step 2). Execution time can be cut down by parallelizing these two steps. The distance computation process can be performed asynchronously and equivalent for every surface characteristics. Thus this proposed methodology use a parallelized clustering approach, where clusters are building by collecting neighbouring pixels of the image while regarding extracted surfaces using HMM. This method creates a set of clusters, each of which is replaced by a representative surface feature vector, typically its centroid C. Thus the MRI brain image is enhanced based on the surface feature extraction process proposed in this work. In order increase the segmentation accuracy for classification process, this work also proposed another pre-processing IIH method, which is discussed in detail as follows.
Intensity in homogeneity (IIH) correction in MRI brain images
Intensity in homogeneity modification is frequently an essential pre-processing phase facilitating improved image segmentation procedure. In difference, correct segmentation creates intensity in homogeneity modification quite unimportant. In this MRI image processing method, the presence of Intensity in homogeneities can significantly reduce the MRI image segmentation accuracy, if it also affects the classification accuracy. The IIH or intensity non-uniformity usually refers to the slow, non-anatomic intensity variations of the same pixels over the MRI image domain. It can be occur due to imaging instrumentation such as radio-frequency nonuniformity, static field in-homogeneity, etc. or the patient movement [20]. In accumulation to intensity in homogeneity, the MRI image configuration replica ought to include highfrequency noise. On the other hand, as elongated the Signal-to- Noise Ratio (SNR) is not low, noise can be estimated by a Gaussian distribution [17]. This estimation is suitable for image regions equivalent to tissues. Let consider the in homogeneity-free image , intensity in homogeneity field y’, and noise ξ interact. There two sources of noise were described such as biological noise, this is a type of noises correspond to the within tissue in homogeneity, and second one is a scanner noise that arises from MR device imperfections [16,18,19]. However, usually only one of these sources is modelled. The most general replica of MRI image configuration presumes that the noise, estimated by Gaussian probability distribution, happens from the scanner and is consequently self-determining of the intensity in homogeneity field y’. In accordance to this replica, the obtained image y is gained as follows, Let y denote the measured intensity and y’ the true intensity. Then the most popular model denoted as
Y= y’+ξ → (2)
To simplify the computation, one often ignores the noise and takes the logarithmic transform of intensity
xi=log yi=log y’+log i=xi ’+βi → (3)
Where y’ is the intensity at pixel i (i=1, …n). Here, only pixels with low intensities should be taken for avoid numerical problems when it occurring in computation process, which are usually excluded from computation.
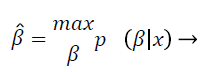
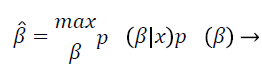
In the log-transformed model, noise is tranquil implicit to be Gaussian, which is practical suitable but conflicting with the initial replica from Equation 2 that presumes the noise is Gaussian in the unique non-logarithmic field. This discrepancy was actually not measured pertinent enough. Nonetheless, in the majority of in homogeneity modification techniques, the noise is gripped by uncomplicated filtering, smooth replica fitting, or some outline of regularization and is consequently measured quite immaterial. In segmentation based intensity in homogeneity correction method, both of these two intensity in homogeneity modification technique and segmentation methods are amalgamated, so that they profit from each one other, concurrently acquiescent improved in homogeneity correction and segmentation. This intensity in homogeneity modification techniques are furthermore categorized according to the image partition process exploited. The statistical methods such as segmentation method of this proposed work may assume that the IIH follows the Gaussian distribution, to estimate the IIH map; frequently the Bayes’ rule has been employed when the IIH is modelled by a distribution like Gaussian. Let β be a random vector (1, …, n) with probability density p (β). To estimate β, one can maximize the conditional probability of β given x (the log-transform of y) as follows:
 (4)
(4)
This is called the maximum a posterior estimate and, by the Bayes rule, is equivalent to
 (5)
(5)
Wells et al. [21] used the Gaussian distribution to model the entire log-transformed bias field and the observed intensity at pixel i:
 (6)
(6)
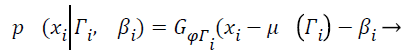 (7)
(7)
Where Γi is the tissue class at pixel i with mean value μ (Γi), and
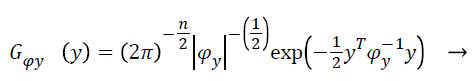 (8)
(8)
With Ψy as the covariance matrix. By assuming the statistical independence of pixel intensities and from Equation 7 and equation can derive
 (9)
(9)
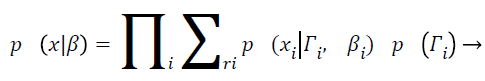
When the MRI image is not polluted by IIH, the above method is simply the tissue classification using a mixture Gaussian model. Hence, this method essentially interleaves the IIH correction with a Gaussian classifier. Frequently finite Gaussian mixture models and finite mixture are utilized and customized to include intensity in homogeneity for increasing the segmentation accuracy of this proposed MRI image processing method, in order increasing the accuracy of the partitioning, final MRI brain representation categorization also increased and which will provide an efficient tumour diagnosis results.
Segmentation of brain MRI using region based active contour model (ACM)
Segmentation by means of Active Contour Model ACM (Snakes) was introduced [22]. The fundamental concept of the active contours, or deformable models, for image segmentation is relatively uncomplicated. The user indicates an initial guess for the contour, which is subsequently moved by image driven forces to the boundaries of the preferred objects. Most commonly applied scheme of medical image segmentation is level set scheme or ACM. This entrenched scheme of segmentation is applied in order to obtain promising results of segmentation with accuracy and provide closed and smooth contour of object boundary, which assist in extracting the features like texture and shape of the image data. This scheme of segmentation is categorized into two broad classes. First class is edge-based scheme of segmentation uses gradient to show contour evolution. Because of the use of gradient, segmentation is susceptible to noise and weak edges. At the same time, second class is region based scheme make use of the region descriptor like intensity, texture, shape etc. to identify RoI, to show curve evolution. Region based scheme segmentation provide enhance results even in the occurrence of noise and edge leakage of object boundary since this is less susceptible to initial contour location. Here, majorly concentrated on region-based ACM with level set formulation for image segmentation.
A region-based active contour model: ACM are categorized into two, namely: edge-based and region based models. The edge-based model makes use of the incline of the representation to terminate the contour during evolution for the purpose of boundary detection of the foreground object. A region-based ACM makes use of statistical details of regions both inside and outside the curve for contour evolution, for instance, the Chan-Vese (C-V) model.
This model grounded on the supposition that the pixel regions of the representation are statistically homogenous. It works extremely well even with noisy, blur images and images that have multiple holes, disconnected areas etc. In MRI brain image analysis, the region based ACM since takes global properties of images like contour lengths and MRI image pixel regions as alongside local properties like gradients. The energy minimizing function can be given as follows:
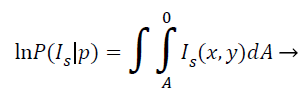 (10)
(10)
Where IS (x, Y) is the intensity at the pixel location (x, y) in the image, and the integral gives the total area enclosed by the curve p. As is evident, the region-based information visually improved the segmentation quality compared to the one using only gradient information.
Feature extraction method for brain MRI image analysis
After segmentation, the following features are extracted from the brain MRI images such as texture and shape. The feature of these images can be stored for further analysis. Feature extraction is a one of the important process in MRI medical image based tumor analysis. The feature extraction process is used for creating a representation, or transformation from the original image. In the MRI medical images have the primitive features like texture, shape, edge, darkness, etc. From these features, the most promising features like texture and shape/ edge are extracted for classification accuracy in the proposed methodology. The variation of each pixel with respect to its neighbouring pixels of the images defined as a texture. Hence these textural details of MRI image regions can be compared with a texture template and extracted using hybrid wavelet transformation method. The shape/edge is simply a large and frequently changed. The shape features of the MRI images are extracted using Sobel and Canny edge detection method. Both of these two types of feature descriptors are mainly used most often during feature extraction process in MRI brain image based tumour analysis process. Feature extraction is a one of the important process in MRI medical image based tumour analysis. The feature extraction process is used for creating a representation, or transformation from the original image. In the MRI medical images have the primitive features like texture, shape, edge, darkness, etc. From these features, the most promising features like texture and shape/edge are extracted for classification accuracy in the proposed methodology. The variation of each pixel with respect to its neighbouring pixels of the images defined as a texture. Hence these textural details of MRI image regions can be compared with a texture template and extracted using hybrid wavelet transformation method. The shape/edge is simply a large and frequently changed. The shape features of the MRI images are extracted using Sobel and Canny edge detection method. These two types of feature descriptors are mainly used most often during feature extraction process in MRI brain image based tumour analysis process. The texture and shape feature extraction technique are described in detail as follows.
Texture feature extraction (Hybrid wavelet transform): In brain MRI image analysis, an initial assumption of distinguishing image consistency is that all the texture data is enclosed in the gray-level value matrices of MRI image. Hence all these textural features are extracted from these gray-level value matrices. The energy measures are mostly transmitting to detailed textural distinctiveness of the MRI image. Supplementary measures distinguish the difficulty and environment of gray level change which happens in the MRI representation. Although these characteristics enclose data about the textural distinctiveness of the image, it is firm to recognize which exact textural feature is signifies by every features. Texture feature extraction is a most important stage in MRI image analysis in which texture features of each image is separately extracted from MRI by wavelets which considers better method to extract most emphasizing pixels present in images to improve results. To decompose data into different frequency components wavelets mathematical functions are used and then each element is studied having resolution matched to its degree. For analysis of complex datasets wavelet is a new powerful mathematical tool. Fourier transform fails due to the redundant set of features and only give frequency information that is not spatially localized but wavelet provides time frequency information which is localized in space and perfect tool for pattern recognition tasks.
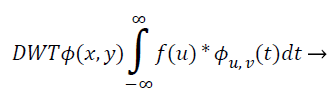
Hybrid discrete wavelet-cosine modulated wavelet transform: The recommended scheme makes use of the Discrete Wavelet Transform (DWT) coefficients as characteristic vector. The wavelet is an influential arithmetical tool for feature mining, and has been utilized to haul out the wavelet coefficient from MR representation. Wavelets are restricted rooted functions, which are shifted and scaled accounts of certain unchanging mother wavelets. The most important benefit of wavelets is that they offer localized frequency data about a function of a signal, which is chiefly helpful for categorization. An appraisal of essential basic of wavelet decomposition is initiated as given below: The continuous wavelet transform of an image square-integrable function, is distinct as:
 (11)
(11)
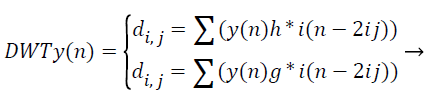
Where, φu,v (t)=1/|√μ| and the wavelet φu,v is calculated from the mother wavelet by dilation and conversion, wavelet, a → dilation factor and b → translation factor (both being real positive numbers). Underneath certain gentle assumptions, the mother wavelet gratifies the restraint of containing zero mean. The Equation 6 can be discretized by preventive u and v to a discrete lattice (u=2 v; u ε R+: v ε R) to provide the discrete wavelet transform. The Discrete Wavelet Transform (DWT) is a linear conversion that functions on a data vector whose length → integer power of two, converting it into a numerically diverse vector of the similar length. It is a means that divides data into diverse frequency elements, and then investigates every part with declaration coordinated to its level. DWT can be uttered as.
 (12)
(12)
The feature components in signal y (n) and match up to the wavelet function, where di, j → the approximation components in the representation signal. The functions h (n) and g (n) the equation symbolize the coefficients of the high-pass and lowpass filters, correspondingly, at the same time as factors i and j → wavelet scale and translation factors respectively. The most important characteristic of DWT is multiscale illustration of function. With the use of wavelets, provided function can be investigated at diverse stages of resolution. In texture characteristic mining with the use of DWT, the segmented unique representation is procedure along the x and y direction by h (n) and g (n) filters in which is the row demonstration of the unique image. As a consequence of this change shows 4 sub band (LL, LH, HH, and HL) representations at every scale. The sub bands of the representations are utilized for cosine adapted WT computation at the subsequent level. Thus the diverse sub bands are produced with the use of DWT.
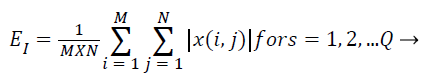
Subsequent to that the cosine-modulated wavelet transformation [23], is relating a number of sub-bands, which are produced using DWT in MRI representation. The magnitudes of wavelet coefficients in certain sub-bands are superior for images with a burly textural contented at the orientation and frequency represented by that sub-band. Consequently, the textural characteristics of MRI image can be symbolized by feature vectors that enclose the average coefficient magnitude, recognized as averaged energy function. The energy distribution has significant biased possessions for images and as such can be utilized as characteristics for MRI image categorization. This work makes use of energy signature for mining of texture characters as it imitates the allocation of energy along the incidence axis over orientation and scale. The biased possessions of the energy distribution in sub-bands consequence in texture character that have been experimental to acquiesce good description of textures for MRI image categorization. The energy characteristic of the image is provided by,
 (13)
(13)
Where x → wavelet decomposed image for any sub-band of dimension M × N. For K-level decomposition of the representation, the dimension of the feature vector is Q=(3 × K +1) as diverse characters have diverse variety of probable values and the whole characteristic may not have the similar the same level of implication for the reason that after decomposition of image, the sub-bands with superior resolution communicates to noise and may not precious for categorization. So all these feature standards are regularized in the variety of 0 and 1 by the utmost value in the characteristic space prior to categorization of these MRI representation.
Shape feature extraction: For shape feature hauling out in brain MRI image analysis, edge finding is a most important process. Shape feature mining in image investigation necessitates the hauled out edges to be associated in order to imitate the limitations of substance available in the representation. Then this shape feature extraction based on the edges in MRI brain image process is very useful further computational process. The diverse gradient operatives utilized for edge mining, here this proposed shape feature extraction method used for Sobel and Canny method.
Edge detection methods-Sobel and Canny: One of the most popular features for image classification is edges. Edges refer to boundaries of an object surface where the intensities change sharply. This anticipated edge detection technique used Canny and Sobel beside with the gradient operatives to haul out the shape characteristics in form of linked boundaries. The Sobel operative is one of the most generally utilized edge detectors.
The amount of the gradient of the Sobel operator is computed by,
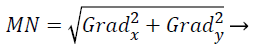 (14)
(14)
where the partial derivatives are computed by
 (15)
(15)
 (16)
(16)
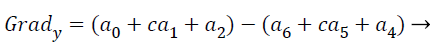
with the constant c=2. The other gradient operators, Gradx and Grady can be implemented using following convolution masks:
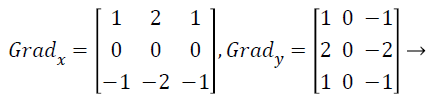 (17)
(17)
that this operator places an emphasis on image pixels that are closer to the center of the mask.
Canny edge detector make use of a filter grounded on the first imitative of a Gaussian, since it is vulnerable to noise available on raw unrefined image information, so to start with, the uncooked image is convolved with a Gaussian filter. Canny operator is nonentity but incline of Gaussian filtered representation. The convolution masks of canny operators are given as follows:
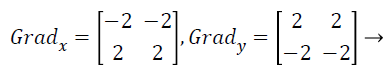 (18)
(18)
The edge detection using canny operator choose thresholds to get the edges of the images, the chosen higher threshold always is three times of lower threshold. Handle the MRI image pixels between the lower threshold area and higher threshold area. This will give a thin line in the output MRI image, which is more efficient for final classification process in MRI brain image analysis.
Feature selection using fast independent component analysis
Aim of this proposed feature selection based on ICA is selection of the best features for classification purposes. Independent component analysis is an unsupervised learning method based on high order information. The basic ICA system model of is given as
X=AS or BX=S → (19)
Where X be the extracted feature vectors, S are the independent source features, A is the mixing matrix and B is the un-mixing matrix. Unmixing B model is more correct than the mixing matrix A, then only B is used to project the feature vectors representing input image onto independent components, so B must be calculated from the given input. Consider n is the number of source features of the MRI image, m is the number of extracted features of the MRI image, and the hauled out characteristics are linear mixtures of the source features. Then, the extracted features X=(x1, …, xm) and the source features are represented in the following ICA unmixing model,
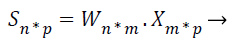 (20)
(20)
Where W=(w1, …, wm) is the unmixing matrix, or weight matrix, and wi=wi1, …, win: i=1, …, n.
In the ICA transformation model, the features si are assumed to be statistically independent and no more than one feature is Gaussian distributed. If information on a feature si in S does not give any information on the other features, then si is considered independent of these features. According to the assumption of non-gaussianity, the desired independent features si contains the least Gaussian features.
The main work of ICA is to estimate the weight matrix W and a measure of non-gaussianity is the key. The classical measure of non-gaussianity is kurtosis, which is the fourth order statistics and has zero value for Gaussian distribution. However, kurtosis is sensitive to outliers. Since a Gaussian variable has the largest entropy among all random variables of equal variance, the reverse entropy namely known as negentropy, which can be utilized as a gauge of nongaussianity. The negentropy is defined as Equation 21.
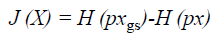
Where H (pxgs) is the entropy of a Gaussian random variable with the same covariance matrix as X and H (px) is the differential entropy. Since the negentropy is difficult to compute, an approximation is used instead.
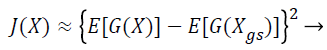 (22)
(22)
where (G (X)) is a non-quadratic function. In order to maximize the objective function shown in Equation 22, the proposed Fast ICA consists of two processes, the one unit process and the de-correlation process.
 (23)
(23)
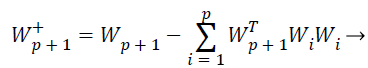
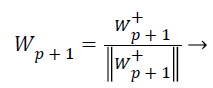
While the one unit process estimates individual weight feature vectors, the decorrelation process keeps different weight vectors from converging to the same maximal. Given p decorrelated weight feature vectors and the p+1 th weight feature vector estimated by the one unit process, the p+1 th weight feature vector is decorrelated from p weight feature vectors by Equations 24 and 25,
 (24)
(24)
 (25)
(25)
ICA-based feature selection: Main aim of this work is the selection of the best feature subset for classification purposes given a high-dimensional extracted feature vector. When ICA is used to reduce dimensionality of MRI images, the number of extracted features X is the original dimensionality. The extracted feature X is the vector values of all pixels in the MRI images. The source features S exist in a lesser dimensional room consequent to the available equipment in the MRI image, and each independent component i.e. independent features si is distinctive for one material. Since the number of present materials may be unknown, this process evades changing the unique MRI descriptions to the source Features S which is associated to the amount of materials. Instead, here this work randomly assume but evaluate the weight matrix W to observe how each original features contributes to the ICA transformation described above. Suppose the number of materials in an m feature MRI image is n, obtain the corresponding weight matrix Wn-m using Fast ICA. In the ICA unmixing procedure, to estimate the source S (pure materials) from the extraction X (pixels in the MRI image) with the weight matrix W, after that this work can estimate the importance of each feature vector for all materials by calculating the average absolute weight coefficient , which is shown in Equation 26,
 (26)
(26)
By sorting the average absolute weight coefficients for all feature vectors obtain a feature weight sequence
 (27)
(27)
Where. In this series, the characteristics with superior average absolute weight coefficients that are also recognized as finest features, which supplies additional ICA transformation than other characteristics do. That means these features contain more feature vector information than other features. Therefore, this best feature selects the vectors with the highest average absolute weight coefficients for the purpose of features selection. Because typical MRI image analysis methods treat each image features as an independent variable, and call these selected features as independent features.
Classification process using modified LM with modified BAT algorithm
The MRI image classification has remained largely new work with different approaches, one of them is, Modified Levenberg Marquardt (MLM). The MLM is a one of the most efficient classifier to increase the classification performance in the MRI brain image based tumor diagnosis process and that classifies and to assign labels to extracted features from the feature extraction and selection steps through MRI images. This work is an attempt to use MLM to automatically classify brain MRI images under two categories, either tumorous or non-tumorous with use of Modified Bat (MB) algorithm optimization method. Here this proposed MB-MLM classifier using feature vector gained from the MRI images and classify the MRI brain images. The proposed classifier methodology is described in detail as in follows.
Bat algorithm: Generally BA is an extremely influential algorithm and creates healthy explanations on lower dimensional functions but its presentation diminishes as the measurement of difficulty increases [24]. Bat Algorithm (BA) is a heuristic algorithm anticipated by Yang. It is grounded on the echolocation capability of micro bats directing them on their foraging behaviour [25]. Here this proposed work used to optimize the search direction space with Modified Bat algorithm (MB), the result of the optimized search direction used in the MLM for efficient classification results in MRI brain images analysis process. Here the following section describe about the basic structure of Bat optimization algorithm.
Echolocation capability of bats: Bat utilizes a kind of sonar identified as echolocation to distinguish diverse sorts of insects, communicate, intellect distance to their victim and shift without striking to any obstruction still in whole darkness. The echolocation features are put on a pedestal within the structure of the subsequent rules by assistance such characteristics of bats:
1. Echolocation process is used by all bats for sense distance, and the bats also know the difference between food and prey.
2. They are flying arbitrarily with velocity v at location with a frequency f, unreliable wavelength and volume L0 to look for prey. They can mechanically regulate the wavelength (or frequency) of their produced pulses and regulate the velocity of pulse emission r ε (0, 1) based on the propinquity of their object.
3. Even though the loudness can differ in numerous ways, and presume that the loudness differs from a bigger (positive) to a least constant value Lmin
The structure of BAT algorithm: (a) Initialization of bat population: The search space is assumed as a region that contains many prey sources on it. The algorithm tends to find the high or optimum quality food in the search space. Because locations of food sources are not known, initial inhabitants is arbitrarily produced from real-valued vectors with measurement D and number N, by enchanting into report upper and lower boundaries. Then, quality of food sources located within the population is evaluated.
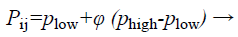 (28)
(28)
where i=1, 2, …, N, j=1, 2, …, D, Phigh and are lower and upper boundaries for measurement correspondingly ϕ is a arbitrarily produced value assortment from 0 to 1.
(b) Generation of velocity, frequency, and novel solutions: Calculated fitness values of all bats authority their actions. Bats take off with velocity v which is exaggerated by an arbitrarily predefined frequency f. Lastly they situate their novel position xi in the investigated space.
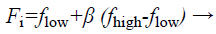 (29)
(29)
 (30)
(30)
 (31)
(31)
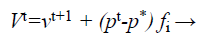
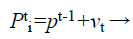
Where fi is a frequency value belonging to the ith bat, flow are lower and higher frequency standards, correspondingly, β indicates a randomly generated value, p• is the obtained global best result after contrast of all results amongst bats so far and vt implies the velocity of the bat at tth time step.
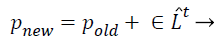
(c) Local search capability of the algorithm: The improvement of local search ability of the algorithm, Yang has created a structure in sort that the bat can advance the result near the attained one [26].
 (32)
(32)
Where pold a higher excellence result is selected by a few mechanisms (e.g. roulette wheel), ̂Lt is average loudness rate of all bats at tth instant step and ε is a randomly generated value ranging from −1 to 1.
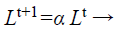
(d) Loudness and pulse emission rate: The pulse emission rate r and loudness L are rationalized as a bat gets nearer to its object, namely its prey. Loudness L is decreased while pulse emission rate r is increased with admiration to Equations 33 and 34, respectively
 (33)
(33)
 (34)
(34)
where α and γ are constraints, ro is the initial pulse emission rate value of the ith bat.
Proposed modified BAT with modified LM algorithm for classification: Considering general Levenberg-Marquardt which is trained in Artificial Neural Network (ANN) and uses approximated Hessian matrix in the subsequent Newton-like inform:
 (35)
(35)
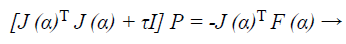
Where, xk+1 and xk points of Newton method at kth iteration, τ is the learning rate of set-up, α is a vector, J is the Jacobian matrix, and e is the error vector. There is utilized incline can be calculated as, gk=j (α)T e and the Levenberg-Marquardt algorithm was intended to draw near second-order training speed devoid of having to calculate the Hessian matrix. When the presentation purpose has the outline of a sum of squares then the Hessian matrix can be estimated as
 (36)
(36)
In Newton’s technique, hessian approximation process step is
not well conditioned. The vector error analysis definitely
establishing that the Cholesky stable algorithm, that assumes
the Hessian matrix is sufficiently positive definite in LM. The
main drawback of the previous work is when the value of n is
large, here n is a parameter of vector; it is expensive both in
computational effort and memory to compute the error
reduction process. When H is sufficiently positive definite it is
also unnecessary. In order to overcome aforementioned
problem, the Hessian Matrix is modified to compute a search
direction based on modifying the Cholesky factorization. Let denote the Cholesky factor generated by this algorithm, then α
is chosen such that
denote the Cholesky factor generated by this algorithm, then α
is chosen such that  where α2=max {γ, ξ/n, α},
γ and ξ are the largest in modulus of the diagonal and offdiagonal
elements of H respectively, and as before is some
small positive scalar.It can be shown that
where α2=max {γ, ξ/n, α},
γ and ξ are the largest in modulus of the diagonal and offdiagonal
elements of H respectively, and as before is some
small positive scalar.It can be shown that  a diagonal matrix;
 is bounded and
 a bounded condition
number. The algorithm requires almost the same computational
effort as the Cholesky algorithm.Let
a bounded condition
number. The algorithm requires almost the same computational
effort as the Cholesky algorithm.Let  denote the Cholesky
factor of
denote the Cholesky
factor of  . It follows a suitable sequence of sufficient descent
search directions in network, {pk} are obtained by solving
. It follows a suitable sequence of sufficient descent
search directions in network, {pk} are obtained by solving  , and this obtained search direction is
optimized using with proposed modified BAT procedure for
optimal classification results.
, and this obtained search direction is
optimized using with proposed modified BAT procedure for
optimal classification results.
Search directions optimization with modified BAT: From the detail description of the Bat algorithm in the above section, in this proposed work used modified version of the Bat algorithm for classification process. This new Modified Bat algorithm (MB) performed with MLM and provides optimized search space for further MLM classification process.
The update processes of velocity and location in the Bat algorithm provides the best optimization result. The main purpose of this modification is to intensify the frequency equation at the beginning of the optimization process and then the velocity toward the end of the optimization process in turn. The modified equation is used in this proposed work given below.
 (37)
(37)
where ω → inertia weight factor that balances, search intensity of the ith result by calculating the amount of old velocity v. This alteration configuration was also exploited in MLM to optimize the investigated direction pk at kth iteration for categorization procedure.
From MLM, when H• is sufficiently positive definite then in
the neighbourhood of the solution and Newton steps
are taken, an optimized search direction pk as defined avoids
saddle points.
and Newton steps
are taken, an optimized search direction pk as defined avoids
saddle points.
For the Newton method, this approximation can be employed for this modified Hessian and subsequently to solve,
 (38)
(38)
Where F is the features vector-valued function, then to calculate the optimized search direction pk and then let αk +1=αk+pk. More willingly than approximating the Hessian as in Equation 38, the outline term in Equation 37 can be given as by τI where τ ≥ 0. Following this the Hessian is approximated as
where J → Jacobian matrix that comprises first derivatives of the system faults with esteem to the biases and weights, and e is a vector of set of connections faults. The Jacobian matrix can be calculated during a typical back propagation method that is much lesser multifaceted than calculating the Hessian matrix.
Now to find descent search direction, p, and the following equation is solved:
 (40)
(40)
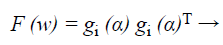
After that the performance index of the back propagation neural network defined by,
 (41)
(41)
Where w=(w1, w2, …, wN) consists of all weights of the network, gi (α) is the gradient error vector comprising the error for all the training examples.
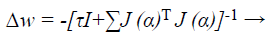
When training with the LM method, the updating of weights Δw can be obtained as follows:
 (42)
(42)
Where J→ Jacobian matrix, I is the identity matrix τ is the learning rate which is to be updated using α depending on the outcome.
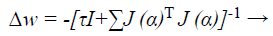
Based on LM classification algorithm, modernizes the ANN weights as given below:
 (43)
(43)
Where J → Jacobian matrix of the error gradient gi (α) assessed in vector α, and I → identity matrix. The error gradient gi (α) → error of the network. The parameter τ is decreased r increased at every step. If the error gradient is decreased, then is alienated by a factor α and it is multiply by α in supplementary case, while updating the network weights.
It computes the error vectors, the set-up output, and the Jacobian matrix for every pattern. Then, it calculates Δw using Equation 43 and recalculates the fault with w+ Δw as set-up weights. If the fault has diminished, τ is alienated by α, the novel weights are upholded, and the procedure initiates again; or else, is multiplied by α, Δw is intended with a novel value, and it categorize again. The procedure is repetitive until the fault decreases. When this happens, the current iteration ends.
Algorithm for MB-MLM:
Begin
Initialize ANN Weights;
While not stop criterion
Calculates the gradient error gi (α) each i, jth element;
Solve search space optimization, to obtain the efficient optimal result using Equation 36.
Recalculate the gradient error gi (α)
Using w+ Δw as the trial w, and evaluate
J1=Σ J (w + ΔW)T gi (α) (w + ΔW);
Calculates j (α) for each element;
Repeat
Calculates ΔW;
J2=Σ gi (α)
if (J1<=J2) then
τ=t × a;
End if;
Until (J2<J1)
τ=τ/a;
w=w + ΔW;
End while;
The outcome of MB-MLM classifier decides whether an input image dataset is tumorous or non-tumorous. The proposed methodologies performance is evaluated based on the following performance parameters such as sensitivity, specificity and classification accuracy, which is described in detail in following section. Similarly some of the work proposed in the recent work [27] based on the feature extraction and feature selection to enhance classification accuracy.
Experimentation Results
For tumour diagnosis in MRI brain images, the proposed methodology used different medical image analysis methods. Mainly the proposed classification algorithm is given the optimal result of the tumour diagnosis in MRI image with segmentation process. The pre-processing, feature extraction and feature selection processes are enhance and reduce the dimensionality of the given input MRI images, which will be lead to the optimal results in tumour diagnosis process in MRI brain images. The following section shows that the proposed classification method’s performance evaluation with use of the parameters such as sensitivity, specificity and classification accuracy rate. The proposed classification method results are also compared with the existing methods with and without segmentation method. The proposed methodology results are evaluated with use of DICOM database MRI brain Images, namely known as DCI and obtained by using MATLAB. The proposed classification result proven that it will classify the given input MRI brain images as tumorous and non-tumorous in most efficient manner than existing methods. In future work pre-processing of the brain images, feature extraction and feature selection and classification is performed to pathological tissues (tumor), normal tissues (White Matter (WM) and Gray Matter (GM)) and fluid (Cerebrospinal Fluid (CSF)), extraction of the relevant features from each segmented tissues and classification of the tumor images.
Performance evaluation
The proposed method’s results are evaluated by using the following performance parameters, which are defined as follows:
Sensitivity: Recall (or) sensitivity (or) true positive rate is the possibility of the real optimistic classes which are recognized properly.
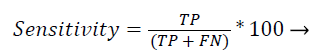 (44)
(44)
The Figure 2 shows that the comparison result of sensitivity using the existing four different methods with proposed classification algorithm. The graph resu