Research Article - Biomedical Research (2019) Volume 30, Issue 4
Left ventricular wall deformation of CMR images using statistical analysis.
Nageswararao AV1*, Srinivasan S2
1Department of ECE, NEC Narasaraopet, JNTUK University, Andhra Pradesh, India
2Department of Instrumentation, MIT campus, Anna University, Tamil Nadu, India
- Corresponding Author:
- A Venkata Nageswararao
Department of ECE
JNTUK University
Andhra Pradesh
India
Accepted on May 14, 2019
DOI: 10.35841/biomedicalresearch.30-19-173
Visit for more related articles at Biomedical ResearchAbstract
Ventricular hypertrophy is one of the prevalent cardiovascular diseases. Quick and efficient diagnosis is the need of the hour and this paper attempts on an automated left ventricle wall deformation analysis which helps in the diagnosis of left ventricular hypertrophy. Intensity In-homogeneity Cardiac Magnetic Resonance (CMR) images are segmented by the proposed hybrid segmentation of Kirsch and modified Chan-Vese (CV) method with split-Bregman optimization. Co-occurrence features like contrast, correlation, energy and homogeneity are extracted from the segmented ventricular images. The features are then analysed in different directions of rotation for both normal and abnormal images in systolic as well as diastolic phases. Finally the area of the ventricular wall is obtained for both normal and abnormal images. The results thus obtained show that left ventricular wall deformation analysis using statistical features helps in the detection of pathological and physiological condition of the ventricles.
Keywords
CMR, Intensity in-homogeneity, Ventricular hypertrophy, Co-occurrence features.
Introduction
Cardio Vascular Disease (CVD) [1] is the prevalent disease that causes heart failure due to various conditions and assessment of wall motion function is of eminent importance for the diagnosis and follow-up of patients with cardiac diseases. Dobutamine stress echo [2,3] is the technique used in practice which is limited by the size of the acoustic window. Wall analysis [4] is individual dependent with modest quantification and reconstruction. In recent times, detection of Wall motion abnormality using Cardiac Magnetic Resonance (CMR) images has attracted significant research attention [5,6]. Contrast enhanced CMR is an alternative method of detecting abnormalities in regional wall motion.
One of the standard imaging modalities used in clinical practice for imaging the heart is CMR Imaging. CMR images can be used to analyze multiple portions of the cardiac system like anatomy, function, perfusion, flow and tissue characteristics in a single examination. Imaging modalities other than CMR would require multiple studies and the subsequent difficulty in combining these data from the different unregistered modalities each with their spatial and temporal scales. CMR is a technique to study complex structures such as the left and right ventricle with highly accurate volumetric measurements without relying on the use of geometrical assumptions. CMR does not depend on acoustic window and has a higher resolution and therefore enables more accurate quantification.
The clinical and preclinical applications of tissue tagging and DENSE in assessing wall motion mechanics in both normal and diseased hearts, including coronary artery diseases and hypertrophic cardiomyopathy are discussed in [7]. The temporal pattern of the normalized myocardial wall thickness is used as a feature vector to assess the cardiac wall motion abnormality [8]. The method exploits the fact that a regular pattern of stripe tags induces a time dependent frequency covector field tightly coupled to the myocardial tissue and not affected by tag fading [9]. To extract and use the myocardial strain pattern from tagged Magnetic Resonance Imaging (MRI) to identify and localize regional abnormal cardiac function in human subjects. In order to extract the myocardial strains from the tagged images, we developed a novel nontracking-based strain estimation method for tagged MRI [10].
Left Ventricle (LV) wall motion local contractile patterns of the myocardium [11] can be differentiated from the contractile properties of myocardial areas impaired by CVD due to decrease of blood supply. Initial and exact finding of abnormalities in local LV wall motion considerably helps in the diagnosis and treatment of CVD [12]. Cardiac function is predictable by manual estimation and interpretation of LV in clinics and leads to variable results depending on the human expertise.
In recent years, computer based analysis have been tried to analyze LV myocardial function automatically and quantitatively. According to American Heart Association (AHA) standard [13], LV is alienated into 17 segments, which is commonly followed in clinical practice. The two main issues in myocardial function assessment are indicators for any patient characterizing the myocardial function and development of statistical model that discriminates healthy from diseased areas.
Punithakumar et al. [14] built a nonlinear dynamic model which characterized myocardial-segment motions by a naive Bayes classifier with features like area and radial distances as inputs with Shannon ’ s differential entropies. Sparse shape models proposed by Leung and Bosch [15,16] using principal component analysis and orthomax rotations of two and fourchamber echocardiographic sequences with localized variations. The local wall motion is assessed from the resultant shape parameters. Suinesiaputra et al. [17,18] built normokinetic myocardial shape models and proposed to use classifier based on independent component analysis and local shape characteristics to perceive and confines abnormally shrinking segments. In Lekadir et al. [19] developed a statistical model that considers both spatial and temporal interlandmark relationships. Lu et al. [20] proposed a pattern recognition technique using a normalization scheme based on intra-segment correlation that maps each LV size, intensity level, and position with the polar coordinates. A differentiablemanifold analysis is done based on differential geometry concepts to define a deforming manifold for the parameterization of the LV domain. Local cardiac abnormalities are classified from myocardial strains using linear discriminant analysis and spatio-temporal tensor analysis [21].
Features such as radial, circumferential strain and tissuerotation angle were used to train via manual segmentations of the myocardium and test a classifier with the proposed method results. Boundary delineations of endo and epicardial contours in all frames of a cardiac sequence are used in most of the existing semi-automatic or automatic methods [22]. Manual segmentation used in clinical practice is a computationally expensive and challenging task.
In general, segmentation algorithms require half-prior or fullprior user interaction and intensive manual training, in addition to the huge amount of data that is to be analysed. Furthermore, the resultant segmentation results based on training data may lead to errors due to informal parameters. Myocardium motion abnormality detection might be hindered due to inherent difficulties of segmentation algorithms. Shape analysis based segmentation algorithms require training with multiple delineations which significantly needs more amount of prior information and higher complexity.
Conventional methods for the analysis of regional heart function are statistics based theoretic measures and unscented kalman filter approaches, differentiable manifolds, independent component analysis classifier, pattern recognition technique based on intra-segment correlation and tensor-based classification [23,24]. These segmentation algorithms are mainly limited by the need for extensive prior information and expensive computation time.
Materials and Methods
Chan-Vese (CV) method
Chan-Vese (CV) method [25,26] for a given image I0 (x,y) expressed by minimizing the energy function in the domain given as follows,
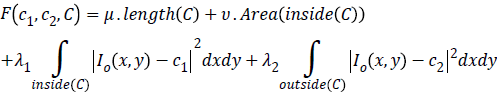
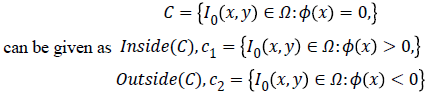
where, μ ≥ 0, v ≥ 0, λ1λ2 ≥ 0 are fixed parameters. μ Smoothness controlling parameterv, indicates the propagation speed, force driving the image data inside and outside the contour can be controlled by λ1 and λ2. C1 and C2 represent the approximate energy functions of the image intensity inside and outside C. Level set formulation of this energy function
 +By minimizing Equation 1, we obtain
By minimizing Equation 1, we obtain
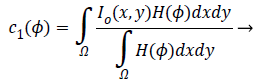 (2)
(2)
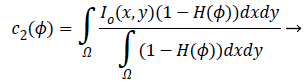 (3)
(3)
The corresponding level set function obtained by minimizing Equation 1 considering the area and energy terms is as follows
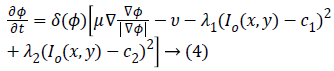
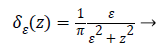
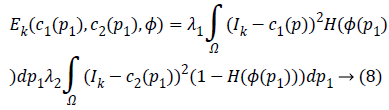
Where gradient operator is ∇ , Heaviside function is H(ø) and Dirac function is δ(ø). In a level set function domain,
While  is a Dirac function. The regularized
versions of Dirac function in general is given as follows
is a Dirac function. The regularized
versions of Dirac function in general is given as follows
 (5)
(5)
 (6)
(6)
Detection of edges around the closed curve line c in the image
is limited by the Dirac function  due to the
comprehensive nature of the algorithm. CV method maintains
numerical stability by the use of Equation (4) that gives
complex differential method. CV method achieves better
segmentation results in the homogeneity region by the global minimization of c1and c2 and energy function. In case of
inhomogeneous CMR images, CV method will over segment
the objects for these inhomogeneous boundaries as the local
intensity information is not considered by the energy function
obtained by C1 and C2.
due to the
comprehensive nature of the algorithm. CV method maintains
numerical stability by the use of Equation (4) that gives
complex differential method. CV method achieves better
segmentation results in the homogeneity region by the global minimization of c1and c2 and energy function. In case of
inhomogeneous CMR images, CV method will over segment
the objects for these inhomogeneous boundaries as the local
intensity information is not considered by the energy function
obtained by C1 and C2.
The proposed method
In the proposed automatic Kirsch hybrid method, the weighted average of the intensities inside and outside the contour of a point p1 can be approximated by a neighbourhood point p2, where p1 and p2∈R2 and Ω is a subset of R2 for an original image I.
The Kirsch kernel masks are obtained by considering a single mask and rotating it in eight compass directions. The final image obtained by the Kirsch operator is considered as Ik and the obtained energy function is given as
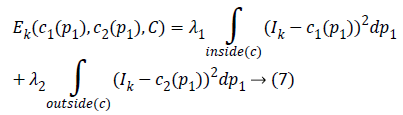
The two constants and in CV are replaced by spatially varying
functions 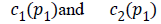 which is given as
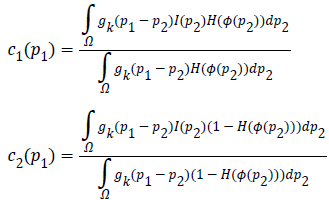
Where, Gaussian kernel function is 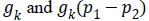 and is
the weight allocated to all intensities at p2.In level set methods,
Lipschitz functionø, which represents the evolving curve C is
chosen such that, inside the curve C, it is positive and negative
outside C. The new energy function becomes
and is
the weight allocated to all intensities at p2.In level set methods,
Lipschitz functionø, which represents the evolving curve C is
chosen such that, inside the curve C, it is positive and negative
outside C. The new energy function becomes
Where, H is the Heaviside function.
Split-Bregman [27] method is applied to the modified CV in order to optimize the combined energy function c1 and c2. The complex energy function can be reduced to a sequence of problems in the form,
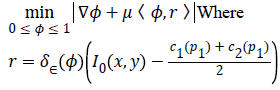
To convert the constrained into unconstrained problem, we apply the auxiliary variable, employ the Bregman iteration to the problem and add a quadratic penalty function for equality constraint. The final unconstrained problem is written as
The constrained problem is globally minimized, if the solution to this equation lies inside the interval [0,1]. If the solution lies outside the interval [0,1], the energy is strictly monotonic as the energy is quadratic and the minimizer lies at the endpoint closest to the unconstrained minimizer. Following are the element-wise minimization formula:
Equation (9) is minimized for fixed level set function with respect to d and obtained
In this algorithm, Gauss-Siedel function 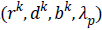 is
updated by Equations 11 and 13.
is
updated by Equations 11 and 13.
Extraction of co-occurrence features
In general, the texture models belong to either structural or statistical. In the first case, a family of primitives which characterizes texture is spatially organized. The second category involves the use of statistical tools and inference: gray level co-occurrence matrices, gray level run-length statistics and gray level difference [28]. Some successful applications include texture segmentation and texture feature extraction [29]. Wu et al. [28] developed an active contour model for image segmentation based on fusion of texture features obtained from gabor and gray level co-occurrence matrix.
Gray level co-occurrence matrices are widely used and wellknown
texture measures. A co-occurrence matrix represents
the histogram of the image in the form of a matrix. The inputs
that occur in pairs of points are the probability density pairs of
gray levels separated by the displacement vector d. suppose
denotes the set of pairs of points for a displacement vector
 , it can be represented as
 (15)
(15)
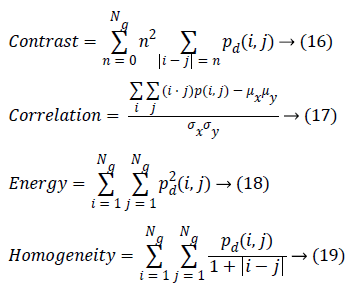
Where, (r, s) M × N, and |.| is the cardinality of a set, d is distance. The co-occurrence matrix in the direction 0º with distance d=1 is given by d=(1,1) which will be similar for matrices in other directions of 45º, 90ºand 135º. Co-occurrence matrix, distance d selection is important as it depends on ventricular wall thickness. The distance d for measuring the texture features of ventricle wall should be chosen to be smaller or equal to the width of the ventricle wall. Among the 14 Haralick texture features, the features such as contrast, correlation, energy, and homogeneity are the most relevant features. These features have been widely used in many applications and are evaluated as follows
Results and Discussion
Image acquisition
Analysis is carried out with 35 data sets consisting both 10 normal and 25 abnormal short-axis CMR images obtained from 3T MR imaging unit (Magnetom Symphony, Siemens Medical Solutions, Erlangen, Germany) of Rajiv Gandhi Government General Hospital, Park Town, Chennai. Using steady state free precession protocol a stack of 20-30 contiguous short-axis slices of matrix size 174 × 208 with a slice thickness of 7 mm, covering both the ventricles from the base to the apex were acquired for a repetition time of 3.4 ms and echo time of 1.7 ms.
Data sets consisting of both normal and abnormal short-axis CMR images with steady state free precession protocol stack of 20-30 contiguous short-axis slices obtained from 3T MR imaging unit of Rajiv Gandhi Government General Hospital, Park Town, Chennai are considered in the analysis. The CMR images are usually corrupted with in-homogeneity due to nonuniform magnetic fields produced by RF coils as well as disparities due to patient artefacts. In case of hypertrophic images, in-homogeneity is high because of similarity in the intensity values of uneven thickening of left ventricular walls. Thus to enhance the delineation of the ventricles for further analysis, it is necessary to perform in-homogeneity correction. The ventricular cavities are structures filled with blood and have a homogeneous dark region.
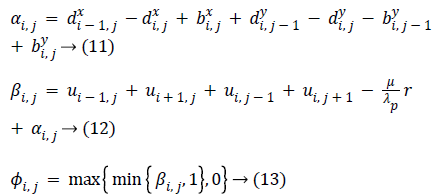
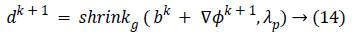
Initially CV method is used for ventricular segmentation and as it was unable to segment the ventricles, CV method was modified and a hybrid method was developed which segments the ventricles accurately as shown in Figure 1. This homogeneous region is segmented by modified CV method with split-Bregman optimization to isolate the ventricles from the background. Figure 2 shows the in-homogeneity corrected and segmented left ventricle in the two main phases of systolic and diastolic regions. The proposed method still produces rugged contours of the LV [29,30] partially solve the problem using Fourier descriptors.

Figure 1. Segmentation using CV method and proposed hybrid method (a) Original image (b) CV method output (c) Proposed hybrid method output.

Figure 2. LV Segmentation at Systole and Diastole. Systole: (a), (b), (c); Diastole: (d), (e), (f). (a) and (d) original images (b) and (e) inhomogeneity corrected images (c) and (f) segmented left ventricle images. Row 1-normal and Row 2-abnormal.
The evaluation of texture feature analysis of the normal and hypertrophic images is carried out on the complete cardiac cycle from systole to diastole. The intention is to analyze the regional cardiac function for early diagnosis of the harmful cardiovascular diseases like hypertrophic cardiomyopathy. Ventricular analysis is computed in three steps. In a first step intensity in-homogeneity correction is performed, segmentation is followed to select the region of interest (left ventricle). Finally to analyze the ventricular boundaries, features of contrast, correlation, energy and homogeneity matrices are calculated in horizontal direction (0º), rightdiagonal direction (45º), vertical direction (90º), and leftdiagonal direction (135º) with distance d=1. In 0º directions, Energy and homogeneity features have higher values compared to those in the other three directions for ventricular border regions.
In case of contrast feature, its value is lower in horizontal direction. Higher energy and homogeneity with lower contrast values indicate that in the horizontal direction there is less variation in the local textures. In this work, Co-occurrence features are used to evaluate the left ventricle regional function. Quantitative analysis of the dynamics helps to analyze the position and amount of ischemic myocardial injury. Increased left ventricular myocardial thickness is a feature of several cardiac diseases like Hypertensive heart disease, dilated cardiomyopathy, Hypertrophic cardiomyopathy and Myocardial infarction. In Hypertrophic cardiomyopathy, heterogeneities in wall thickness as well as composition and fibre structure are greater and therefore may be associated with greater variation in regional myocardial performance.
The existing methods for regional functional analysis have various limitations like inability to follow the myocardium from end systole to end diastole and lack of appropriate markers for measuring wall thickness. It may seem that normal and hypertrophic has larger intensity values in the direction of 45º, and comparatively smaller feature values were computed from the other three directions. It demonstrated that RF signals passing from 45º direction has more intensity and later distributed to the other direction. From Table 1, it can be observed that normal image intensity is increasing in the diastolic phase when compared to the systolic phase.
Contrast is a measure of the amount of local intensity variations of the image. Correlation gives the closeness of the neighbouring pixels with the reference pixel in the entire image. Feature values from both normal and hypertrophic were calculated in four directions. Contrast and correlation features are having lesser values for hypertrophic compared to normal in systolic and diastolic regions. Energy and homogeneity features are having higher values for hypertrophic in all the systole and diastole regions compared to that of normal as shown in Figure 3. Energy is high, if the gray level distribution is uniform periodically and in case of a constant image, energy is unity as distribution is uniform.

Figure 3. Co-occurrence features in phases of systole and diastole for normal and abnormal at 0° and 45 (a) Contrast (b) Correlation (c) Energy and (d) Homogeneity [0°: Normal-Black, Abnormal-Red; 45°:Normal-Green, Abnormal-Blue]. NS: Normal Systole; ANS: Abnormal Systole; ND: Normal Diastole; AND: Abnormal Diastole.
The contrast value in the direction of 0º is consistently lower compared to the 45º direction as shown in Table 1. In 0º directions, due to high energy and homogeneity, the contrast will be reduced. The contrast value reduces in hypertrophic due to similar pixel values and poor boundary identification when compared to normal images and it increases from systole to diastole.
Homogeneity is a measure of gray-tone variation in the spatial distribution of the image. Hence, the more homogeneous texture, larger the homogeneity value. The hypertrophic images are structures with larger variation and have higher homogeneity values in the horizontal direction (0º). The value of homogeneity is low, if the gray levels have limited range in the image and vice versa.
The values of energy and homogeneity for the hypertrophic walls were consistently higher than the values from normal ventricular walls with natural cardiac cycles. A discriminator function based on the energy and homogeneity features can be used to classify the ventricles in to normal and hypertrophic classes. The value of homogeneity in normal ventricles is low due to normal functioning of the wall motion during the cardiac cycle. The wall index of ventricles in terms of wall area is calculated from systole to diastole. It is noted that this differentiates between normal and hypertrophic wall index. Further, this result is used to classify the images as normal and hypertrophic.
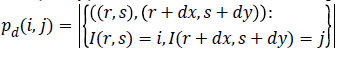
These texture features give information that normal has an increased vascularity of a healthy ventricle wall for biological changes to perform proper wall motion where the hypertrophic has a bright thinner wall which indicates that there is improper wall motion. The wall area of hypertrophic images becomes thinner as the area decreases, which means improper motion and unsmooth wall area as shown in Figure 4.

Figure 4. Area of normal and hypertrophic images in systole and diastolic phases.
The wall area gives an insight about ventricular hypertrophy which gives information about physiological changes through which wall index is computed and significantly differs between normal and ventricular hypertrophy. From the obtained systole to diastole results, it can be concluded that 0º has less contrast due to more energy and homogeneity; similar results were obtained from the data set (35 images). Then averaged values of contrast, correlation, energy and homogeneity for data set are computed. By analysing the contrast, correlation, energy and homogeneity in 0º directions, wall index values are obtained for different sizes of ventricles. The wall index is low for normal and high in the case of hypertrophic. By using this wall index the given images are discriminated as normal and hypertrophic images.
Conclusion
In this work, an approach to analyze the left ventricular wall deformation of CMR images has been proposed. The proposed hybrid segmentation method is applied to CMR images to extract ventricular portion. Texture features are used to analyze the ventricular wall deformations in different directions. In order to perform the deformation analysis, the extracted features are analysed in different orientations and can be used for automatic recognition of different types of pathological detection like ventricular hypertrophy. Finally, this work has implications for understanding the physiological status of ventricles in diagnosing cardiovascular diseases using noninvasive imaging technology.
References
- Bleumink GS, Knetsch AM, Sturkenboom MC, Straus SM, Hofman A, Deckers JW, Witteman JC, Stricker BH. Quantifying the heart failure epidemic: Prevalence, incidence rate, lifetime risk and prognosis of heart failure–the rotterdam study. Eur Heart J 2004; 25:1614-1619.
- Bosch JG, Nijland F, Mitchell SC, Lelieveldt BP, Kamp O, Reiber JH, Sonka M. Computer-aided diagnosis via model-based shape analysis: Automated classification of wall motion abnormalities in echocardiograms. Acad Radiol 2005; 12: 358-367.
- Leung KY, Bosch JG. Localized shape variations for classifying wall motion in echocardiograms. Med Image Comput Comput Assist Interv 2007; 10: 52-59.
- Mansor S, Hughes NP, Noble JA. Local wall motion classification of stress echocardiography using a hidden Markov model approach. Int Symp Biomed Imag 2008; 1295–1298.
- Qian Z, Liu Q, Metaxas DN, Axel L. Identifying regional cardiac abnormalities from myocardial strains using spatio-temporal tensor analysis. IEEE Trans Med Imaging 2011; 30: 2017-2029.
- Lu Y, Radau P, Connelly K, Dick A, Wright G. Pattern recognition of abnormal left ventricle wall motion in cardiac MR. Med Image Comput Comput Assist Interv 2009; 12: 750-758.
- Jiang K, Yu X. Quantification of regional myocardial wall motion by cardiovascular magnetic resonance. Quant Imaging Med Surg 2014; 4: 345–357.
- Wael M, Ibrahim ESH, Fahmy AS. Detection of cardiac function abnormality from MRI images using normalized wall thickness temporal patterns. Int J Biomed Imaging 2016; 1-6.
- Bruurmijn LM, Kause HB, Filatova OG, Duits R, Fuster A, Florack L M, Assen HC. Myocardial deformation from local frequency estimation in tagging MRI. Functional Imaging and Modeling of the Heart 2013; pp 284-291.
- Qian Z, Liu Q, Metaxas DN, Axel L. Identifying regional cardiac abnormalities from myocardial strains using nontracking-based strain estimation and spatio-temporal tensor analysis. IEEE Trans Med Imaging 2011; 30: 2017-2029.
- Sundar H, Davatzikos C , Biros G. Biomechanically-constrained 4D estimation of myocardial motion. Med Image Comput Comput Assist Interv 2009; 12: 257-265.
- Punithakumar K, Li S, Ayed IB, Ross I, Islam A, Chong J. Heart motion abnormality detection via an information measure and bayesian filtering. Med Image Comput Comput Assist Interv 2009; 5762: 373–380.
- Cerqueira MD, Weissman NJ, Dilsizian V, Jacobs AK, Kaul S, Laskey WK, Pennell DJ, Rumberger JA, Ryan T, Verani M. Standardized myocardial segmentation and nomenclature for tomographic imaging of the heart: A statement for healthcare professionals from the cardiac imaging committee of the council on clinical cardiology of the American Heart Association Circulation 2002; 105: 539–542.
- Punithakumar K, Ayed IB, Islam A, Ross IG, Li S. Regional heart motion abnormality detection via information measures and unscented Kalman filtering. Med Image Comput Comput Assist Interv 2010; 6361: 409–417.
- Afshin M, Ayed IB, Punithakumar K, Law M, Islam A, Goela A, Li S. Regional assessment of cardiac left ventricular myocardial function via MRI statistical features. IEEE Trans Med Imaging 2014; 33: 481-494.
- Suinesiaputra A, Frangi A, Kaandorp T, Lamb H, Bax J, Reiber J, Lelieveldt B. Automated detection of regional wall motion abnormalities based on a statistical model applied to multi slice short-axis cardiac MR images. IEEE Trans Med Imag 2009; 28:595–607.
- Suinesiaputra A, Frangi AF, Kaandorp TA, Lamb HJ, Bax JJ, Reiber JH, Lelieveldt BP. Automated regional wall motion abnormality detection by combining rest and stress cardiac MRI: Correlation with contrast-enhanced MRI. J Magn Reson Imag 2011; 34: 270–278.
- Lekadir K, Keenan N, Pennell D, Yang G. An inter-landmark approach to 4-d shape extraction and interpretation: Application to myocardial motion assessment in MRI. IEEE Trans Med Imag 2011; 30: 52–68.
- Lu Y, Radau P, Connelly K, Dick A, Wright G. Pattern recognition of abnormal left ventricle wall motion in cardiac MR. Med Image Comput Comput Assist Interv 2009; 12: 750-758.
- Barnes JG, Gil D, Badiella L, Sabate AH, Carreras F, Pujades S, Marti E. A normalized framework for the design of feature spaces assessing the left ventricular function. IEEE Trans Med Imag 2010; 29: 733–745.
- Petitjean A, Dacher JN. A review of segmentation methods in short axis cardiac MR images. Med Image Anal 2011; 15: 169–184.
- Buckberg GD, Weisfeldt ML, Ballester M, Beyar R, Burkhoff D, Coghlan HC, Ingels NB. Left ventricular form and function scientific priorities and strategic planning for development of new views of disease. Circulation 2004; 110: 333-336.
- Chan TF, Vese LA. Active contours without edges. IEEE Trans Med Imaging 2001; 10: 266-277.
- Kumar HP, Srinivasan S. Segmentation of polycystic ovary in ultrasound images. 2nd International Conference on Current Trends in Engineering and Technology (ICCTET) 2014; pp 237-240.
- Goldstein T, Bresson X, Osher S. Geometric applications of the split Bregman method: segmentation and surface reconstruction. Journal of Scientific Computing 2010; 45: 272-293.
- Azencott R, Wang JP, Younes L. Texture classification using windowed Fourier filters. IEEE Trans Pattern Anal Mach Intell 1997; 19: 148-153.
- Wiskott L, Fellous JM, Krüger N, Malsburg VD. Face recognition and gender determination. 1995; pp 92-97.
- Wu Q, Gan Y, Lin B, Zhang Q, Chang H. An active contour model based on fused texture features for image segmentation. Neuro computing 2015; 51: 1133-1141.
- Pieciak T. Segmentation of the left ventricle using active contour method with gradient vector flow forces in short-axis MRI. In: Information Technologies in Biomedicine 2012; pp 24-35.
- Pruessmann KP, Weiger M, Boesiger P. Sensitivity encoded cardiac MRI. J Cardiovasc Magn Reson 2001; 3: 1-9.