Research Article - Biomedical Research (2017) Volume 28, Issue 10
Image processing methods for computer-aided interpretation of cell lines for cancer studies
Sreejith L Das1*, Alamelu Nachiappan2, Narendrakumar G3, Karthikeyan J4 and CP Anitha Devi5
1Department of Electronics Engineering, Sathyabama University, Chennai, India
2Department of Electrical and Electronics Engineering, Pondicherry Engineering College, Puducherry, India
3Department of Biotechnology, Sathyabama University, Chennai, India
4Department of Chemistry, Sathyabama University, Chennai, India
5Department of Zoology, NSS Hindu College, Changanassery, Kerala, India
- *Corresponding Author:
- Sreejith L Das
Department of Electronics Engineering
Sathyabama University, India
Accepted date: January 24, 2017
Abstract
This paper proposes computer based automated cancer cell line classification. The burden of manual labeling can be alleviated using the proposed method and will be a help for cancer research. The aim is to study the impact of metal complexes on cancer cell lines. In combination with thiosemicarbazone to form methyl, ethyl, phenyl groups were used for the study. Cultured Hep G2 cell lines are treated with Thiosemicarbazone metal complexes and the corresponding cell line structure variations were analysed. The synthesised cell line images are pre processed using a Hybrid Switching Filter. The filter denoises speckle noise which affects during image acquisition because of the faulty switching elements or poor lighting conditions. The filter makes use of a hybrid approach using linear and nonlinear concepts. These denoised images are segmented using boundary detectors. Canny’s algorithm is used for detecting the edges which makes use of abrupt pixel value variations. On analysing the factors such as time consumption, cost effectiveness and accuracy, this method can be used as a reliable decision maker in place of costly short tandem repeat (STR) analysis for laboratory studies.
Keywords
Thiosemicarbazones, HepG2, Ruthenium, Digital image processing, Canny’s algorithm.
Introduction
Cancer is caused by abnormal cell growth with potential to spread to other body parts. In 2015, there were around 8 million cancer-related deaths and 16 million new cases worldwide. Based on the cell types, over 200 different types of cancer have been classified. They do not undergo programmed cell death and this leads to a mass of uncontrolled abnormal cells [1]. Cancer treatment depends on the type, the stage, age, health status and personal characteristics [2]. Proper drug design is the better method for treating this dangerous disease. Drug designing is the process of finding new medications based on the knowledge of a biological target. According to [3] the drug is mostly an organic small molecule that can activate or inhibits the biomolecule’s function, which in turn results in a therapeutic benefit to the patient. Ligand-based drug design depends on the information of molecules that bind to the target. It is used to derive a pharmacophore model, the structural features a molecule must have in order to bind the target. A quantitative structure-activity relationship (QSAR), predicts the activity of new analogs. The study was carried out to synthesis; characterize thiosemicarbazone (TSC) and its complex with metal Ruthenium to explore its anticancer properties [4]. Thiosemicarbazones (TSC) belong to a group of thiourea derivatives which are derivatives of parent aldehydes or ketones. In the solid state, these TSCs exist in the thione form. In solution, however, they are known to tautomerize into the thiol form. TSCs and their metal complexes have gained considerable interest in coordination chemistry because of their versatile ligand properties and broad profile in biological activities [1,5]. The broad spectrum of medicinal properties of this class of compounds and its activity against tuberculosis, psoriasis, rheumatism, leprosy, trypanosomiasis and coccidiosis has been studied. Triapine® (3-aminopyridine-2- carboxaldehyde TSC) has been developed at present as an anticancer drug and it has reached clinical phase II on several cancer types [6].
Thiosemicarbazone’s Metal Complexes
Many metals lose electrons from the metallic state to form positively charged ions which are soluble in biological fluids [7]. Under physiologically relevant conditions, Ruthenium can access a range of oxidation states (II, III and IV) and the energy barrier to inter conversion between those oxidation states is relatively low. This allows ready the changes in oxidation state when it is inside the cell. Ruthenium complexes display slow ligand exchange rates, if a Ruthenium ion binds to anything in the cell, it remains bound for the remainder of that cell’s lifetime [8]. The structure of Ruthenium thiosemicarbazone complex is shown in Figure 1.

Figure 1: Structure of Ruthenium thiosemicarbazone complex.
As a drug, Ruthenium complexes have fewer side effects because of higher effective nuclear charge [9]. The morphological changes in cancer cells undergoing biochemical reactions upon treating with agents that stimulate cellular responses can be analyzed easily using the automated biomedical image analysis [10], it is an emerging field in digital medical diagnosis. The cell line images are first preprocessed [10] using a filter named as Hybrid Switching Filter [11]. This filter denoises the speckle noise by replacing the noisy pixel values with a new value. For that, a 3 × 3 mask is taken to select nine pixel values at a time. The nine values are then sorted and the mean of the middle three values are taken for replacement. This process repeats until all noisy pixels have been repaired. This denoised image is then applied to segmentation for classification. Hep G2 cell classification using automated analysis will help to improve and speed up cancer research in various areas using established cancer cell lines, an automatic morphological categorization of cancer cells will facilitate the right detection and tagging of different cell lines. Automated analysis provides a fast and easy-to-use tool than authenticating human cell lines using short tandem repeat (STR) analysis. Feature extraction, classification and automation are the three major steps should be accomplished for the above discussion. Cell line images are the input data here. The structure of these cell lines are to be considered and any change in the structure due to the impact of various chemical combinations have to be monitored. This is done by extracting various features [12] using boundary descriptors available in image segmentation. Segmentation isolates the region of interest from background. The irregularly shaped objects can be easily isolated using boundary descriptors. Consecutive points on the boundary or edges give the shape of an object. The features obtained from the images are used as input data for classification of known from unknown cell types. The flow diagram for the entire process is depicted in Figure 2. The work is based on finding the similarity between the sample image and various synthesized images. It shows that the image having minimum similarity is more influenced with the respective composition. The various parametric values help to find the similarity, which was described in the paper.

Figure 2: Block diagram of the proposed method.
Materials and Methods
Cell Culture
Hep G2: Hep G2 is a perpetual cell line that is derived from the liver tissue of a well-differentiated hepatocellular carcinoma. These cells are epithelial in morphology.
Complexes synthesised and used:
1. Complex : Ruthenium + TSC
2. Complex : Ruthenium + Methyl TSC
3. Complex : Ruthenium + Ethyl TSC
4. Complex : Ruthenium + Phenyl TSC
Synthesis of the ligands
Ligand: Methyl/Ethyl/Phenyl TSC
The Schiff base compound, p-[N, N-Bis (2-chloroethyl) aminobenzaldehyde-methyl/ethyl/phenyl TSC is synthesized at ambient temperature through the condensation of p-[N, N-Bis (2-chloroethyl) aminobenzaldehyde and ethylthiosemicarbazide in ethanol. The structural and spectral properties was studied using a yellow crystalline precipitate p- [N,N-Bis(2-chloroethyl) aminobenzaldehyde- methyl/ethyl/ phenyl TSC .
Synthesis of the Metal TSC Complexes
A mixture of Ruthenium chloride (1 mmol) and CEAB-TSC/ MTSC/ETSC/PTSC (2 mmol) in ethanol was stirred using magnetic stirrer at room temperature for 4 h, after which it was set aside, overnight when a crystalline product separated out. It was filtered, washed (cold ethanol) and dried (vacuum).
Solution making
All the TSC complexes of Ruthenium are soluble in DMSO. The strength of all the drug solutions was set up as 1 μ molar according to the molecular weight. The cell lines Hep G2 carcinoma were obtained from NCCS Pune India. The cell lines were cultured at 37°C under 5% CO2 in standard DMEM (Dulbecco’s modified Eagle’s medium enriched with 1% Nonessential amino acid, 10% Foetal Bovine Serum and 1% penicillin (GIBCO Invitrogen). Media and glassware were sterilized in an autoclave at 15 lbs pressure/inch2 for 20 min.
To evaluate the cytotoxicity test for the various Thiosemicarbazone compounds and complexes, MTT method was done. Hep G2 cells were seeded (3 × 10⁴/well) in 96-well plates in 10 μl of growth medium (MEM) containing 10% FCS mixture in each well incubate at 37°C in a 5% CO2 incubator. After 24 h of monolayer cell cultivation, the medium was removed and replaced by a 100 μl of varying concentrations (25-1000 μg/ml) of the compounds and complexes of Thiosemicarbazone polysaccharides in Minimum Essential Medium which contains 2% Foetal Calf Serum in respective wells, control cell contains MEM medium containing 2% FCS incubated at 37°C in a 5% CO2. After 72 h incubation 20 μl of MTT in (5 mg/ml) PBS solution/well were added to incubate at above condition for 4 h. Then the crystal formation was observed, the medium was replaced in each well by 100 ml of DMSO solution and its optical density was measured by using an Elisa reader at 620 nm. All experiments were carried out in triplicate. Data are presented in the form of mean ± SD.
The authentication of the cell lines were regularly checked by STR profiling. Pictures were taken with inverted Olympus CKX41 microscope using Olympus camera DP72 and with 20X objective. The descriptor features used to identify the object should carry adequate information for perfect classification. These features are extracted after applying edge detection algorithm, especially Canny algorithm. Edge detection or discontinuity based segmentation is used in this paper. The purpose of edge detection is to reduce the amount of data thereby processing time while preserving the structural properties which is needed for further processing, Canny’s edge detection algorithm comprises of various stages such as Smoothening, Finding the gradient using Sobel mask, Non maxima suppression, Double thresholding and Edge linking. These various stages of Canny’s algorithm had been accomplished by the application of inbuilt Matlab code whose syntax is given by “edge (image, ‘canny’). The parameters used for image analysis and the formulae used are listed below.
(i) Mean Squared Error (MSE):
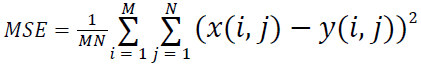 (1)
(1)
(ii) Peak Signal to Noise Ratio (PSNR):
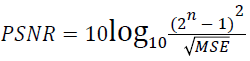 (2)
(2)
(iii) Average Difference (AD):
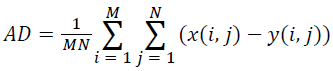 (3)
(3)
(iv) Mean Absolute Error (MAE):
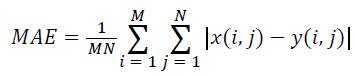 (4)
(4)
(v) Normalized Cross-Correlation (NK):
 (5)
(5)
(vi) Structural Content (SC):
 (6)
(6)
(vii) Image Fidelity (IF):
 (7)
(7)
(viii) Peak Mean Square Error (PMSE):
 (8)
(8)
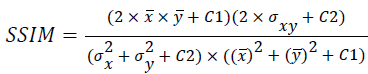
(ix) Structural Similarity Index Metric (SSIM):
 (9)
(9)
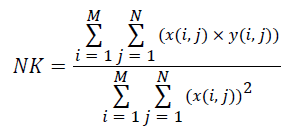
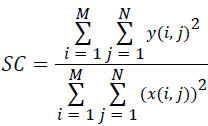
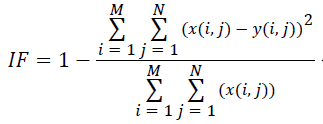
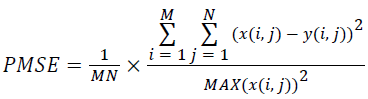
Where x(i, j) and y(i, j) represents the input image and distorted image respectively, i and j are the pixel position of the M × N image, C1 and C2 are constants, ?x and ?y are averages of x and y respectively, σ2x and σ2y are the variances of x and y, and σxy is the covariance of x and y.
Results and Discussion
The proposed automated cell line classification system for Hep G2 cell line images can aid as a second reader for the biologist and the need for time-consuming, costly and biochemical tests can be avoided. TSC metal complexes were taken for cell culture. The impact of metal complexes in biological activities is of great importance when dealing with cell structure analysis. The use of lipophilic nature of the complex than free ligand enhanced the interaction of metal ions with the organism. The metal ions act as central atom forming chelate complex. This increases biological activity. According to [16] the Ruthenium complexes having bulky terminal group exhibit higher biological activity. Therefore Phenyl group is considered as more stable and the order will be Ph>Et>Me>H. So when compared to other ligands, Phenyl TSC shows highest biological activity. D block metals shows less biological toxicity compared to others [5,8]. The ability of Ruthenium to form octahedral complexes and higher electro negativity results in stronger bonding with bio molecules gave chance to select Ru [9]. Due to the higher IC50 value of Ru as shown in Table 1, RuPTSC is showing higher biological activity.
| Name of the complexes | IC50 Values of Hep G2 cells in µ molar |
|---|---|
| RuTSC | 0.10 |
| RuMTSC | 0.31 |
| RuETSC | 0.51 |
| RuPTSC | 0.63 |
Table 1: IC50 Values of the synthesised complexes.
The synthesized metal complex cell line images are then applied to preprocessing. The hybrid switching filter denoises the images and the de noised images are then fed to Segmentation block. To extract more image details, an edge detection method is used. In this paper, Canny edge detection method is used and the resultant images are shown in Figure 3. Visual analysis of these images itself shows the superiority of this method. Similar approach was performed by [17] for Classification of the images of Human Carcinoma Cells Using Complex Wavelet-Based Covariance Descriptors. The extracted parameters are statistically arranged in Table 2. The error metrics such as MSE, AD, MAE, NK, and PMSE shows a decrease in its values from RuPTSC to RuTSC. Likewise the values of PSNR, SC, IF and SSIM increases from RuPTSC to RuTSC. The overall analysis shows that RuTSC is more and RuPTSC is less similar to the actual cell line images. This in turn proves that the impact of Ruthenium Phenyl Thiosemicarbazone complex is more on comparing with its methyl and ethyl counterparts.
| Parameters | RuPTSC | RuETSC | RuMTSC | RuTSC |
|---|---|---|---|---|
| MSE | 0.62 | 0.58 | 0.54 | 0.51 |
| PSNR | 44.41 | 47.51 | 49.76 | 52.78 |
| AD | 0.053 | 0.052 | -0.038 | -0.009 |
| MAE | 0.348 | 0.333 | 0.296 | 0.295 |
| NK | 0.250 | 0.219 | 0.155 | 0.156 |
| SC | 0.843 | 0.954 | 1.342 | 1.350 |
| IF | -0.685 | -0.609 | -0.433 | -0.428 |
| PMSE | 0.0014 | 0.0013 | 0.0012 | 0.0010 |
| SSIM | 0.435 | 0.628 | 0.694 | 0.736 |
Table 2: Parameters analyzed for various quantities of Ruthenium (Ru) complexes for 1 μ molar strength solution.

Figure 3: (a) Actual Hep G2 cell line image (c) RuTSC cell line image (e) RuMTSC cell line image (g) RuETSC cell line image (l) RuPTSC cell line image (b,d,f,h,j) corresponding segmented images.
Conclusion
The study concludes by proving the effectiveness of automated cell line structure classification for analysing the impact of metal synthesised TSC in cultured cancer cell lines. The relevance of cancer studies are there at all times because of the large increase in the number of cases. Effective drug development is still a challenging factor because of the resistance shows by certain cancers to traditional chemotherapeutics. In this contest, the development of potential anticancer complexes received considerable attention. The accuracy of obtained parameters shows the effectiveness in the selection of pre-processing and segmentation methods. The overall results show that the HSF and Canny’s algorithm exhibited better performance in its class. All the parametric output seems to be supportive to the final result. The result shows the superiority of PTSC as a ligand on comparing its ethyl and methyl counterparts.
Acknowledgment
Dr. M. Bavanilatha, Associate Professor, Biotechnology Department, Sathyabama University is highly appreciated for providing imaging devices.
References
- Kizilcikli I, Kurt YD, Akkurt B, Genel AY, Birteksoz S, Otuk G, Ulkuseven B. Synthesis, characterization and biological activity of copper and thiosemicarbazone complexes. Folia Microbiol Rev 2006; 52: 15-25.
- Karnofsky D. A Review on anticancer drugs. CA: Cancer J Clin 2008; 18: 232-234.
- Lobana TS, Kumari P, Sharma R, Castineiras A, Butcher RJ, Akitsu T, Aritake Y. Structural and spectral studies of new copper (II) with thiosemicarbazone ligand. Dalton Trans 2011.
- Vieweg J. Antimicrobial activity of the thiosemicarbazone complexes of Zn. Pd Med Rev 2007; 9: S29-S38.
- Kalaivani P, Prabhakaran R, Dallemer F, Poornima P, Vaishnavi E, Ramachandran E, Padma VV, Renganathan R, Natrajan K. Synthesis, characterization and biological activity of copper and cobalt thiosemicarbazone complexes. Metallomics 2012; 4: 101-113.
- Beckford FA, Amon Holt T. Prediction of Optical responses of Organic Compounds. J Arkansas Acad Sci 2015.
- Hemamalini K, Lavanya CH, Bhargav A, Vasireddy U. On the thermal properties of metal (II) complexes of chalcone. Asian J Pharmaceut Clin Res 2015.
- Hecht DW, Onderdonk A, Aldridge KE, Roe-Carpenter D. Synthesis, spectral characterization and catalytic studies of ruthenium chalcone thiosemicarbazone complexes. Pharmaceut Chem 2010; 34: 657-662.
- Prabhakaran R, Sivasamy R, Angayarkanni J, Huang R, Kalaivani P, Karvembu R, Dallemer F, Natarajan K. Synthesis on ruthenium chalcone thiosemicarbazone complexes. Inorganica Chimica Acta 2011; 374: 647-653.
- Nallaperumal K, Varghese J. Selective switching median filter for the removal of salt and pepper impulse noise. Proc. of IEEE WOCN 2006, Bangalore, 2006.
- Das SL, Nachiappan A. Role of hybrid switching filter in image denoising-a comparative study. Proc IEEE INDICON 2012.
- Varnan SC, Jagan A, Kaur J, Jyoti D, Rao DS. Image Quality Assessment Techniques pn Spatial Domain. Int J Comput Sci Technol 2011; 2: 177-184.
- Tiwari M. DNA, Protein binding, cytotoxocity of Palladium thiosemicarbazone complexes. Antimetabol: Established Cancer Ther 2012; 8: 510-519.
- Canny JF. A computational approach to edge detection. IEEE Trans Pattern Anal Machine Inte ll 1986; 8: 679-697.
- Kumar R, Rattan M. Analysis of Various Quality Metrics for Medical Image Processing. Int J Adv Res Comput Sci Software Eng 2012; 2: 137-144.
- Page S. Ruthenium compounds as anticancer drugs. Education Chem 2012.
- Keskin F, Suhre A, Kose K, Ersahin T, Cetin AE, Cetin-Atalay R. Image Classification of Human Carcinoma Cells Using Complex Wavelet-Based Covariance Descriptors. Plos One 2013; 8: 1-10.