Research Article - Journal of Finance and Marketing (2018) Volume 2, Issue 1
Dynamic interelationship between macroeconomic fundamentals and stock prices in Nigeria
Ditimi A*, Sunday K, Emma-Ebere, Onyedikachi
Department of Economics, Faculty of Social Sciences, Federal University Oye-Ekiti, Nigeria
- *Corresponding Author:
- Amassoma Ditimi
Department of Economics
Nigeria Faculty of Social Sciences
Federal University Oye-Ekiti M
Nigeria
E-mail: amassoma.dit@gmail.com
Accepted date: March 01, 2018
Citation: Ditimi A, Sunday K, Emma-Ebere, et al. Dynamic interelationship between macroeconomic fundamentals and stock prices in Nigeria. J Fin Mark. 2018;2(1):50-59.
DOI: 10.35841/finance-marketing.2.1.50-59
Visit for more related articles at Journal of Finance and MarketingAbstract
This paper investigated the dynamic interrelationship between macroeconomic fundamentals and stock prices in Nigeria using time series data spanning from 1980 to 2016. The study made use of co-integration test and the error correction mechanism. Empirical estimates revealed pointedly that there is a long run correlation between macroeconomic fundamentals and stock prices in Nigeria. Similarly, in the short run, the previous values of money supply and interest rate were found to demonstrate a significant effect on stock prices. Also, the previous value of stock market return was found to show significant influence on the current stock prices. Markedly, the results revealed that the natural logarithm of real gross domestic product is a leading indicator that stimulates stock prices in the long and short run. Based on the above findings the study recommends that the Central Bank of Nigeria should carry out prudent macroeconomic policies to derive the best from the stock market. Furthermore, the government should look into the high rate of inflation since it is one of the most significant macroeconomic indicators used to analyze the economic conditions of a country.
Keywords
Macroeconomic fundamentals, Nigeria, Stock price, Error correction mechanism, Interest rate.
Introduction
The insinuation that the activities of the stock market are influenced by macroeconomic fundamentals is a well debated subject in the literature among academics, investors and financial market regulators since the post-sap period in Nigeria. As a matter fact, researchers have made some conscious effort to theoretically and empirically decide this correlation in the last decades. For instance, authors among others investigated the relation between asset prices and macroeconomic fundamentals which include interest rate, money supply, inflation, oil price, industrial production index, exchange rate to mention a few [1]. Typically, the reason why policy makers and government agencies have shown interest in this area of study is basically because the stock market plays a highflying role in the macroeconomic development of a country. Theoretically, the assertion that macroeconomic variables show a significant influence on stock prices/returns in any economy cannot be undermined [2] have equally investigated this relationship. And more recently, studies [3] confirmed that there exists a correlation between macroeconomic fundamentals and stock market returns. Nevertheless, techniques, signs and causal factors in these studies may not be the same. This may be attributed to the differences in approaches ranging from multivariate, vector auto-regressive (VAR), vector error correction model (VECM), causality test, scope and possibly the aims of each study. In Nigeria, particularly, different authors have sought to investigate the nexus between macroeconomic indicators and stock return; worrisomely, their findings were with mixed feelings both in the short-term and long-term. Interestingly, the study [4- 7] purported that stock returns often depicts a hedge against macroeconomic variables in the sense that it makes investors to be fully compensated due to increase in the general price level vis-à-vis a corresponding rise in nominal stock market returns thereby making the real returns to be constant. To buttress the aforementioned, studies by Mohammad [8] found a positive relationship between macroeconomic fundamentals and stock returns, among others. However, this assertion can first be credited to certain researchers. In addition, few other evidences about the above relationship in Nigeria show that macroeconomic variables exert positive correlation with stock market returns and these studies include Ahmad et al. [9], Alatiqi and Fazel [10], Bhattacharya and Mookherjee [11] and Doong et al. [12]. They found a negative relationship between stock prices and macroeconomic variables in Nigeria. Surprisingly, the third group of researchers is of the view that variation in stock prices cannot be predicted by changes in macroeconomic fundamentals [13,14]. Above all, these studies carried out in Nigeria and those from other parts of the world suffers from a major problem of multicollinearity and partly from causality test related issue which in turn cast doubt in the validity of their findings especially those modeled in a single equation multivariate platform [15]. The reason for the above is that, most of these studies which utilized multivariate approach put a large number of the macroeconomic variables together in one model which is theoretically proven to depict a strong correlation with each other [16]. Taking an instance of the nominal interest rate which is a sum of the real interest rate and expected inflation as buttressed which may have accounted for an exact or nearly exact linear relation among two or more explanatory variables Apart from the above issue, most of the studies in Nigeria except [17-20] have failed in the area of causality in the sense that they fail to verify the causality between ‘key and significant macroeconomic fundamentals’ and also the failure to show the direction of causality because they refused to take cognizance of the error correction term (ECT) that was obtained from the Co-integration platform. Keeping the above in view, this current study intends to consider the above shortcomings in this research by modifying our model from the usual vague multivariate analysis to a standardized multivariate one due to their observed insensitivity to the adverse effect of multi-collinearity and overlook taking the adequate steps of suppressing these problems as suggested by economic and econometric theories when evaluating the impact of these macroeconomic variables on stock market returns to make its outcome more robust and valid. Hence, the study will expunge the problem of multi-collinearity and specify Granger causality models that can account for the error correction term. This is because the importance of this current study cannot be overemphasized at this juncture, which Nigeria is currently facing some economic conditions, though technically out of recession. Firstly, the paper will contribute to empirical literature on the connection between macroeconomic fundamentals and stock returns in Nigeria. Secondly, it will seek to overcome the problem of multicollinearity and conquer the likely concern of misspecification inherent in the earlier studies. The study will also help the government in understanding the effects of their macroeconomic decisions on the stock markets. Again, the study will give a better comprehension of the relationship between macroeconomic fundamentals and stock returns in Nigeria. The rest of the paper is structured as follows [21]. The next section reviews the theoretical and empirical literature. This is followed by the methodology of the study. The second to last section is the results section. Last but not least are the conclusion and policy implications sections.
Theoretical Framework and Empirical literature
Theoretical framework
In the last four decades, many authors and researchers have been keen in exploring on the key factors that spur stock returns through the background of asset pricing models ranging from efficient market hypothesis (EMH) to arbitrage pricing theory (APT) and to capital asset pricing Model (CAPM). For instance, the efficient market hypothesis is brought about as a result of the controversy of whether government policies on macroeconomic variables and fiscal deficits can have implications on stock market returns or not; which has been a topical issue among both financial economists and policy analysts for quite some time. A financial market is described efficient when the prices of traded assets tend to be reflecting already known information about the market. Consequently, the market becomes unbiased due to the fact that they represent the collective beliefs of all investors with respect to future capital. In short, EMH believes that stock price can be triggered by some major factors such as dividend per share, size of the firm and dividend yield and earnings per share as buttressed [22,23]. Particularly, it is worthwhile to note that, the EMH is mainly attributed to the principle of asymmetric information. Therefore, the emphasis is that it is not all shareholders that have access to stock market information at the same time. Ordinarily, authors like [24] and so on are of the view that the source of asymmetric information to the managers has brought about the firm’s prospects because investors in the firm comprise the un-informed group. In view of this, the arbitrage pricing theory became more popular. The APT is a multifaceted model which emphasizes the assumption that many macroeconomic factors including; the consumer price index, interest rate, industrial production among others are involved in the determination of risk and return relationship respectively. Furthermore, the APT is of the view that, any new information about the above mentioned macroeconomic fundamentals may spur the stock price/return through a transmission mechanism of the expected dividends, the interest rate or by both as opined [25]. Therefore, this current research will be focused on the assumption of APT.
Review of literature and empirical evidence
The relationship between macroeconomic fundamentals and stock prices has been reviewed from divergent perspectives. However, for clarity the review of literature and empirical evidence would be from two perspectives. The first is the case of developed and developing economies. The second is the Nigerian case. This will be addressed in the following subsection.
Developed and developing economies case
As a matter of fact, many studies have been carried out on the impact of macroeconomic fundamentals on stock prices both in developed and developing countries. Of all these studies few salient ones will be reviewed here. For instance, looked at the dynamic interdependencies for inflation, real economic activity, monetary policy and stock returns, by adopting VAR model using monthly U.S. data from 1955 to 1998 and concluded that shocks due to the monetary contraction raise statistically significant changes in expected real stock returns and inflation, and that these movements are not found in opposite directions. Researchers employed a vector auto-regressions (VAR) model in their study to determine the relationship between the stock market and macro-economic variables in Japan. The results indicate that there is a relationship between the stock market and macroeconomic variables. Furthermore, the results show that causal relationship runs from the macro-economic variables to the stock market, indicating that it is economic growth which drives the stock market for Japan. In a related manner, researchers studied the relationship between financial development and economic growth in the UK by employing a vector auto regression (VAR) model [25]. They also utilized real GDP per capita as a measure of growth. They found evidence that supported the existence of a relationship between financial development and economic growth, with the direction being from financial development to economic growth. The result indicates that, contrary to what happens in the Japanese economy, financial development drives economic growth in the UK. Researchers explored the relationship between stock market volatility and macroeconomic variables using S and P 500 data for the period from 1970 to 2001 using GARCH and Chow test. The Macroeconomic fundamentals utilized were as follow; inflation, money supply, interest rate, and industrial production. They found a weak evidence of long recall in volatility once structural change is accounted for and a mixed relationship between stock market and macroeconomic instability. Meaning that, macroeconomic volatility explains the persistent dynamics in stock market volatility, while stock market volatility have effect but weak impact on both output and inflation rate. Interestingly, researcher examined the relationships between New Zealand Stock market Index and seven macroeconomic indicators such as CPI, real GDP figures, and domestic retail oil price (ROIL), from January 1990 to January 2003 employing co-integration tests and Granger causality test. The output exhibited a long run relationship between the macroeconomic variables of interest and New Zealand’s stock market index. Nevertheless, the results of the Granger causality test depicts that New Zealand’s stock market index was not a leading indicator for changes in macroeconomic variables. Contrary to the above study, Researchers investigated the effect of macroeconomic variables on stock return movements in U.S stock market using the GJR-GARCH model [26]. The study found that macroeconomic variables can affect stock return dynamics through two different channels, and the magnitude of their influences on returns and volatility is not constant. Though, the effects of the three macroeconomic variables on returns are not time-invariants but are closely related to stock market fluctuations. The study also revealed that the value of interest rate and dividend yield seems to play an important role in predicting the conditional variance. In addition, the three macroeconomic variables do not play any role in predicting transition probabilities [27].
Scientists considered the impact of several macroeconomic variables on the Dow Jones Wilshire 5000 indexes and Dow Jones sustainability, by means of a GARCH model and monthly data from 2000Q1 to 2008Q1. The results revealed that changes in returns on crude oil prices inversely affect the U.S. stock market, divergent to the changes in returns to the 10 year bond price that affects it positively. Both economic factors control the DJSI a month delay. Moreover, exchange rate instability affects negatively the returns of the U.S. nonfarm payroll and the stock market can be exemplified as a stabilizing aspect for the DJSI from the developing economies. Scientists investigated macroeconomic uncertainty and stock market volatility for South Africa using Vector Auto regression models and augmented autoregressive GARCH (ARGARCH). He finds out that stock market volatility is significantly affected by macroeconomic uncertainty, that financial crises increase the stock market volatility, and that fluctuations in exchange rates and short-term interest rates are the mainly influential variables in affecting stock market instability, whereas volatilities in gold prices, inflation and oil prices play insignificant roles in affecting stock market volatility. Furthermore, Scientists examined the correlation between macroeconomic factors and the stock market performance in Africa using panel OLS. The results confirmed a positive relationship between FDI and stock market performance and a negative relation between M2 and stock market performances in African countries. In the same vein, Scientist assessed macroeconomic factors and securities exchange returns in Ghana utilizing full information likelihood estimation strategy [28]. The outcomes uncover that there is a noteworthy connection between securities exchange returns and the three macroeconomic factors of interest that is, CPI, conversion scale and the Treasury bill rate while exchange rate and the Treasury bill rate had negative critical effect on securities exchange returns. Then again, crude oil prices do not seem to have any significant impact on stock returns.
A more recent study carried out by scientists, inspected the impact of macroeconomic indicators on Indian stock prices employing ARDL co-integration and VECM causality test. The result confirms a long run relationship among the variables. Evidently, the results suggest that economic growth, inflation and exchange rate are positively related to stock prices in India. Nevertheless, crude oil price was found to impact on the stock prices in India. In addition, the causality test depicts that a unidirectional causality runs from economic growth and FDI to stock prices in India both in the short and long run on the nexus of macroeconomic factors on stock market in Egypt using panel OLS method. The results revealed that there is a causal relationship between market index and CPI, exchange rate, M2 and interest rate. The same goes for Tunisia except CPI which had no causal relationship with the market index. Furthermore, the results revealed that the four macroeconomic variables co-integrated with the stock market in both countries. However, the causality test results show that there is a bidirectional causal relationship between exchange rate, M2, and EGX 30 and from EGX 30 to M2. Furthermore, causality was found to run from the interest rate to EGX 30, i.e., from interest rate to EGX 30.
In the same vein, Scientists examined macroeconomic variable impact on stock market performance in Pakistan both in the short and long run using Co-integration test and Granger causality test. The results indicated a long run link between stock market index and the CPI, M2, oil prices. More so, a long run negative relationship was found between stock returns and exchange rate, foreign reserves, gold prices and the interest rate. Surprisingly, the Granger causality results show that causality runs from the exchange rate to Index to FDI, foreign exchange reserve, interest rate and exports, although bidirectional causality was found between [28] crude oil price and stock market index in Pakistan. Scientists investigated a selected macroeconomic indicators and their influence on the domestic stock market in an upcoming market by means of quarterly data which ranged from 1998 to 2012. The selected macroeconomic variables were 10 years US government bond yield, long and short term interest rates, gross domestic product, money supply, diamond price index, inflation, exchange rate, and foreign reserves, and US share price index. They utilized vector error correction and disclosed that the stock price and macroeconomic variables are co-integrated; thus long run equilibrium relationships existed between them. Their study buttressed the study of Scientists examined the effects of macroeconomic variables on the Southeast Asian stock market by using vector autocorrelation (VAR) model and generalized autoregressive conditional heteroskedasticity model (GARCH-M) for the period 1988-1998. The macroeconomic variables used were real gross domestic product, inflation, interest rate, and money supply. The results showed positive relationships between stock returns in the four studied countries. Nevertheless, the study indicated that although Indonesia’s monthly stock return apparently was affected by Malaysia's previous monthly stock return, for the remaining countries there was no effect of the previous monthly stock return of one country on the other countries’ monthly stock returns or on its own subsequent monthly stock return. In addition, the study found that in terms of volatility, the macroeconomic variables contributed to the stock return only in Indonesia which was later emphasized scientists [29].
The Nigerian case
The interaction between macroeconomic fundamentals and stock returns have been variously studied and disputed across the globe including Nigeria. In Nigeria several academics and researchers have investigated this relationship based on the theoretical models such as dividend discount Models, pricing of assets Model which comprises of the CAPM and the APT documented in both past and contemporary empirical studies. Researchers investigated macroeconomic variables and stock market prices in Nigeria with OLS and vector error correction method (VECM). Their result indicates that Nigerian stock prices have a long run relationship with macroeconomic variables. Particularly, GDP was found to exhibit a long term negative effect on stock prices which are contrary to a priori expectation that GDP has a significant effect on stock prices. Expectedly, money supply has a significant long run positive relation with stock prices although; the causality test shows that a unidirectional causality runs from stock prices to GDP. Shockingly, their study could not find evidence of causality between money supply and stock prices which further imply that the prediction of stock prices based on macroeconomic fundamentals is difficult [30]. In the same vein, Researchers studied the impact of some selected macroeconomic variables on stock market returns in Nigeria employing OLS technique. The results indicate that the level of GDP over the years has had significant positive impact on stock market returns. Also from the results, it was shown that monetary policy variables exert a negative impact on stock market returns in Nigeria. Meaning that, a decrease in interest rate and M2 will foster stock market returns both in the long and short run. In support of the Researchers evaluated the impact of macroeconomic indicators on stock prices in Nigeria using panel regression method. The findings revealed that macroeconomic variables have varying significant impact on stock prices of individual firms in Nigeria. Furthermore, the results stressed that apart from the inflation rate and M2, all the other macroeconomic variables utilized were found to have significant relationship with stock prices in Nigeria [31-33].
Researchers examined macroeconomic variables and share prices movements in Nigerian Brewery applying multiple regression and Granger causality approach. The results show a positive but insignificant relationship between share prices and inflation, GDP and exchange rate. While a negative and insignificant relation was found between share price and interest rate which are consistent with a-priori expectations. In addition, the study was unable to confirm the short run causality between macroeconomic variables and share prices. Similarly but surprisingly Researchers considered the effect of macroeconomic factors on the Nigerian stock market returns using a panel of OLS. The results show that there is no significant relationship between the macroeconomic factors of interest and stock returns in Nigeria. Sequel to the above, Researchers explored the empirical analysis of the relationship between stock market returns and macroeconomic indicators in Nigeria employing co-integration test. The ECM results indicated a negative relationship between exchange rate and stock market returns in the short run. It further pinpointed a positive correlation between credit to private sector and stock market returns in the short run [34].
In contrast, Researchers examined macroeconomic factors and stock market performance in Nigeria using the ordinary least square (OLS) method. The results show that a combination of GDP, money supply, interest rate, inflation rate and the exchange rate could not be used to predict the performance of the stock market in Nigeria. To corroborate the study researchers investigated an econometric analysis of the impact of macroeconomic variables on stock market movement in Nigeria using Co-integration and ECM approach. The results revealed that there is a weak relationship between ASP and macroeconomic variables in Nigeria. Furthermore, their results show that there is a long run linear relationship between ASP within the period under study. Using a similar but different approach, Researchers scrutinized stock prices, stock market operations and Nigerian economic growth using Granger causality approach. The results reveal that stock prices adjust to variations in the interest rate, inflation, exchange rate, M2, GDP, market capitalization and volume of transaction of the Nigerian stock exchange. More recently, researchers looked into the impact of macroeconomic indicators on stock market performance in Nigeria using VAR and Granger causality approach. The results suggest that the response of ASI to one standard deviation (SD) in the interest rate, inflation and RGDP was all fluctuating whereas its response to one SD in exchange rate and industrial production index was relatively stable over time [35]. Researchers examined the impact of domestic macroeconomic variables on the Nigerian stock market returns employing GARCH-Model. Evidence, from the results showed that the index of manufacturing output, inflation rate, and the interest rate exerted significant strong effect on stock return. Particularly, it was discovered that Inflation and government expenditure have a significant positive impact while industrial manufacturing output and the interest rate have negative significance influence on stock return in Nigeria. Money supply and foreign exchange rate exerted no significant influence. Researchers examined the relationship between macroeconomic variables and the stock market index in Nigeria using the VAR model. They found that macroeconomic variables of interest had a significant influence on the stock market in Nigeria. In addition, scientists explored on stock market volatility and macroeconomic variables volatility in Nigeria utilizing exponential generalized autoregressive conditional heteroskedasticity (EGARCH) and lag-augmented VAR (LA-VAR) models. The results found bi-causal relationship between stock market volatility and real gross domestic product, and causal relationship between stock market volatility and the volatility of interest rate and exchange rate. The macroeconomic variables used were real gross domestic product, consumer price index, the inflation rate, short-term interest rate and the stock market for the period 1986 to 2010 [36]. In the same vein, Researchers studied the shock of the stock market returns on foreign portfolio investment in Nigeria employing Granger causality test and multiple linear regression analysis. The results revealed that foreign portfolio investment has a positive and significant shock on the stock market returns whereas the inflation rate has a positive but insignificant shock on stock returns. Furthermore, the result of the causality test confirmed that there is a unidirectional causality which runs from stock returns to foreign portfolio investment in the economy, which in turn will promote stock returns in Nigeria. In addition, researchers explored the longrun dynamic relationships between inflation and stock returns in Nigeria using monthly data from January 1997 to 2010. They utilized the Autoregressive Distributed Lag (ARDL) bound test that there is a long-run relationship between inflation and stock returns. Accordingly, Researchers examined the long-run and short-run macroeconomic shocks effect on the Nigerian capital markets between 1984 and 2007 Using Error Correction Model (ECM). The empirical results showed that NSE All -share Index response more to changes in the money supply, inflation rate, exchange rate, and real output. Moreover, all the variables utilized served as proxy for external shocks which has correspondingly exhibited a significant impact on the Nigerian capital market in the long and short-run respectively. The message resulting from previous studies reviewed above, both in developing and developed economies, are clear. The macroeconomic fundamental is still very vital and that it has a degree of influence in explaining stock returns. Therefore, there is still room for further research which would take all these into consideration like this current one among others. Owing to the above, this current study intends to investigate the dynamic interrelationship between macroeconomic fundamentals and stock returns in Nigeria. The study also seeks to establish the direction of causality between the variables under study [37,38].
Data and Methods
Sources of data
For the purpose of investigating the dynamic interrelationship between macroeconomic fundamentals and stock prices in Nigeria, this study will utilize annual time series data spanning from 1970-2015. The data employed were all sourced from the Central Bank of Nigeria (CBN) Statistical Bulletin and National Bureau of Statistics database respectively. This data include: market capitalization, consumer price index, lending rate, foreign direct investment, exchange rate and money supply. The choice of the above macroeconomic fundamentals is as a result of the fact that they are commonly used in the previous studies with the exception of money market rate that is used to proxy the commonly used real interest rate. The reason for this is to minimize the problem of multicollinearity detected in the process of empirical review where authors often combine real interest rate and inflation rate in a multivariate model. Knowing quite well that the variables are linearly related, hence resulting to a near exact multicollinearity.
Model specification
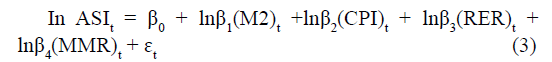
The model for this study is specified below. We start by specifying the functional form as seen in equation (1).

Where SMC represents the stock market capitalization, M2 is the money supply, RER is real exchange rate, MMR is money market rate proxy by lending rate represents lending rate and ? is the error term.
To avoid the general issue of multicollinearity observed in most of the previous studies carried out in Nigeria and other developing economies, this study intends to transform all the variables of interest as a measure of reducing multicollinearity problem and other violations that may want to occur in the process of empirical analysis of the variables. Another reason for log-log transformation of the variables is to ensure a better fit to find estimates of elasticity rather than slope hence, making the variables to appear more symmetric as opined by researchers.
Econometric estimation strategies
The study will begin with some preliminary analysis. This includes descriptive statistics, unit root test and cointegration test. After which the study moves to the main empirical analysis which include error correction modelling and Granger causality test. The descriptive statistics is employed to know the statistical properties of the variables employed. The unit root and co-integration test will be used to verify the time series properties of the variables of interest and to ascertain the long run linear relationship among the variables of interest. To verify the Stationary of the variables utilized the study employs the Augmented Dickey-Fuller (ADF) test. Here, it is assumed that the null hypothesis is H0:δ=0 which implies that the series contains a unit root and, consequently, a lag length will be chosen based on the Akanke Information Criterion (AIC) as suggested by researchers. Second, this study employs the co-integration test proposed by researchers to check for long run linear relationship among the variables. Similarly, the null hypothesis of no cointegration among the variables in equation (3) specified thus: H0: β1= β2= β3= β4=0 against the alternative hypothesis H1:β1≠ β2≠ β3≠ β4≠0. Accordingly, if the results show the existence of co-integration, then we can proceed to estimate the error correction model according to researchers. Therefore, the need for disequilibrium in the short run necessitate the use of the Dynamic Error Correction mechanism (ECM) in this study, so that one can treat the error term from eqn (3) as the equilibrium error which can then be used to tie the short run behaviour of the dependent variable to its long run value. Thus, the ECM model of this study is presented as follows:
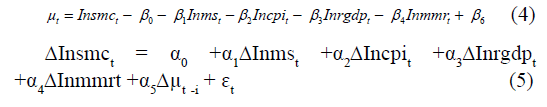
Where; ?t is the white noise disturbance and μt-i is the lagged value of the error term in the previous model when the error term is non-zero, meaning that the model is in disequilibrium. More so, the value of α5 shows how fast the equilibrium converges. To achieve the study objective of causality, it intends to use the Granger causality test to ascertain the direction of causality between macroeconomic fundamentals and stock prices in Nigeria. The Granger causality for this study is expressed as follows:

Where; ‘In’ denotes natural logarithm, p is the maximum lag length, μ1t, stochastic error terms (normally distributed with zero mean and constant variance).
Variable measurements
Data used in this paper are annual figures which spans from 1970 to 2016 and include: consumer price index (headline consumer price index), money supply (narrow money), real exchange rate, domestic oil price, output proxy by real GDP, and monetary policy rate respectively are sourced from National Bureau of Statistics and Central Bank of Nigeria statistics bulletin (2016). All of which were measured in naira except the rates. CPI was used to proxy inflation due to the fact that quantity theory of money, though accepted, but criticized on the ground that there are different drivers of prices in an economy. Gross domestic product was used to proxy for output, while the volatile nature of the Naira (Nigeria’s currency) to dollar exchange rate serves as the real exchange rate, monetary policy rate was used to proxy money market rate. Lastly, the money supply data is proxy by narrow money and is in billions of naira.
Results and Discussion
In an attempt to investigate the dynamic link between macroeconomic fundamentals and stock market prices in Nigeria, the section begins by conducting some preliminary analysis (descriptive statistics, unit root test and cointegration test) on the variables employed in the study. The result is presented in Tables 1-3 below.
Preliminary analysis
Descriptive statistics establish the unique features of the data used. For instance, in Table 1, the average mean and median value of LRGDP (15.13369), i.e., real gross domestic product is the highest among others (i.e., LASI=8.029575, LCPI=2.578448, LMS=13.69689, LMMR=2.490246) respectively. Table 1, also confirms that 19.31790 is the maximum and -0.891598 the minimum. It is obvious that LMS (3.165271) is highly volatile with the highest standard deviation. Similarly, the values of skewness and kurtosis were also computed for 37 observations. Results exhibit that all variables are negatively skewed except the value of LMS (0.475323) which is positive thereby implying that they are left long tail. Evidence from the Jarque-Bera (JB) test indicates that all variables utilized in the model are normally distributed. More so, that the variables are first differenced and computed by the ratio relative to prior observation (Table 1).
| LASI | LCPI | LMMR | LMS | LRGDP | |
|---|---|---|---|---|---|
| Mean | 8.029575 | 2.578448 | 2.490246 | 13.69689 | 15.13369 |
| Median | 8.770361 | 3.265759 | 2.564949 | 13.17237 | 15.33917 |
| Maximum | 10.96803 | 5.364105 | 3.258097 | 19.31790 | 18.43547 |
| Minimum | 3.754199 | -0.891598 | 1.791759 | 9.622450 | 10.35923 |
| Std. Dev. | 2.350162 | 2.032193 | 0.337999 | 3.165271 | 2.381882 |
| Skewness | -0.521363 | -0.397800 | -0.328914 | 0.475323 | -0.192270 |
| Kurtosis | 1.774796 | 1.670577 | 2.915326 | 2.040909 | 1.732560 |
| Jarque-Bera | 3.990456 | 3.700534 | 0.678188 | 2.811359 | 2.704509 |
| Probability | 0.135983 | 0.157195 | 0.712415 | 0.245200 | 0.258656 |
| Sum | 297.0943 | 95.40256 | 92.13909 | 506.7849 | 559.9463 |
| Sum Sq. Dev. | 198.8375 | 148.6731 | 4.112758 | 360.6818 | 204.2410 |
| Observations | 37 | 37 | 37 | 37 | 37 |
Table 1. Descriptive Statistics of Variables in the Study Model.
Unit root test
To perform the unit root test, the researchers employed both Augmented Dickey Fuller and Philip Perron test. To achieve this, a null hypothesis that the variables have a unit root was set. Expectedly, after performing the test, it was discovered based on the p-Value and t-statistics that the null hypothesis of a unit root was not rejected. Meaning that all the variables of interest are not stationary at the level. But after taking the first difference of these variables, they now became stationary both in (ADF and PP) test as presented in Table 2. Since the variables are stationary at first differencing. We proceed to test the existence of a long run relationship among the variables. The result of the Johansen co-integration test is shown in Table 3.
| Variable | AT Level | AT first differenced | ||||||
|---|---|---|---|---|---|---|---|---|
| ADF-t stat | PP-t stat | CV at 5% | Decision | ADF-t stat | PP-t stat | CV at 5% | Decision | |
| LASI | -0.418736 | -0.570796 | - 3.540328 | NS | -4.963707 | -4.830449 | -3.548490 | S |
| LCPI | -1.210060 | -0.909106 | - 3.540328 | NS | -3.751465 | -3.764873 | -3.548490 | S |
| LMS | -2.266219 | -2.266219 | - 3.540328 | NS | -6.568737 | -6.616284 | -3.548490 | S |
| LMMR | -2.633797 | -2.521490 | - 3.540328 | NS | -6.953778 | -7.075747 | -3.548490 | S |
| LRGDP | -3.232062 | -3.210227 | - 3.540328 | NS | -12.37272 | -9.454012 | -3.548490 | S |
Table 2. Result of Unit Root Test.
| Trace Test | Maximum Eigen Value Test | ||||||
|---|---|---|---|---|---|---|---|
| Null | Alternative | Statistics | 95% Critical Values | Null | Alternative | Statistics | 95% Critical Values |
| r = 0 | r = 1 | 243.3467 | 69.81889 | r = 0 | r = 1 | 148.0700 | 33.87687 |
| r = 1 | r = 2 | 95.27672 | 47.85613 | r = 1 | r = 2 | 64.92625 | 27.58434 |
| r = 2 | r = 3 | 30.35046 | 29.79707 | r = 2 | r = 3 | 16.32633 | 21.13162 |
| r = 3 | r = 4 | 14.02413 | 15.49471 | r = 3 | r = 4 | 10.19682 | 14.26460 |
| r = 4 | r = 5 | 3.827310 | 3.841466 | r = 4 | r = 5 | 3.827310 | 3.841466 |
Table 3: Result of Johansen Co-integration Test.
Johansen co-integration test
Co-integration is a crucial test for the existence of long relationship among variables. As a matter of fact, this procedure depends largely on the relationship between the rank of a matrix and its characteristic roots as buttressed by Johansen [20]. The result of the co-integration test is reported in Table 3.
From the above table, it was observed that, the null hypothesis of no co-integration for r=0, r ≤ 1, r ≤ 2, r ≤ 3 and r ≤ 4 was rejected by the trace statistics method, although the null hypothesis r ≤ 2, r ≤ 3 and r ≤ 4 were accepted by the maximum Eigen values statistics due to the fact that their statistical value was less than their critical values. The implication is that there is a long run relationship among the variables with 3 co-integrating equations at 5% level of significance in the model.
Empirical Analysis
Ordinary least square results
The result of the long run estimate clearly proves that the coefficient of LCPI and LRGDP was positively related to All Share Index (ASI). It was equally discovered that both of the variables are statistically significant to ASI at 5% level. On the other hand, money supply has a negative and statistically significant relationship with All Share Index although this supported the study by researchers in Japan. In contrast, the value of money market rate was identified as exerting a positive relationship but insignificant with ASI.
Error correction model
Co-integration and non-spurious regression are the fundamental requirements of ECM. Consequently, the results of co-integration test in Table 3 and non-spurious regression in Table 4 provide enough evidence of the long run relationship among the variables under consideration as there are three co-integrating vectors. In addition, the residuals of the long run estimate were found to be stationary at level, hence the justification to estimate ECM. The result is presented in Table 4.
| Variable | Coefficient | Std Error | t-Statistic | Prob. |
|---|---|---|---|---|
| C | -0.137765 | 0.079014 | -1.743560 | 0.0926 |
| ECT(-1) | -0.688880 | 0.174091 | -3.957014 | 0.0005 |
| D(LASI(-1)) | 0.425813 | 0.172777 | 2.464521 | 0.0204 |
| D(LCPI(-2)) | -0.307143 | 0.322594 | -0.952105 | 0.3495 |
| D(LMS(-2)) | 0.126794 | 0.081444 | 1.556822 | 0.1312 |
| D(LRGDP(-1)) | 1.356608 | 0.419906 | 3.230740 | 0.0032 |
| D(LMMR(-2)) | 0.493852 | 0.172341 | 2.865555 | 0.0080 |
| R2 =0.61, Adj. R2=0.53 F-Stat = 7.109417, Prob. <F (0.0093), DW= 1.91 |
||||
Table 4. Results of the ADLECM.
The ECM estimate was used to capture the short run analysis as showed in Table 5. The results disclosed that the co-efficient of the error-term for the ECM model is both statistically at one percent and negative. In addition, the coefficient of the error-term (–0.6889) implies that the model corrects to its short run disequilibrium approximately 69 percent speeds of adjustments in order to return to the long run equilibrium. Furthermore, the negative sign of the error correction term indicates a move back towards equilibrium between the exogenous variables and All Share index in the study period. Despite the appropriateness of the ECM model, it was further verified by carrying out various diagnostic tests on their residuals. These tests include normality test, serial correlation LM test and Heteroskedasticity test respectively. Evidence from their results showed that the residuals of the ECM model passed the three tests based on their probability values (Appendix). In particular, the histogram used in testing for normality showed that the Jarque-Bera statistic was insignificant implying that the residual from the ECM is normally distributed. In the same vein, the null hypotheses for no serial correlation and Heteroskedasticity were both accepted as evidence from the LM test and Breusch-Pagan- Godfrey test and their corresponding probability values of the F-statistics were not statistically significant at 5% level. The results demonstrate that there are no lagged forecast variances in the conditional variance equation. In essence, it stipulates that the errors are conditionally and normally distributed thereby making it useful for inference by researchers. Evidence also showed from the CUSUM test that the ECM model is stable. Consequently, it implies that the ECM model was reasonably specified based on its statistical significance and fitness. With regards to the coefficient of individual variables, it was observed that the first lagged value of RGDP exhibited a negative influence on the current value of ASI in the short run. In contrast, the coefficient of the past values of ΔLASI (0.426) and ΔLRGDP (I.3566) were found to exhibit positive and statistically significant effect on the current value of All Share Index at 5% level. Meaning that 1%, increase in the past value of the log of All Share index and the log of RGDP with approximately 43 and 136 units respectively. This result confirms the study by researcher that the stock market return is a leading indicator of real economic activity in an economy. In the same vein, the ΔLMS (0.2368) was found to exert a negative but statistically insignificant influence on the current value of ΔASI. This outcome contradicted the study by researchers who opined that growth in money supply is a significant indicator of stock market returns. In consonance to the aforementioned, the previous two lagged values of ΔLCPI (-0.307) revealed a negative influence on the current value of ΔLASI in Nigeria. Similarly, the second lagged value ΔLMMR (0.4939) was found to exhibit a positive and significant impact on All Share Index. The implication of this is that changes in the money market rate has the tendencies to affect the stock market returns and possibly truncate the capital formation drive which in turn would further slowdown economic activity in the country as buttressed by researchers.
| Direction of causality | F- value | Observation | Probability | Decision |
|---|---|---|---|---|
| LASI LRGDP | 6.3307 | 35 | 0.0051 | Reject the null |
| LCPI LRGDP | 0.9170 | 35 | 0.0028 | Reject the null |
| LCPI LMS | 0.7726 | 35 | 0.4708 | Do not reject the null |
| LRGDP LCPI | 0.6381 | 35 | 0.5353 | Do not reject the null |
| LRGDP LMMR | 0.6293 | 35 | 0.5399 | Do not reject the null |
| LASI LCPI | 2.9820 | 35 | 0.0326 | Reject the null |
| LASI LMMR | 1.1484 | 35 | 0.3307 | Do not reject the null |
| DOP RGDP | 3.4751 | 35 | 0.0175 | Reject the null |
Table 5. The Result of Granger Causality Test.
The Granger causality test
The result of the Granger causality test as shown in Table 5 revealed that the null hypothesis of no causality was rejected at 5% level of significance. However, unidirectional causality was found to exist between LASI→LRGDP and LCPI→LRGDP. This implies that causality runs from LASI to LRGDP. Furthermore, it was equally discovered that unidirectional causality runs from LCPI to LRGDP showing that there are no feedback from LRGDP to LCPI in Nigeria. However, it was found that the null hypotheses that there is no causality between the pairs of variables were accepted (LCPI →LMS), (LASI →LCPI) and (LASI →LMMR) respectively. (Table 5).
Conclusion and Policy Recommendation
Conclusion
African nations, specifically Nigeria, have now shifted focus on the stock market, due to the inherent shock that has emanated from their over reliance on the proceeds from crude oil. Hence, the reason why focus is shifted to diversification of economy especially with the development of the financial sector via the stock market due to the role it plays in a country’s economic activities. To this end, this study investigated the dynamic nexus between macroeconomic fundamentals and stock prices in Nigeria between 1980 to 2016 using co-integration and error correction modeling. This paper suggested that there is a long run nexus between macroeconomic fundamentals and stock prices in Nigeria. Evidently, the results show that, log of RGDP, CPI and MS is a leading indicator that stimulates stock prices significantly in the long run. Interestingly in the short run, it was revealed that the second lagged value of money supply exerted a negative relationship with stock prices in Nigeria, though the finding tends to be consistent with a-priori expectation. In addition, this is because, it is believed that variations in monetary uncertainty exhibit the tendencies to adjust the stock prices premium by reflecting the additional expected prices that investors demand for assuming the risk of keeping stocks. In contrast, the study revealed that the second lagged values of the money market rate were found to exert a positive influence on All Share Index which in turn has implications for capital formation and the economy at large. This is because high interest rate has the tendencies to discourage companies and firms from borrowing to finance capital projects and thus makes this firm to resort to a less expensive means through an equally efficient equity financing thereby fostering stock market activities. Notably, the study indicated that the previous lagged value of stock prices influences the current value of stock price at 5% level of significance, thereby confirming the study stipulating that there is an association between security trading volume and past stock returns. Particularly, the second lagged value of the log of the CPI was found to exert a negative relationship with stock prices in Nigeria. This study confirms the outcome of the study of researcher’s which stipulates higher risk of future profitability, such that an increase in the prices has the potentials to increase the cost of production, reducing profitability.
Policy recommendation
Based on the aforementioned, this study recommends that the government through the CBN should ensure the implementation of prudent macroeconomic policies if the country intends to derive the best from the stock market. Furthermore, the government should look inward into the high rate of inflation since it is one of the key macroeconomic indicators used to analyze the economic conditions of a country.
References
- Ibrahim MH. Macroeconomic variables and stock prices in malaysia: an empirical analysis. Asian Econ J. 1999;13:219-231.
- Habibullah M, Baharumshah AZ. Money, output and stock prices in malaysia: an application of the cointegration tests. Int Econ J. 1996;10:121-130
- Khan WA, Javed MA, Shahzad N, et al. Impact of macroeconomics variable on the stock market index; a study from Pakistan. International Journal of Accounting and Financial Reporting. 2014;4:258.
- Osamwonyi IO, Michael CI. The impact of macroeconomic variables on the profitability of listed commercial banks in Nigeria. European Journal of Accounting Auditing and Finance Research. 2014;2:85-95.
- Nkechukwu G, Onyeagba J, Okoh J. Macroeconomic variables and stock market prices in nigeria: a co-integration and vector error correction model tests. International Journal of Science and Research. 2013;4:383-417.
- Fama EF. Efficient capital markets: a review of theory and empirical work. J Finance. 1970;25:383-417.
- Fama F, Schwert. Stock returns, real activity, inflation, and money. Am Econ Rev. 1977;71:545-565.
- Mohammad BA. Co-integration relation between macroeconomic variables and stock return: evidence from dhaka stock exchange (DSE). International Journal of Business and Commerce. 2011;1:25-38.
- Ahmad AU, Abdullah A, Abdullahi AT, et al. Muhammad. Stock Market returns and macroeconomic variables in Nigeria: testing for dynamic linkages with a structural break, scholars. Journal of Economics Business and Management. 2015;2: 816-828.
- Alatiqi S, Fazel S. Can money supply predict stock prices? J Econ Educ. 2008;2:222-227.
- Bhattacharya B, Mookherjee J. Causal relationship between and exchange rate, foreign exchange r