- Biomedical Research (2013) Volume 24, Issue 1
CYP2E1 level in peripheral lymphocytes correlates with early pathogenesis of diabetic nephropathy.
Christina G. Y, Zaini A and Othman IJeffery Cheah School of Medicine and Health Sciences, Monash University, Sunway Campus, Pesiaran Lagoon Selatan, 46150, Bandar Sunway, Selangor. Malaysia
- *Corresponding Author:
- Christina G Yap
Metabolic Medicine, Jeffery Cheah School of Medicine and Health Sciences
Monash University, Sunway Campus
Jalan Lagoon Selatan, 46150, Bandar Sunway
Selangor, Malaysia
Accepted date: October 21 2012
Abstract
Since the goal of interventions for diabetic nephropathy is to prevent the progression of the disease, new early circulating biomolecules should be identified to be used as an early diagnostic tool instead of “markers” of nephropathy in diabetes patients. Hence, it would be essential to identify the earliest possible biomolecules which could serve as an early predictor for hyperglycemia induced nephropathy. Reports have showed association of elevated CYP2E1 gene expression and protein level in peripheral lymphocytes with prolonged diabetes and chronic renal failure. Our objectives were to evaluate the correlation of lymphocyte CYP2E1 in diabetic nephropathy and to identify other early peripheral biomolecules correlating with the onset of diabetic nephropathy. This is a cross-sectional cohort study, conducted on Malaysian subjects, consisted of control (C; n=28), type 2 diabetes (D; n=50), diabetic nephropathy (DN; n=34) and nondiabetic nephropathy (NDN; n=27) cohorts. Expression of CYP2E1 gene was evaluated using real-time PCR. Peripheral biomolecules correlating with onset of DN was investigated using microarray analysis. Differential and correlation statistics were done using ANOVA on ranks test and Spearman Rank Order Correlation test respectively. P-values < 0.05 were considered significant. Lymphocyte CYP2E1 levels correlated significantly with the increments of ACR and serum creatinine, and were detectable even when ACR and serum creatinine were still within normal reference limits. Further investigations are needed to determine the applicability of CYP2E1 as well as PGK1, GPI, ENO1, TPI1, ANGPTL4, AKR1B1 and SORD as candidate early risk predictors for diabetic nephropathy.
Keywords
CYP2E1, Early predictors, Diabetic Nephropathy
Introduction
Diabetes nephropathy (DN) is the most common cause of end-stage renal disease globally, and there are evidences that nephropathy develops in some patients despite good glycemic control while a substantial proportion of patients with poor control escape DN. Strict glycemic control does not eliminate the chances of developing DN. The Diabcare-Asia project conducted in Malaysia reported that the overall national prevalence of diabetes among Malaysians aged ≥30 years is 15.2% [1] and 75-85% of all diabetes patients are Type 2 diabetes mellitus (DM) [2]. Along with this, the prevalence of nephropathy in Type 2 diabetes is 55% [3] and 51% of patients with DN progresses to end stage renal disease (ESRD) [4]. Possible factors contributing to the high prevalence rate of ESRD in Malaysia are late diagnosis of DM along with coexisting hypertension and poor control of DM. Currently available laboratory tests may not be efficient enough for early detection of DN. With this information in hand, it is apparent that diabetic nephropathy is also a growing concern in Malaysia as it is globally.
Currently, the popular determinants of the risk for DN are based on clinical markers such as family history of nephropathy and hypertension, micro albuminuria and increased creatinine clearance [5]. New biomarkers for DN have been documented, which include plasma prekallikrein levels [6], several cellular and genetic markers [5], serum proteins [7] and urinary proteins [8]. All these new biomarkers have been convincingly demonstrated as potential early markers for DN, but at which step in the pathogenesis pathway of DN these biomarkers do correlate was not mentioned. Nevertheless, micro albuminuria remains the most preferred marker of diabetic nephropathy to-date despite it being nonspecific. Also, by the time the diagnosis of micro albuminuria is initiated, many patients already have advanced renal structural changes seen on renal biopsy [9].
Cytochrome P450 2E1 (CYP2E1) is a member of the cytochrome P450 super family. CYP2E1 is primarily involved in Phase I metabolism where its major role is detoxification and bioactivation of drugs and xenobiotics [18]. Its main pathological role is associated with the free radical production which consequently contributes to cellular injury [19]. Most importantly, CYP2E1 has a unique ability to activate many xenobiotics to cellular toxic or carcinogenic products [18] and in addition, it is also capable of generating reactive oxygen species (ROS) [19]. It is apparent that the activity and expression of CYP2E1 is elevated in peripheral blood lymphocytes in diabetes chronic renal failure but not in organ confined diseases like Hepatitis C [20].
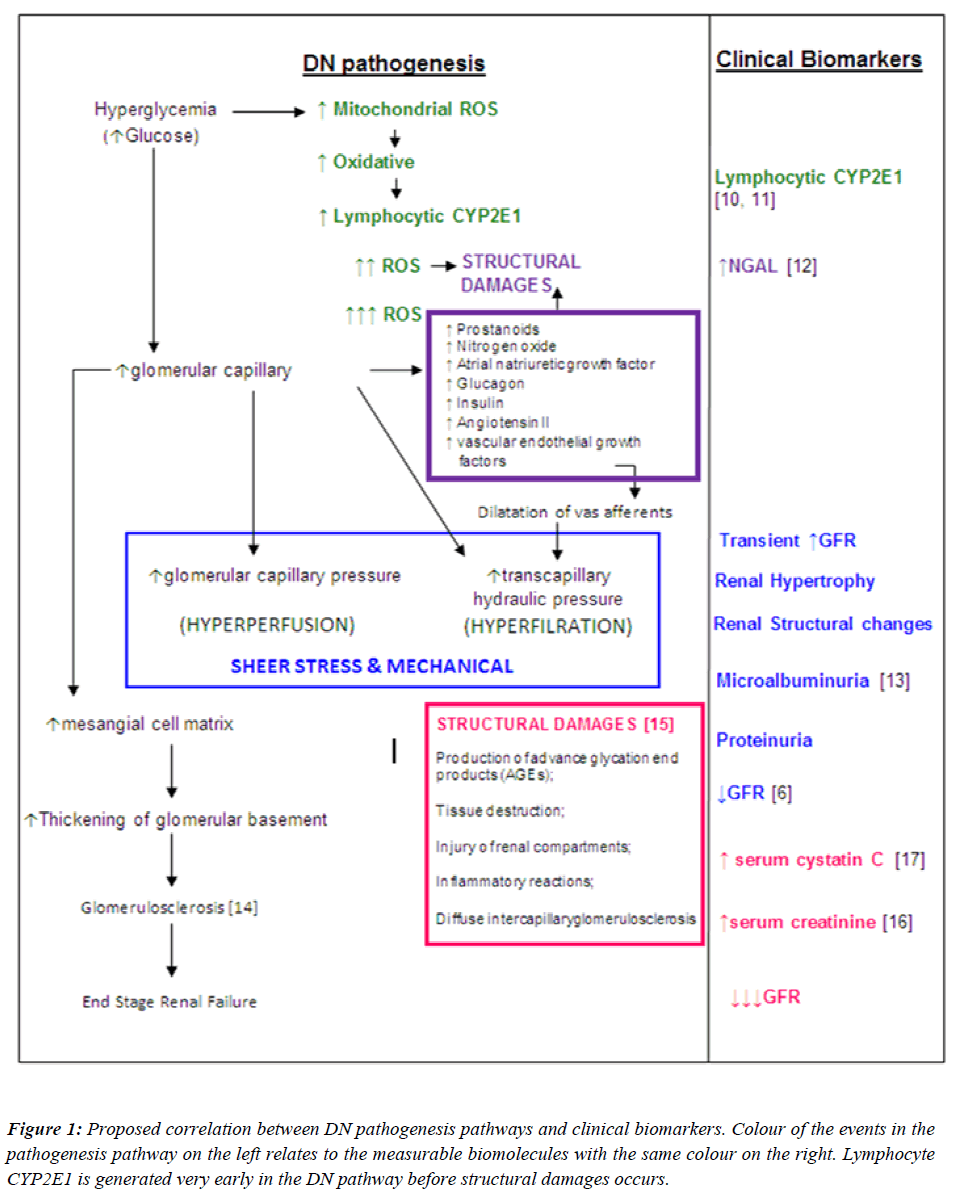
Since the goal of interventions for DN is to prevent the development or progression of the disease, an “early predictor” should be identified to be used as a diagnostic tool instead of a “marker” of nephropathy in diabetic patients. Hence, it would be essential to identify the earliest possible biomolecule in the DN pathogenesis pathway, which could serve as an early predictor for nephropathy. With this regard, a proposed summary of the correlations between DN pathogenesis pathways and clinical biomarkers are illustrated in Figure 1. With reference to Figure 1, the earliest event in the pathogenesis of DN is the direct effect of high levels of glucose in the systemic circulation. Upon entry into cells, glucose is metabolized to pyruvate through glycolysis, generating NADH. NADH and pyruvate then enters the mitochondria, where pyruvate is further metabolized to CO2 and water with the generation of additional electron donors (NADH and FADH2).
Figure 1: Proposed correlation between DN pathogenesis pathways and clinical biomarkers. Colour of the events in the pathogenesis pathway on the left relates to the measurable biomolecules with the same colour on the right. Lymphocyte CYP2E1 is generated very early in the DN pathway before structural damages occurs.
This increase in electron donors leads to a disturbance of the respiration chain with the formation of reactive oxygen species (ROS). ROS produced in abundance creating an oxidative stress. This milieu induces expression of CYP2E1 in peripheral blood lymphocytes (PBLs), possibly due to the physiological role of CYP2E1 to “detoxify” xenobiotics. If CYP2E1 levels in PBLs can be measured, it may be used as an early predictor for nephropathy in diabetic patients. Interventions can be tailored to eliminate the ROS in order to prevent the onset of disruption in renal structures which is the initiative steps of DN pathogenesis.
Moreover, the CYP2E1 elevation profile in correlation with the progression of diabetes to nephropathy has not been documented. If a relationship exists between the elevation of lymphocyte CYP2E1 and the progression of diabetes to diabetic nephropathy, CYP2E1 may be a potential indicator of early development of diabetic nephropathy. With this respect, the objective of this study is to evaluate CYP2E1 in peripheral blood lymphocytes as a potential early predictor of diabetic nephropathy.
Research design and Methods
Study Subjects
The study population consisted of 4 cohorts: control (C; n=28), Type 2 diabetes (D; n=50), diabetic nephropathy (DN; n=34) and non-diabetic nephropathy (NDN; n=31). The D, DN and NDN cohorts were defined with reference to the American Diabetes Association (ADA) criteria for diagnosis of diabetes mellitus (2007) [21] and the National Kidney Foundation (NKF) definition for nephropathy (2008) [22]. Control subjects had no family history of diabetes and nephropathy, fasting plasma glucose < 6.4mmol/l, no proteinuria, normal blood pressure, no significant clinical events during the past 6 months. All subjects were not obese and have not consumed any form of alcoholic beverages or food for the past 7 days before phlebotomy. D, DN and NDN subjects were either nonhypertensive or controlled hypertensive. DN and NDN subjects who underwent cadaveric kidney transplant were excluded from this study. The characteristics of the study population are summarized in Table 2. Informed consent was obtained from the subjects following approval from the University of Malaya Medical Centre Medical Ethics Committee (EC Ref. No. 642.4), the centre from which the subjects were recruited. This study conforms to the Declaration of Helsinki.
Sample Collection
Phlebotomy was performed on each subject to collect 20ml of venous blood using a butterfly needle venopuncture set. Venous blood was then dispensed into prelabelled test tubes containing sodium citrate (Sigma, USA) anticoagulant.
Lymphocytes were separated from all blood samples within two hours after collection, and immediately stored at -20°C until used for total RNA extraction. Along with the venous blood sample, all subjects had provided first voided morning urine specimen after an overnight fast. All urine samples were aliquoted into 1.5ml eppendorf tubes and immediately sent for albumin and creatinine quantitation at a hospital laboratory. Albumin to creatinine ratio (ACR) was calculated. Glomerular filtration rates (GFR) were calculated using the Cockroft-Gault formula. Serum creatinine and HbA1c values were obtained from patient’s clinical records. For the control cohort members’ serum creatinine, ACR and HbA1c values were measured at a hospital laboratory.
Isolation of lymphocytes from venous blood
Isolation of peripheral blood lymphocytes was carried out using NycoPrep media (Axis-Shield, Oslo, Norway) according to established method [24]. 10ml whole blood from each subject was diluted with equal volume of 0.9% NaCl in a 50ml Falcon tube. 20ml of diluted blood was then carefully layered on 10ml NycoPrep media in anothr 50ml Falcon tube. The Falcon tubes were capped to prevent the formation of aerosols. All tubes were then centrifuged at 800g for 20min at room temperature in a swing out rotor (Beckman, Allegra X-12, USA). After centrifugation the lymphocytes form a distinct band at the interface between the sample layer and the NycoPrepmedia. A pasture pipette was used to transfer the lymphocytes suspension into 15ml glass centrifuge tubes without removing the upper layer. Equal volume of 1x phosphate buffered saline (PBS) was added into centrifuge tubes containing lymphocytes suspension, mixed by gently inverting the tubes until the lymphocytes were homogenously diluted, followed by centrifuging all tubes at 400g for 10min at room temperature. Supernatants were discarded, lymphocytes were resuspended in 1x PBS and centrifuged again at 400g for 10min at room temperature. Supernatants were discarded and 1ml 0.1M TRIS-HCL, pH 7.4 was added into each tube, mixed gently by tapping the bottom of the tubes to dislodge the lymphocytes and bring them to a homogenous suspension. All lymphocyte suspensions were then transferred into pre-labelled 1.5ml microfuge tubes and immediately stored at -80ºC until used for RNA extraction.
Extraction of total RNA from peripheral blood lymphocytes.
Total RNA was extracted using RNeasyPlus Micro Kit (Qiagen, Germany) according to manufacturer’s protocol. Total RNA purity (A260/A280) and concentration was determined for each sample using a Nano-Spectrophotometer (IMPLEN, Germany).
Differential expression of CYP2E1 mRNA
5pg total RNA (tRNA) was reversed transcribed to cDNA and real time polymerase chain reaction (RT-PCR) was performed using QuantiFast SYBR Green RT-PCR mastermix reagent kit (Qiagen, Germany) in a 1 step real time PCR reaction according to manufacturer’s protocol. The PCR reactions were carried out on the iQ5 real time PCR cycler (Bio-Rad, USA). Primers for genes of interest (CYP2E1) and reference gene (GAPDH) were designed using the Primer 3 software (frodo.wi.mit.edu/cgibin/ primer3/primer3_www.cgi). To eliminate detection of contaminating DNA, the primers were designed in such that one half hybridizes to the 3’ end of one exon and the other half to the 5’ end of the adjacent exon. The primers will therefore, anneal to cDNA synthesized from spliced mRNAs, but not to genomic DNA. Primer sequences used in this experiment were CYP2E1 Forward Primer: 5’- TTG GTT GAC TCA CTC TTT CCT TT-3’; CYP2E1 Reverse Primer: 5’-TGA TGT CTG ATG AGG AGG TTT G-3’; GAPDH Forward Primer: 5’- ACA TCA AGA AGG TGG TGA ACC AG-3’; GAPDH Reverse Primer: 5’- CAA AGG TGG AGG AGT GGG TGT C - 3’. All primers were synthesized by 1st BASE Pte. Ltd. Singapore.
Microarray Experiment
Twenty samples from each cohort were randomly chosen to perform this experiment. Total RNA was extracted from each sample using RNeasyPlus Micro Kit as described above.
Amplification and labelling
100ng of total RNA was reverse transcribed to synthesize complementary DNA (cDNA) and amplified using Illumina Total Prep RNA Amplification Kit (Ambion, USA) according to manufacturer’s protocol. 10μL of cDNA was used to synthesize cRNA by performing an in vitro transcription (IVT) using Illumina Total Prep RNA Amplification Kit according to manufacturer’s protocol. cRNA purity and integrity were assessed by the Bioanalyser 2100 (Agilent, USA).
Microarray platform
Gene expression profiling was performed using Illumina’s HumanRef8 Sentrix bead array platform (Illumina, USA), which contained 24526 long oligonucleotide probes (50mer) representing well-annotated human genes. The full content of the platform is accessible under the Gene Expression Omnibus Accession no. GPL2700.
Microarray workflow
750ng of biotin-labelled cRNA of each samples were hybridized onto Illumina HumanRef-8 Sentrix gene chip and incubated for 18 hours at 58°C. After hybridization, the bead chips were washed and stained with streptavidin- Cy3 (1mg/mL RNase-free water; 2μL per chip).
Image analysis
Streptavidin-Cy3 stained bead chips were then scanned using the IlluminaBeadarray scanner, and spot fluorescent intensities were extracted using Illumina BEADSTUDIO software (version 1.5.0.34). The raw microarray data was exported as an IDAT file into the Gene Spring GX11.0 genomics and transcriptomics analysis software.
Microarray data analysis
Data normalization and quality control
Present and absent calls range were set at detection pvalue 0.8 as the lower cut-off for “present” call and at detection p-value 0.6 as the upper cut-off for “absent” call (GeneSpringGX 11.0 software default settings for Illumina platform). The raw data were than normalized to the median of all samples. The Illumina bead chip in-build samples dependent and samples independent quality controls were assessed to ensure acceptable quality of samples (cDNA) and an entirely successful microarray workflow, respectively.
Differentiating “signal” from “noise”
The normalized data were filtered at intensity level by flags. All samples with “P” (present) and “M” (marginal) flags were accepted, and retained all entities in which at least 85% of the values in any 1 out of 4 conditions (Control, D, DN, NDN) have acceptable values. All entities passing through this filter were re-filtered at gene expression level by setting the upper percentile cut-off as 100, lower cut-off as 20, and retained entities in which at least 85% of the values in any 1 out of 4 conditions are within range. 13361 genes out of 24526 genes passed these filters.
Development of Candidate Gene Signature in diabetes and DN
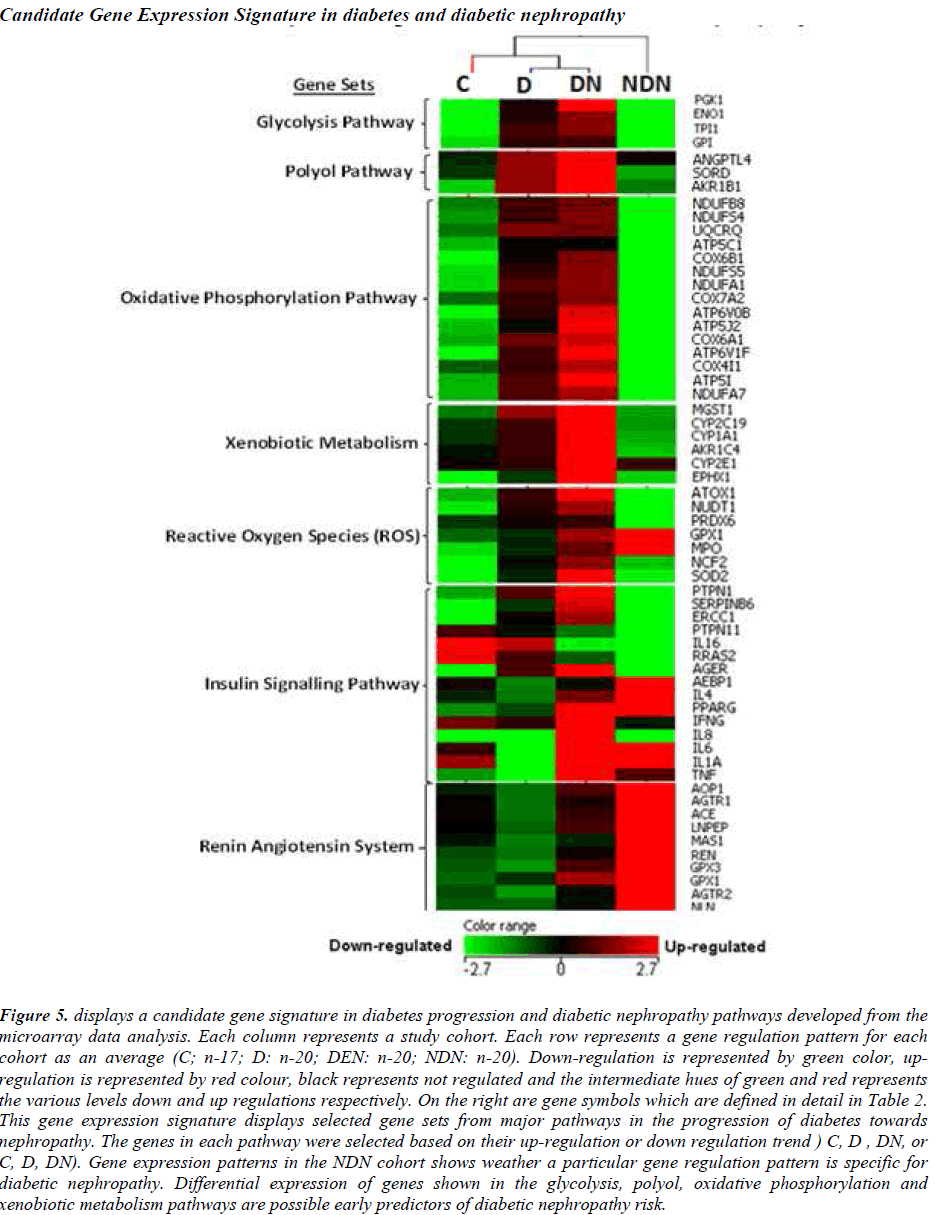
Gene set analysis (GSA) was performed on the 9383 genes, and 108 gene sets were discovered at P-value 0.001. The total number of genes in these 108 gene sets was 4101 genes. 7 gene sets containing a total number of 59 genes which prominently matched the events shown in Figure 2.1 (page 28) were manually selected. Following this, individual heat maps were generated for each gene set. The expression pattern for each gene in the heat maps was analyzed manually. Genes which had a distinctive increasing up-regulation or decreasing down-regulation in diabetes and diabetic nephropathy cohorts in comparison to the control cohort were selected. As an example; the average normalized intensity unit for phosphoglycerate kinase 1 gene (PGK1) from the glycolysis pathway was - 0.35494 in the control cohort; 0.03999 in the diabetes cohort and 0.36312 in the diabetic nephropathy cohort (Figure 4.9). Only 59 out of the 87 genes showed these types of expression patterns. Therefore, these 59 genes can actually be regarded as the “signature genes” in diabetes which may lead on to nephropathy (Early predictors of diabetic nephropathy). Finally, a heat map representing the candidate gene signature as an early predictor for diabetic nephropathy was constructed (Figure 4.14). The gene signature was validated by performing RT-PCR on 3 genes. 2 genes are the most prominent genes in this gene signature responsible for the production of reactive oxygen species (ROS) and one independent gene which is not in the gene signature but is related to diabetes.
Statistical Analysis
Data were analysed using SigmaPlot 11.0 statistical software. The ANOVA on ranks test was conducted to evaluate significant differences (P< 0.05) between all study cohorts against control cohort. Spearman Rank Order Correlation test was conducted to investigate correlations between CYP2E1 and gold standard clinical markers for nephropathy.
Results
Characteristics of study subjects
Characteristics of study subjects in 4 cohorts are presen ted in Table 1. Overall, the study subjects were nonobese, non-hypertensive or controlled hypertensive. Control subjects had normal blood pressure, HbA1c, serum creatinine and GFR. D, DN and NDN cohorts are heterogeneous, consisted of individuals with good and poor glycemic control.
Differential expression of CYP2E1 gene in D, DN and NDN
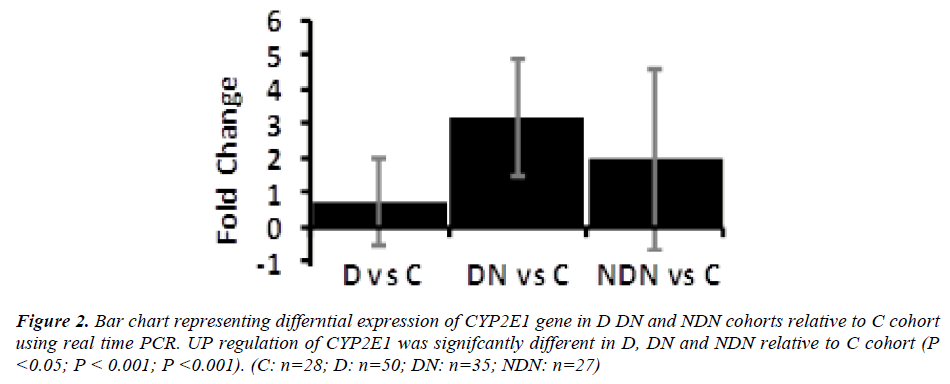
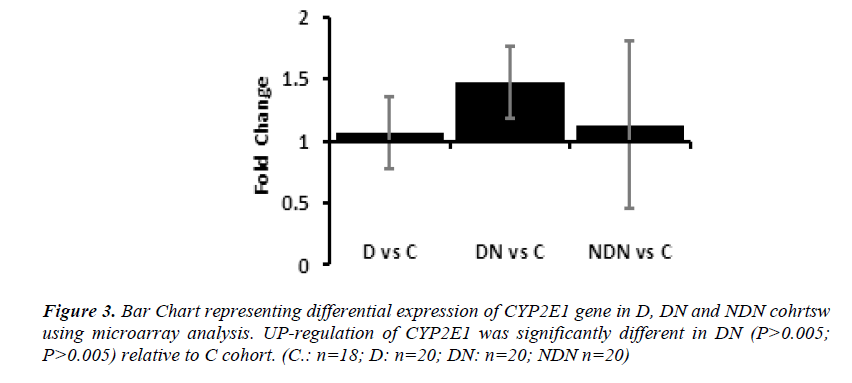
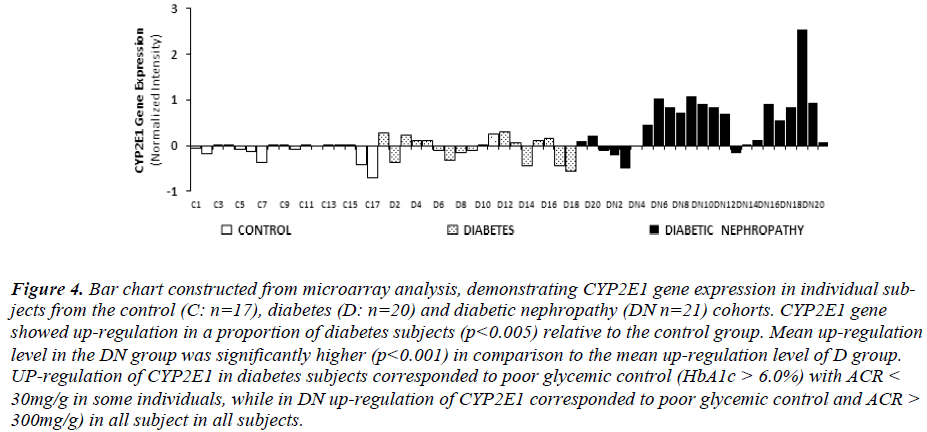
Differential gene expression of CYP2E1 gene in lymphocytes from D, DN and NDN cohorts presented in Figures 2 and 3. CYP2E1 gene was up-regulated in D, DN and NDN relative to control cohort. Similar trends of CYP2E1 up-regulation was seen in means of D, DN and NDN cohorts using the real time PCR (Fig. 2) and microarray (Fig. 3) experimental techniques.
Intensity of CYP2E1 expression in individual subjects of the C, D and DN cohorts is displayed in Fig. 3 demonstrating up-regulation of CYP2E1 in a proportion of diabetes subjects and in most of DN subjects relative to control group. Up-regulation of CYP2E1 in diabetes subjects corresponded to individuals with poor glycemic control (HbA1c>7.0%), irrespective of the presence of microalbuminuria. In DN, up-regulation of CYP2E1 corresponded to poor glycemic control (HbA1c>7.0%) and presence of microalbuminuria (ACR between 30 - 300mg/g) and macroalbuminuria (ACR> 300mg/g).
Figure 4: Bar chart constructed from microarray analysis, demonstrating CYP2E1 gene expression in individual subjects from the control (C: n=17), diabetes (D: n=20) and diabetic nephropathy (DN n=21) cohorts. CYP2E1 gene showed up-regulation in a proportion of diabetes subjects (p<0.005) relative to the control group. Mean up-regulation level in the DN group was significantly higher (p<0.001) in comparison to the mean up-regulation level of D group. UP-regulation of CYP2E1 in diabetes subjects corresponded to poor glycemic control (HbA1c > 6.0%) with ACR < 30mg/g in some individuals, while in DN up-regulation of CYP2E1 corresponded to poor glycemic control and ACR > 300mg/g) in all subject in all subjects.
Correlation of CYP2E1 gene expression with ACR, serum creatinine and GFR in D and DN was investigated using the Spearman Rank Order Correlation analysis (SigmaPlot 11.2 Statistical software). The results showed that CYP2E1 gene expression correlated positively with ACR (P= 0.03), serum creatinine (P = 0.0047) and a negative correlation was seen with GFR (P = 0.07).
Candidate gene expression signatures in diabetes progression and Diabetic nephropathy pathways
A prototype candidate gene signature (Fig. 5) representing diabetes progression and DN pathogenesis pathways have been constructed from the microarray analysis. The signature genes involved in major pathways are arranged according to events outlined in Figure 1. DN and NDN cohorts are distinguishable with the expression of signature genes from the glycolysis, polyol, oxidative phosphorylation pathways.
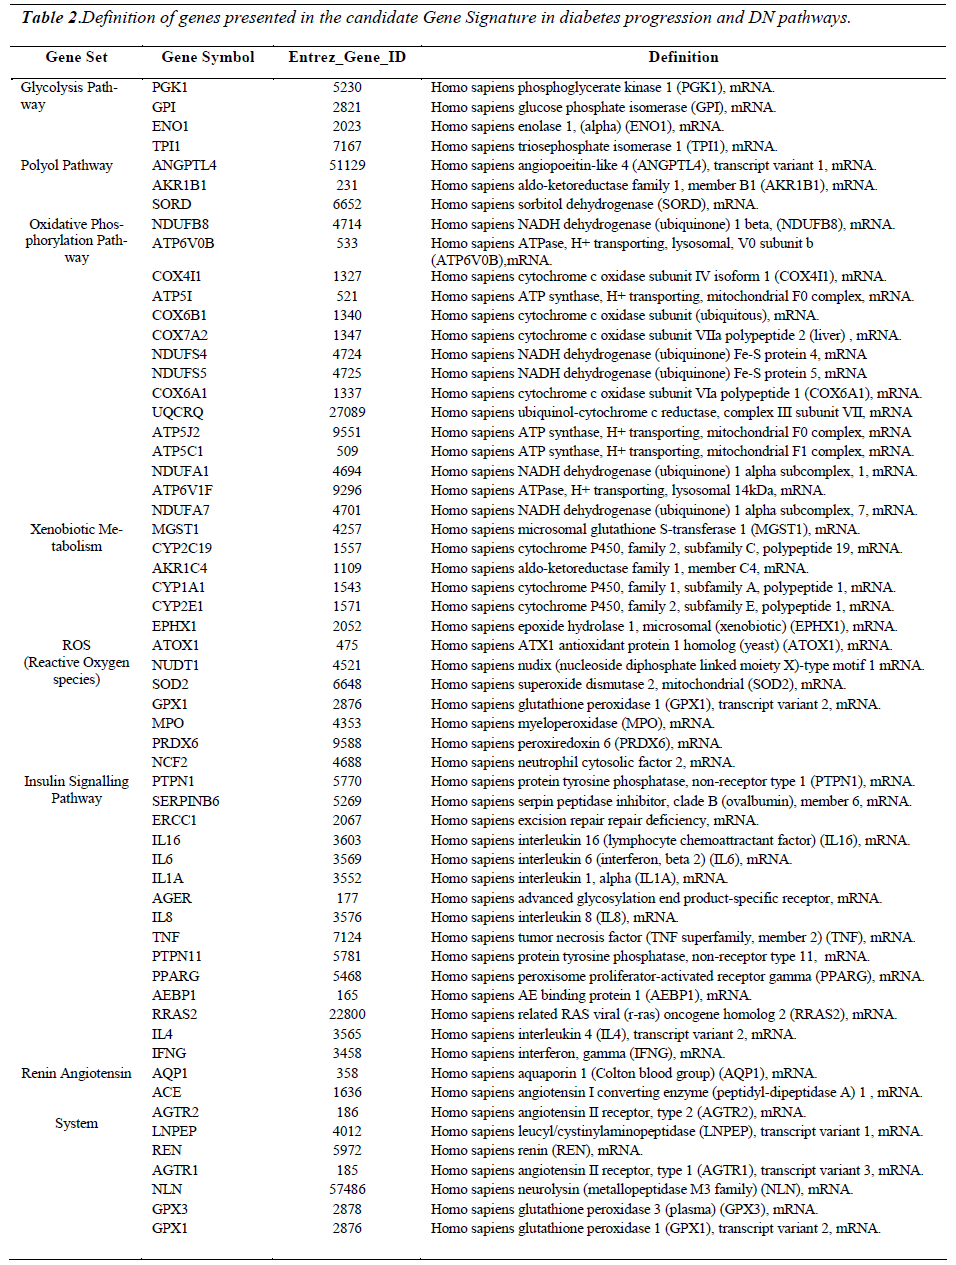
Figure 5: displays a candidate gene signature in diabetes progression and diabetic nephropathy pathways developed from the microarray data analysis. Each column represents a study cohort. Each row represents a gene regulation pattern for each cohort as an average (C; n-17; D: n-20; DEN: n-20; NDN: n-20). Down-regulation is represented by green color, upregulation is represented by red colour, black represents not regulated and the intermediate hues of green and red represents the various levels down and up regulations respectively. On the right are gene symbols which are defined in detail in Table 2. This gene expression signature displays selected gene sets from major pathways in the progression of diabetes towards nephropathy. The genes in each pathway were selected based on their up-regulation or down regulation trend ) C, D , DN, or C, D, DN). Gene expression patterns in the NDN cohort shows weather a particular gene regulation pattern is specific for diabetic nephropathy. Differential expression of genes shown in the glycolysis, polyol, oxidative phosphorylation and xenobiotic metabolism pathways are possible early predictors of diabetic nephropathy risk.
The expression patterns of the candidate signature genes involved in the glycolysis, polyol, oxidative phosphorylation and ROS pathways are the candidate early predictors, whereas the genes of the insulin signalling pathway and renin angiotensin system are the marker signatures for diabetic nephropathy.
Discussion
The outcome of this study showed 4 main observations. First, up-regulation of CYP2E1 gene expression showed greater association with diabetic nephropathy (DN) in comparison to non-diabetic nephropathy (NDN), consistent with the notion that hyperglycemia-induced ROS triggers CYP2E1 gene expression. Second, Lymphocyte CYP2E1 up-regulation was associated with hyperglycemia (HbA1c > 6%) in a proportion of diabetes subjects while conventional nephropathy markers such as ACR, serum creatinine and GFR was still within normal reference limits. Since the role of CYP2E1 in DN pathogenesis (Fig. 1) has been justified, it is possible that detectable CYP2E1 protein in peripheral lymphocytes could be a candidate early predictor for the onset and progression of DN. In NDN, glucose metabolism pathways are irrelevant and CYP2E1 up-regulation may be associated with advanced stages of nephropathy pathogenesis similar to the roles of “non-hyperglycemia-induced CYP2E1” in the advanced stages of the DN pathway. Third, Intensity of CYP2E1 gene expression correlated positively with ACR and serum creatinine. A negative correlation was observed with GFR. Fourth, other candidate early predictors specific for DN risk are PGK1, ENO1, TPI1, GPI from the glycolysis pathway and ANGPTL4, SORD, AKR1B1 from the polyol pathway.
A prototype candidate gene signature has been developed in this study. Investigations from the microarray suggest that the selected signature genes from the glycolysis, polyol, oxidative phosphorylation, xenobiotic metabolism, and ROS pathways may be candidate for early predictors of DN risk. The selected signature genes from the insulin signalling pathway are markers of the beginning of nephropathy, and the selected signature genes in the Renin-Angiotensin System are markers of established DN. DN can be exclusively distinguished from NDN by observing the signature genes of the glycolysis, polyol, oxidative phosphorylation and xenobiotic metabolism pathways. Investigations from the microarray analysis showed that signature genes from the Renin-Angiotensin System is functional (up-regulated) irrespective of the etiology of nephropathy. Thus, besides being able to distinguish early, intermediate and late stages in the DN pathogenesis pathway, these candidate gene signatures also distinguishes diabetic nephropathy from non-diabetic nephropathy.
The exact cause of diabetic nephropathy is still unknown to-date, but accumulating evidences suggested that multiple mechanisms contribute to the pathogenesis of this disease. However, the most documented key players in the development of diabetic nephropathy are hyperglycemia, hemodynamic factors, advanced products of nonenzymatic glycosylation reactive oxygen species and Cytochrome P450 2E1 [26]. Although these key factors may work in a complex interwoven fashion leading on to the pathogenesis of diabetic nephropathy, the main contributing factor is hyperglycemia. The cause of Type 2 diabetes is commonly known as a combination of resistance to insulin action and an inadequate compensatory insulin secretory response which leads on to hyperglycemia. During the insulin resistance state, excessive extracellular glucose enters into the cells by the insulinindependent transport mechanism aided by the GLUT- 1subtype of glucose transporters. GLUT-1 is the predominant isoform expressed in the glomerular mesengial cells [27]. Therefore, intracellular glucose becomes elevated and causes an increased flux through the polyol pathway [28] which consequently introduces the production of ROS. This immediate high glucose-induced production of ROS in turn induces elevation of CYP2E1 activity and protein in the liver cells [20], as well as in peripheral blood lymphocytes [11,21]. In non-diabetic individuals CYP2E1 is expressed predominantly in the liver, while in peripheral blood lymphocytes CYP2E1 is expressed at very low levels [20]. The findings of this present study are consistent with the latter, showing CYP2E1 was undetectable by HPLC in the control cohort, but was detectable in the DN cohort and in some of the D cohort members.
To date microalbuminuria is the gold standard marker for both type 1 and type 2 DN. Despite the drawbacks of urine albumin measurement, microalbuminuria is still being the preferred marker for DN. Moreover, microalbuminuria is not a specific marker for diabetic nephropathy. Transient elevations in urinary albumin excretion occur in several conditions such as short-term hyperglycemia, marked hypertension, exercise, urinary tract infections, heart failure and acute febrile illness. Although the measurement of albuminuria is essential to diagnose DN, some patients could have DN without increased UAE and a proportion of patients with type 2 Diabetes will have low GFR without micro- or macroalbuminuria. Several studies within the past 2 decades have shown from renal biopsies that by the time microalbuminuria is detected advanced renal structural changes has already occurred [9]. Our study has focused on the usefulness of using a biomolecule which can act as a warning flag, indicating that nephropathy onset is apparent, before any structural changes begin. A detailed literature review on the pathogenesis of diabetes as well as the pathogenesis of diabetic nephropathy has been studied to correlate the stages in pathogenesis of DN to which the commonly used clinical markers referred (Figure 1). With reference to Figure 1, it is likely that the appearance of CYP2E1 in peripheral blood lymphocytes occurs much earlier than microalbuminuria, elevated serum creatinine and decline in GFR. The findings from this study showed evidence that lymphocyte CYP2E1 is a potential early predictor for diabetic nephropathy due to it being up-regulated in some diabetic individuals while serum creatinine, ACR and GFR were still within normal reference limits.
The limitation of this study is that levels of lymphocyte CYP2E1 in normal healthy individuals (control cohort) may be bias towards the younger age group (< 35 years) due to lack of volunteers for age group above 35 years. This study has been extended as a longitudinal cohort study, aimed to quantify CYP2E1 using a proteomic approach. In addition, observations will be made on the changes of CYP2E1 in comparison to HbA1c levels and to blood glucose levels. Normal reference limits for CYP2E1 in PBL has not been documented to-date. But with reference to Figure 1, when CYP2E1 becomes detectable in PBL of a diabetic patient indicates that ROS has been overly produced and alarms a high risk of developing nephropathy. It is also apparent in clinical practice that a substantial proportion of patients with poor glycemic control escaped nephropathy. This may probably due to among many other factors, the ability of the in vivo antioxidant defence mechanism to maintain its efficiency in detoxification of ROS. It may also be likely that diet and nutrition played a role in highly supplementing antioxidants that maintained the efficiency of the antioxidant system.
CYP2E1 polymorphism has been commonly documented [26-29] and large inter-individual variability of CYP2E1 phenotype and genotype is apparent [28]. The most documented CYP2E1 variant alleles are the *1D (Phenotype: 4-fold greater post ethanol inducibility), *2 (Phenotype: greater activity), *5A (Phenotype: increased in vivo activity; decreased inducibility) and *5B (Phenotype: reduced in vivo enzyme activity) [27-29]. With relation to the documented phenotypes of the CYP2E1 variant alleles, it is likely that functional activities involving substrate binding and docking to the active site of the enzyme structure will be affected. Hence, the intrinsic activity as an “enzyme” will be defective. Therefore, the documented polymorphisms reported to date are not likely to have any impact on the expression of CYP2E1 protein induced by ROS in diabetes and the quantitation of CYP2E1 protein in peripheral blood lymphocytes. However, further studies are needed to exclude the effects of polymorphism on CYP2E1 expression in diabetes.
Microarray is a powerful tool in research but it is not suitable to be used as a diagnostic tool in clinical laboratories. Nevertheless, specific, precise and cost effective methods can be developed to detect and quantitate biomolecules or proteins encoded by the candidate early predictor signature genes for DN in plasma samples.
Conclusion
Findings of this study showed that regulation of lymphocyte CYP2E1 is associated with glycemic control and correlates positively with serum creatinine and ACR. Other genes besides CYP2E1 which correlated with the early pathogenesis of DN are the selected genes of the glycolysis (PGK, GPI, ENO1, TP1) and polyol (ANGPTL4, AKR1B1, SORD) pathways. However, further investigations are needed to evaluate the applicability of CYP2E1 protein as well as products of the signature candidate genes as candidate for early risk predictors for DN.
Acknowledgement
This study was supported by a grant by the Ministry of Science, Technology and Innovations, Malaysia (MOSTI). All authors are involved in the completion of this study. All authors also declare that this is an original study and there is no conflict-of-interest.
References
- Sanjay R, Lekhraj R, Rahmat R, Zain AM, Yap YG, Mohamed M, Taha M.Variation in the Prevalence, Awareness and Control of Diabetes in a Multiethnic Population: A Nationwide Population Study in Malaysia. Asia Pac J Public Health 2010; 22: 194-202.
- Letchuman GR, Wan Nazaimoon WM, Wan Mohamad WB, Chandran LR, Tee GH, Jamaiyah H, Isa MR, Zanariah H, Fatanah I, Ahmad Faudzi Y. Prevalance of Diabetes in the Malaysian National Heath Morbidity Survey III 2006. Med J Malaysia2006; 65: 173-179.
- Wu AYT, Kong NCT, De Leon FA. (2005).An alarming high prevalence of diabetic nephropathy in Asian type 2 diabetic patients: the Microalbuminuria Prevalance (MAP) Study: Diabetologia 2005; 48(1): 17-26.
- Hooi LS, Wong HS, Morad Z. Prevention of renal failure: the Malaysian experience. Kidney Int. Suppl2005; 94: S70-S74.
- Daniel B. Clinical and cellular markers of diabetic nephropathy. Kidney Int 2003; 63: 2319-2330.
- Jaffa AA, Durazo-Arvizu R, Zheng D, Lackland DT, Srikanth S, Garvey WT, Schmaier AH. Plasma prekallikrein: a risk marker for hypertension and nephropathy in type 1 diabetes. Diabetes2003; 52: 1215-1221.
- Sundsten T, Eberhardson M, Goransson M, Bergsten P.The use of proteomics in identifying differentially expressed serum proteins in humans with type 2 diabetes. Proteome Sci2006; 4(22): doi:10.1186/ 1477-5956-4-22.
- Rao PV, Lu X, Standley M, Pattee P, Neelima G, Girisesh G, Dakshinamurthy KV, Roberts CT Nagalla SR. Proteomic Identification of Urinary Biomarkers of Diabetic Nephropathy. Diabetes Care 2007; 30: 629-637.
- Fioretto P, Keane WF, Kasiske BL, O’Donnell MP, Klein DJ. Alterations in glomerular proteoglycan metabolism in experimental non-insulin dependent diabetes mellitus. J Am Soc Nephrol 1993; 3: 1694-1704.
- Lieber CS. Cytochrome P-4502E1: Its physiological and pathological role. Physiol Rev 1977; 77: 517-544.
- Ronis MJ, Lindros KO, Ingelmann M. The CYP2E family. In: Cytochromes P450: Metabolic and Toxicological Aspects. Ed Ioannides, C., Boca Raton, FL, CRC Press 1996; pp211-239..
- Haufroid V, Ligocka D, Buysschaert M, Horsmans Y, Lison D. Cytochrome P4502E1 (CYP2E1) expression in peripheral blood lymphocytes: evaluation in hepatitis C and diabetes. Eur J Clin Pharmacol 2003; 59: 29-33.
- West IC. Radicals and oxidative stress in diabetes. Diabetic Medicine 2000; 17: 171-180.
- Mishra J, Dent C, Tarabishi R, Mitsnefes MM, Ma Q, Kelly C, Ruff SM, Zahedi K, Shao M, Bean J, Mori K, Barasch J, Devarajan P. Neutrophil gelatinaseassociated lipocalin (NGAL) as a biomarker for acute renal injury after cardiac surgery. Lancet 2005; 365(9466): 1231-1238.
- Satchell SC, Tooke JE. What is the mechanism of microalbuminuria in diabetes: a role for the glomerular endothelium? Diabetologia 2008; 51: 714-725.
- Wolf G. Growth factors and the development of diabetic nephropathy. Curr Diab Rep2003; 3:485-490.
- Hostertter TH. Hyperfiltration and glomerulosclerosis .Semin Nephrol 2003; 23: 194-199.
- Jefferson JA, Shankland SJ, Pichler. Proteinuria in diabetic kidney disease: A mechanistic viewpoint. Kidney Int, 2008; 74: 22-36.
- Janice SC, Mohammed S, Christopher MF, Peter MG.Cystatin C – A Paradigm of Evidence Based Laboratory Medicine. Clin Biochem Rev 2008; 29: 47-62.
- American Diabetes Association. Standards of Medical Care in Diabetes-2009. Diabetes Care 2009; 32: Supplement 1, S13-S61.
- National Kidney Foundation, 2008. http://www.kidney.org/professionals/KDOQI/guidelines_ckd/p1_exec.htm.
- Boyum A, Brincker F, Martinsen T, LØvhaug D. Separation of human lymphocytes from citrated blood by density gradient (NycoPrep) centrifugation: Monocyte depletion depending upon activation of membrane potassium channels. Scand J Immunol 2002; 56:76-84.
- RaucyJL, Schultz ED, Wester MR, Arora S, Johnston DE, Omdahl JL, Carpenter SP. Human lymphocyte cytochrome P450 2E1, a putative marker for alchoholmediated changes in hepatic chlorzoxazone activity. Drug Metab Dispos 1996; 25: 1429-1435.
- Bressolle F, Bromet-Petit M, Audran M. Validation of liquid chromatographic and gas chromatographic methods. Journal of Chromatography B 1996; 686: 3-10.
- Ohshiro Y, Lee Y, King GL. Mechanism of Diabetic Nephropathy: Role of Protein Kinase-C Activation. Advanced Studies in Medicine 2005; 5, 1A: S10-S19.
- Danko IM and Chaschin NA. Association of CYP2E1 gene polymorphism with predisposition to cancer development. Exp Oncol 2005; 27: 248-256.
- Ginsberg G, Smolenski S, Neafsey P, Hattis D Walker K, Guyton KZ, Johns DO, Sonawane B. The influence of genetic polymorphisms on population variability in six xenobiotic-metabolizing enzymes. Journal of Toxicology and Environmental Health 2009; Part B (12): 307-333.
- Neafsey P, Ginsberg G, Hattis D, Johns DO, Guyton KZ, Sonawane B. Genetic polymorphism in CYP2E1: Population distribution of CYP2E1 activity. Journal of Toxicology and Environmental Health 2009;Part B (12): 362-388.
- Tang K, Li X, Xing Q, Li W, Feng G, He L, Qin S. Genetic polymorphism analysis of cytochrome P4502E1 (CYP2E1) in Chinese Han populations from four different geographic areas of Mainland China. Genomics 2010; 95: 224-229.
