Research Article - Biomedical Research (2017) Volume 28, Issue 16
Complexity analysis of EEG motor movement with eye open and close subjects using multiscale permutation entropy (MPE) technique
Lal Hussain1,2*, Wajid Aziz2,3, Sharjil Saeed2, Saeed Arif Shah2, Malik Sajjad A Nadeem2, Imtiaz Ahmed Awan2, Ali Abbas2, Abdul Majid2 and Syed Zaki Hassan Kazmi2
1Quality Enhancement Cell, University of Azad Jammu and Kashmir, City Campus, Muzaffarabad, Pakistan
2Department of Computer Sciences and Information Technology, University of Azad Jammu and Kashmir, Muzaffarabad, Pakistan
3Faculty of Computing and IT, University of Jeddah, Makkah, Saudi Arabia
- *Corresponding Author:
- Lal Hussain
Quality Enhancement Cell
University of Azad Jammu and Kashmir
City Campus, Muzaffarabad, Pakistan
Accepted date: July 18, 2017
Abstract
Background: Biological systems exhibit non-linear and spatiotemporal dynamics and structures even at rest. Humans demonstrate a remarkable ability to generate accurate and appropriate motor behaviour under many different and often uncertain environmental conditions. There are many motor movement tasks like eye open and close conditions, hand movements, fist movement etc. Brain controls all motor movement tasks. Electroencephalography (EEG) is a technique used to quantify the dynamics of physiological systems using non-invasive physiological monitoring and clinical investigation. The mental simulation of motor related tasks such as opening and closing of eye, left and right fist and fingers and other motor executive brain regions are commonly cognitive nature of tasks requires analysis using EEG motor movements.
Methods: To quantify and understand the dynamics of EEG motor movements tasks, we employed robust Multiscale Permutation Entropy (MPE) analysis technique to distinguish Eye Open (EO) and Eye-Closed (EC) conditions. Mann-Whitney rank test was used to find significant differences between the groups and result were considered statistically significant for p-values<0.05. The Receive Operator Curve (ROC) was also computed to find the degree of separation between the groups.
Results: The finding reveals that that frontal electrodes (F2, F3, F4, F5, F6, F7, F8) and front polar electrodes gives the highest separations and significant results to distinguish the EEG Motor movements tasks between eye open and eye closed tasks. The parietal (P3, P4), occipital (O1, O2) and central (C3, C4) electrodes gives only significant results at various temporal scales. The extremely significant results were obtained at F5, Fp1 followed by F1, F4, Fp2, F6 and F7. It was also found that frontal electrodes give the highest significance results followed by parietal, occipital and central electrodes which imply that these regions accordingly will help to distinguish these conditions from EEG motor movement tasks. MPE give higher significance results and separation at all selected electrodes than MSE to discriminate the brain states during EC and EO during the motor movement/imaginary tasks.
Keywords
Electroencephalogram (EEG), Multiscale permutation entropy (MPE), Mann whitney test (MMT), Receiver operator curve (ROC), Complexity
Introduction
The brains’ dynamical activities are quantified using the Electroencephalogram (EEG) a non-invasive technique which provides both local and global spatiotemporal description of the combined neuronal activities. The brain has non-linear and non-stationary nature of data due to which the analysis of EEG signals always remain as a challenging task [1].
The research also reveals that brain activities in form of various tasks and brain pathologies such as Alzheimer disease, epilepsy, dementia etc. are measured and analyzed using the EEG signals. The theory of non-linear dynamics is used to understand the non-linear behaviour and intrinsic nature of the brain [2].
In the previous studies, analyzed the imagination of mental tasks as left and right movement [3]. The reference electrodes should be ideally silent during the electrical activity. Due to noise components selected for reference electrode make hard to take the good EEG feature to acquire the relevant mental states. To classify the eye open and close, left or right motor imagery, the reference location should activate only when there exists motor imagery and the activity remain stable during the right and left imagery situations to differentiate the two classes. Moreover, the cognitive activity and states of movements were observed during different EEG frequency bands. The research also reveals that different EEG rhythms mainly alpha (8-12 Hz) and beta (14-30 Hz) frequency ranges characterize the brain activity of motor and sensory area during somatosensory processing and voluntary movements [4]. The EEG rhythm themselves are the product of synchronized activity within and among the neural assemblies, thus it is assumed that changes in EEG power reflect the underlying changes in neuronal synchrony typically known as “task related” or “event related” de-synchronization to illustrate the event related changes in EEG power over the cortex.
The literature evidences show that a complex nature of dynamics were observed during resting state EEG and EEG motor movements tasks during which they compared healthy volunteers with eyes open and closed conditions during unchanging external stimulation in complete darkness [5-7]. The results show that the eyes open visual motor and attentional systems were seen activated whereas the somatosensory, visual, vestibular and auditory systems were activated during eye closed states. They also observed that two different mental activities such as “interoceptive” state characterized by multisensory and imagination activity during eye-closed and an “exteroceptive” state by ocular motor and attention during eye open state.
To quantify the dynamics of EEG signals and to better understand the complexity which vary before and during and different brain pathologies and the seizures episodes, different entropy measures have been discussed in the literature [8]. These entropy measures have the capability to identify the complexity present in the EEG signals using computerized approaches. Acharya et al. used different entropy features (sample entropy, approximate entropy, phase entropy, Renyi’s entropy, Shannon entropy and HOS entropies) to detect and diagnose the epileptic seizure [8,9]. They observed that combination of entropy features rather than signal entropy has improved the classification accuracy.
Among the above mentioned classical entropic measures, Permutation Entropy (PE) is more robust and reliable to quantify the dynamics of highly complex nature of biological signals, data length independence capability and even if the time series perturbed to external noise. PE was initially proposed by Bandt et al. to measure the irregularity of non-stationary time series [9]. The purpose of using PE was to compute the order relations between the values of a time series rather than the values themselves. Many researchers compared PE with the approximate entropy and sample entropy and found that PE method has more simplicity, lower complexity in computation without further model assumptions, and robustness even in presence of dynamical and observational noise [9-13]. Cao et al. employed PE to detect the epileptic activities in the intracranial EEG signals recorded from three patients suffered from the intractable epilepsy and it was observed that PE drops after seizure. Nicolaou et al. employed PE as feature for automated detection of epileptic seizure and obtained higher sensitivity of 94.38% and specificity of 93.23% [14,15].
The physiological time series exhibits evident or structural correlations over multiple temporal and spatial scales. Costa et al. proposed Multiscale Sample Entropy (MSE) most effectively used method to account the effects at multiple time scales present in the complex time series [16]. An important nature of EEG in its dynamics represents ‘complexity’, which is characterized quantitatively by complexity analysis. Lempel et al. developed the most popular complexity measure as LZ complexity. Other prevalent complexity measures include spectral entropy, approximate entropy and median frequency where Lempel-Ziv (LZ) complexity measure C (n) can act as an alternative tool for EEG analysis, since it is suitable to characterize the development of spatiotemporal activity patterns in high-dimensionality non-linear systems like heart and brain. Hong et al. combined the LZ complexity with the Continuous Wavelet Transform (CWT) and found that the new method was more effective in bearing fault diagnosis. Moreover, Approximate Entropy (AE) and Multiscale Entropy (MSE) are used for measuring the regularity of time series in fault diagnosis. Entropy based method require less time for computation and are simple, thus gives good performance in bearing fault diagnosis. Besides, single scale entropy methods provide limited performance for complicated data, thus Aziz et al. proposed new methods termed as Multiscale Permutation Entropy (MPE) to calculate the entropy at multiple scales [17]. They observed that healthy subjects have higher complexity than the pathological subjects which are consistent with the previous findings of HRV, gait dynamics using entropy based measures. Rathore et al. [55] used image segmentation technique to detect and diagnose various conditions and diseases. Abbsai et al. [56] used entropy based techniques to study the gait dynamics. Hussain et al. [57] employed multiscale permutation entropy for EEG analysis and to distinguish the alcoholic subjects from control subjects. Recently, Hussain et al. [58] employed the most robust Kd tree algorithm based entropy measures to quantify the dynamics of Electroencephalographic (EEG) signals to distinguish the alcoholic subjects from that of control subjects. The results reveal that healthy (non-alcoholic) subjects exhibit much higher complexity than the alcoholic subjects at multiple temporal scales. They also observed that parietal and central probes exhibit highest significance results and separation followed by occipital and frontal probes which shows that these brain regions can help the clinicians and neurologists in curing the patients suffering from alcoholism.
Methodology
EEG recordings
In the present study, the datasets for EEG motor movement tasks comprising of baseline eye open and eye close were taken from publicly available database of Physionet available at the link (http://physionet.org/pn4/eegmmidb/). EEG signals were extracted from 17 electrodes-F2, F3, F4, F5, F6, F7, F8, Fp1, Fp2, FC1, FC2, O1, O2, P3, P4, C3 and C4 complying with the international 10-20 system and sampled at 160 HZ of one to two-minute recording.
The data was acquired using BCI2000 system comprising of 109 subjects performing different motor/imagery tasks [18]. Subjects were asked to execute and imagine different tasks while 64 channels of EEG signals were recorded from the electrodes that were fitted along the scalp. Each subject performed 14 experimental runs: two one-minute baseline runs (one with eyes open, one with eyes closed), and three two-minute runs of each of the four tasks as target appear on either left or right of the screen with subjects open or close or imagine open or close correspondence fist until target disappear then relaxing the subject and target appear on top or bottom of the screen with subjects open or close or imagine open or close either both fists or both feet until target disappear then relaxing the subject. In the present study, we have extracted the data of only two experimental runs i.e. baseline eye open and close for 50 subjects for both tasks i.e. 25 subjects from EC and 25 from EO conditions for electrodes F2, F3, F4, F5, F6, F7, F8, Fp1, Fp2, O1, O2, C3, C4. In motor movement/imaginary tasks, during non-changing external stimulation, the attentional systems and ocular motor are activated when the eyes are closed. While somatosensory, visual, vestibular and auditory systems are activated when the subjects closed their eyes. Moreover, during eye movements, two mental state activities can be seen, the ‘interoceptive’ state which is characterized by multisensory and imagination activity is observed during the eye open condition.While ‘exteroceptive’ state can be characterized by interpreting and attention of brain activation studies. Likewise, these conditions will help to analyse the intrinsic dynamics of brains and to make the either short or long term decisions.
Multiscale permutation entropy (MPE)
To quantify the dynamics and to extract the information from a time series with special regard to its complexity, PE is considered as most robust and fast method [9]. It is based to count the ordinal pattern also called motifs that describe the up and down in the dynamical systems. PE is computed based on the relative frequencies of different motifs. PE in comparison to Sample entropy and other entropy measures is most robust to noise because it considers only the ordinal patterns as the amplitude of the signal is not actually relevant. Moreover, to study the dynamics of biological signals (e.g. EEG), PE is considered as interesting by-product as it also implies independence on choice of the reference electrodes [19]. Moreover, using PE, we don’t require the pre-processing and normalization steps. Likewise, PE is invariant measure to quantify the complexity of a time series by discerning the relative changes of complexity from the limited data as well. PE is computed using the concept of Shannon Entropy to ordinal pattern analysis through estimation of the relative frequencies of ordinal patterns taken from the time series. PE is using an alternative way to measure the similarity among patterns with respect to other types of complexity measures like approximate and sample entropy. In regular time series, there are lots of similar ordinal patterns; in contrast, the occurrence of different patterns with similar frequency is an indicative of high complexity [20].
Following steps are used to compute the MPE:
Step 1: Considered a discrete time series {Ta, a=1, 2, 3, 4, …..,N}, the data points are averaged within non-overlapping window of increasing length. The coarse-grained time series is computed using the following equation.
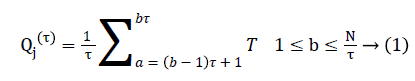
Where τ represents the scale factor and length of each coarse-grained series is equal to original time series divided by τ as shown in the following Figure 1.

Figure 1: Coarse grain procedure.
Step 2: The permutation entropy is computed using the following procedure:
Consider a coarse-grained time series {Qa, b=1, 2, 3… M}, which is embedded to m dimensional space.
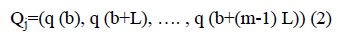
Where m is embedding dimension and L is time delay. For each b, m dimensional number of real value Qb=(q (b), q (b +L), …. , q (b+(m-1) L) can be arranged in increasing order.

To uniquely map any vector Qb onto (b1, b2, b3…, bm) we require m! permutations of m distinct symbols (1, 2, 3,…., m). Consider the probability distribution for distinct symbols (S1, S2, S3 … Sk), where k ≤ m!, permutation entropy for coarsegrained time series defined as Shannon entropy is computed as:
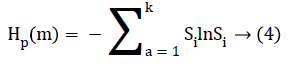
Where Sb=1/m!, Hp (m) attains maximum value of ln (m!).
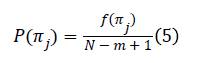
For m different samples, there will be m! possible ordinal patterns, π, which is called ‘motif’. For each single motif πj, let f (πj) denotes its frequency of occurrence in time series. Thus, relative frequency is:
For fixed embedding dimension m>2 and fixed time-lag L=L ̃, PE is defined as:
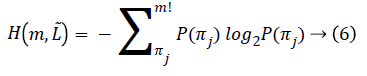
Where the sum runs over all m! motif π. The maximum value of H (m) is log2 (m!) this implies that all motifs have equal probability. The smallest value of H (m) is zero indicating a very regular time series i.e., it repeats only with some basic motif.
Non-parametric test
Nonparametric tests are like a parallel universe to parametric tests. Table 1 shows related pairs of hypothesis tests that Minitab statistical software offers [21].
| Parametric tests (means) | Non-parametric tests (medians) |
|---|---|
| 1-sample t test | 1-sample Sign, 1-sample Wilcoxon |
| 2-sample t test | Mann-Whitney test |
| One-Way ANOVA | Kruskal-Wallis, Mood’s median test |
| Factorial DOE with one factor and one blocking variable | Friedman test |
Table 1: Related pairs of hypothesis tests.
Non-parametric procedures based on no or few assumptions about shape and parameters, for different analysis type’s different non-parametric test can be applied e.g. for two dependent samples, Wilcoxon signed-rank test is applied, if data contain more than two independent sample then Kruskal- Wallis test is used furthermore to estimate the degree of association between two quantitative variables Spearman’s rank correlation procedure can be used. A popular non-parametric test to compare outcomes between two independent groups is the Mann Whitney U test. The Mann Whitney U test, sometimes called the Mann Whitney Wilcoxon Test or the Wilcoxon Rank Sum Test, is used to test whether two samples are likely to derive from the same population. In present work Mann-Whitney test was applied. It is used when data of both groups is taken from same individual. In our case both groups with EC and EO condition are taken from same individual during EEG motor movement tasks. The Mann-Whitney test, also called the Wilcoxon rank sum test, is a non-parametric test that compares two unpaired groups. To perform the Mann- Whitney test, Prism first ranks all the values from low to high, paying no attention to which group each value belongs. The smallest number gets a rank of 1. The largest number gets a rank of n, where n is the total number of values in the two groups. Prism then averages the ranks in each group, and reports the two averages. If the means of the ranks in the two groups are very different, the P value will be small. Moreover, you can’t interpret a P value until you know the null hypothesis being tested. For the Mann-Whitney test, the null hypothesis is that the distributions of both groups are identical, so that there is a 50% probability that an observation from a value randomly selected from one population exceeds an observation randomly selected from the other population [22].
Results
The entropy values are computed over multiple temporal scales as shown in the Table 2 using complexity based measures MSE and MPE to distinguish the EC and EO conditions from EEG motor movements signals. Overall, the MPE gives highest separations and significance results than MSE.
| Probe | Mean rank | Mean | Median | Min. | Max. | Optimal P-value | |||||||
|---|---|---|---|---|---|---|---|---|---|---|---|---|---|
| EO | EC | EO | EC | EO | EC | EO | EC | EO | EC | MSE | MPE | Scale | |
| F2 | 13.93 | 27.08 | 1.55 | 1.89 | 1.5 | 1.88 | 0.87 | 1.33 | 2.2 | 2.34 | 0.0004 | 0.0001 | 3 |
| F3 | 15.2 | 25.8 | 1.7 | 1.92 | 1.68 | 1.96 | 1.28 | 1.13 | 2.26 | 2.43 | 0.0043 | 0.0022 | 18 |
| F4 | 14.95 | 26.05 | 1.67 | 1.9 | 1.6 | 1.92 | 1.3 | 1 | 2.32 | 2.44 | 0.0024 | 0.00017 | 18 |
| F5 | 15 | 26 | 1.58 | 1.82 | 1.6 | 1.84 | 1.14 | 1.18 | 2.31 | 2.4 | 0.0031 | 0.00001 | 15 |
| F6 | 14.7 | 26.3 | 1.58 | 1.86 | 1.58 | 1.96 | 1.12 | 0.83 | 2.22 | 2.39 | 0.0018 | 0.0007 | 15 |
| F7 | 16.9 | 24.1 | 1.5 | 1.7 | 1.4 | 1.72 | 1.02 | 1.07 | 2.21 | 2.22 | 0.053 | 0.0007 | 10 |
| F8 | 14.95 | 26.05 | 1.4 | 1.76 | 1.34 | 1.82 | 0.78 | 1.01 | 2.24 | 2.24 | 0.0028 | 0.0012 | 11 |
| FP1 | 14.23 | 26.78 | 1.16 | 1.61 | 1.09 | 1.53 | 0.74 | 0.82 | 2.06 | 2.31 | 0.0007 | 2.81E-05 | 16 |
| FP2 | 14.13 | 26.88 | 1.15 | 1.62 | 1.07 | 1.6 | 0.74 | 0.76 | 1.96 | 2.27 | 0.0006 | 0.00013 | 14 |
| O1 | 15.95 | 25.05 | 1.82 | 1.94 | 1.82 | 1.99 | 1.18 | 1.34 | 2.36 | 2.32 | 0.0056 | 0.023 | 2 |
| O2 | 14.7 | 26.3 | 2.01 | 2.02 | 2.03 | 2.1 | 1.29 | 1.29 | 2.43 | 2.44 | 0.0071 | 0.053 | 12 |
| P3 | 15.35 | 26.65 | 1.78 | 1.88 | 1.78 | 1.92 | 1.24 | 1.48 | 2.32 | 2.33 | 0.009 | 0.0179 | 2 |
| P4 | 15.5 | 25.5 | 1.76 | 2.04 | 1.77 | 2.05 | 0.98 | 1.7 | 2.26 | 2.34 | 0.0066 | 0.0163 | 3 |
| C3 | 15.65 | 25.35 | 1.87 | 2.02 | 1.9 | 2.02 | 0.98 | 1.3 | 2.38 | 2.41 | 0.0268 | 0.0523 | 6 |
| C4 | 15.45 | 25.55 | 1.89 | 2.1 | 1.95 | 2.18 | 1.31 | 1.41 | 2.36 | 2.43 | 0.0398 | 0.0665 | 6 |
Table 2: Maximum significant separation level with p-values at time scales 1-20 using MSE and MPE profiles for EEG motor movement data with baseline EC and EO.
Using MSE, very high significance results were obtained at electrode F2 (P-value 0.0004), followed by Fp2 (P-value 0.0006), Fp1 (P-value 0.0007). The high significance results were obtained at electrodes F6 (P-value 0.0018), followed by F4 (P-value 0.0024), F8 (P-value 0.0028), F5 (P-value 0.0031), F3 (P-value 0.0043), O1 (P-value 0.0056), P4 (P-value 0.0066), O2 (P-value 0.0071) and P3 (P-value 0.009). Moreover, the electrodes C3 (P-value 0.0268), C4 (P-value 0.0398), and F7 (P-value 0.053) also gives the significant results to distinguish these conditions.
Using MPE, very higher significance results were obtained at electrodes F5 (P-value 0.00001) followed by Fp2 (P-value 0.000028), F2 (P-value 0.0001), Fp2 (P-value 0.00013), F4 (P-value 0.00017). Moreover, higher significance results were obtained at electrodes F8 (P-value 0.0012) followed by F3 (P-value 0.0022). Likewise, significance results were obtained at electrodes P4 (P-value 0.0163), followed by P3 (P-value 0.0179), O1 (P-value 0.023), O2 (P-value 0.053), C3 (P-value 0.523), and C4 (P-value 0.0665).
The mean ranks were computed for selected electrodes in both EO and EC conditions. Among all the electrodes, EC have higher ranks than EO showing higher complexity in depicted scales. In EC condition, the highest ranks were found in electrodes F2 (27.08) followed by Fp2 (26.88), Fp1 (26.78), P3 (26.65), O2, F6 (26.30), F8, F4 (26.05).
Using MSE, the means, median, minimum and maximum values at appropriate scales which optimal significant results were obtained also computed as depicted in the Table 2. The results also reveal that higher statistical differences are seen in those conditions where more optimal (minimal) significant results were obtained.
Area under the curve (AUC)
ROC is used to visualize and analyze system behaviour using two-dimensional sensitivity (True positive rate-TPr) and specificity (False positive rate-FPr) value plot along y-axis and x-axis respectively. The area under the curve shows the separation among the groups the maximum value of AUC was obtained at F5 (AUC=0.90750) electrode on which extremely significant results (p-value 0.00001) were also obtained followed by the electrodes as depicted in the Figure 2.

Figure 2: Receiver Operator Curve (ROC) at Electrode F2.
Discussion
This aim of this research was to distinguish the EEG motor movement data with baseline eye open and close. Table 2 depicts the mean ranks and significant results to discriminate the eye open subjects from that of eye closed during motor movements using Mann Whitney Ranksum test. The MPE in comparison to MSE shows high significant results to distinguish these conditions at various temporal scales. The results are consistent with the previous studies that complexity degraded during the pathological condition [23-25]. MPE maximum separation to distinguish these conditions; the extremely significant results were obtained at frontal electrodes F5 (P-value 0.0001), Fp2 (P-value 0.000028). The very significant results were obtained at electrodes F1 (P-value 0.0001), F4 (P-value 0.0001), Fp2 (P-value 0.00013), F6 and F7 (P-value 0.0007). The highly significant results were obtained at electrodes F8 (P-value 0.0012), F3 (p-value 0.0022). The electrodes P4 (P-value 0.0163), P3 (P-value 0.0179), O1 (P-value 0.023) gives also significant results. However, the electrodes O2 (P-value 0.053), C3 (P-value 0.0523) and C4 (P-value 0.0665) gives only significant results.
In this study, we discussed the EEG Motor Movement/Imagery data comprising of Baseline Eye open and Eye close tasks using MSE which can assess the signal complexity and compute the regularity of coarse-grained sequence at different time scales. MSE as proposed by Costa was used for small data of one to two-minute EEG recording of Motor Movement has important advantage with other traditionally used non-linear techniques such as L1, D2 as it can be applied relatively noisy and short physiological time series and model independent [26]. Moreover, MSE can be applied to measure complexity of physiological and pathological subjects on different time scales [26-29].
Over the past few years, the complexity of time series from biological signals such as brain and heart have been extensively studied using the permutation entropy and related techniques. The reasons to use these measures are manifold. Almost all the biological systems exhibit the complex spatio-temporal dynamics and structures even at rest [30]. For example, the brain spontaneous activities encompass a set of dynamically switching states. These are re-edited continuously across the cortex in a non-random way [31-34]. Likewise, other pathologies such as epileptic seizures are typically characterized by the ordered sequences of the symptoms. Permutation entropy is more robust to capture the structure dynamics of both healthy and pathological states. Moreover, all the biological systems exhibit the linear and non-linear dynamics [35,36] are perturbed to external and observational noise. The analysis of these systems requires methods that are robust and model free. Contrary to the most non-linear measure, the permutation entropy is more robust to noise sources and artifacts [9]. Finally, most of the clinical application requires the algorithms which are computationally reliable for relative short and noisy time series. The existing techniques require long, stationary and noiseless data, while the permutation entropy on the other hand extremely reliable for such type of time series and require no further steps for pre-processing and tuning the parameters etc. Based on these facts, the permutation entropy derived from the original Bandt et al. method [27-29] were most extensively used to study the dynamics of brain electrical activity such as epilepsy research, neuroscience, and anaesthesiology [27-29,37-50]. Hussain et al. recently compared the SE with symbolic time series to investigate the dynamics of EEG signals with seizure (ictal interval) and without seizures (interictal intervals including both focal and non-focal signals) and observed that entropy drops for seizures signals [51-54].
Moreover, from the results analyzed above, it can be inferred that MSE profiles from time scales τ ≥ 10 reveal no significant differences to discriminate the EEG motor movement eye open and close tasks however. While MPE gives the significant results in most of the electrodes at time scale τ ≥ 10 at electrodes located in frontal (F2, F3, F4, F5, F6, F7, F8,), posterior brain region (P3, P4, O1, O2) and central region (C3 and C4), frontpolar (Fp1 and Fp2) and front central (FC1 and FC2) region.
Likewise, the ROC curves measures are used to classify the motor movement tasks at various electrodes. The highest separation was obtained at frontal electrode F5 (AUC=0.9075), F2 (AUC=0.8562), F4 (AUC=0.8475), F7 (AUC=8125), F8 (AUC=0.80000) and F3 (AUC=0.7830). The other occipital and central electrodes show minimum separation.
Conclusion and Future Work
Motor control is defined as the process of restricting the output of the motor nervous system so that meaningful and coordinated behaviour ensues. Contralateral brain hemispheres control human limbs. The Event-Related De-synchronization (ERD) occurs predominantly over the contralateral hemispheres due to the physical movement or motor imaginary movements of eyes and hands. Moreover, Event-Related Synchronization (ERS) is also associated with contralateral motor areas. The aim of this study is to investigate the dynamics of EEG signals with motor movement tasks with EC and EO conditions. We explored that how the neural activity is coordinated across different spatial and temporal scales and to determine the phenomenon of ERD/ERS related to motor imagery is stronger in which parts of brain. Likewise, we investigated the dynamics of EEG motor movements tasks using PE to quantify the dynamics in motor tasks specially in helping disabled individuals by providing a new channel of communication with the external environment and offering a feasible tool to control artificial limbs. Depending on the type of motor imagery, different EEG patterns can be obtained. Activation of hand area neurons either by preparation for a real movement or by imagination of the movement is accompanied by a circumscribed Event-Related De-synchronization (ERD) focused at the hand area. In the present study, we have applied MPE to distinguish the Eye open to Eye closed tasks during EEG Motor Movement/Imagery. MPE is a powerful tool to quantify the dynamics of complex time series that compute the probability distribution and complex system states with relevant encoded information. The results reveal that mean ranks of EC tasks higher found higher than the EO condition at various temporal scales which shows that EC tasks show higher complexity than EO. The complexity decreases when the individual open their eyes. To differentiate the differences among the tasks, Mann-Whitney test was applied that gives significant differences among these groups at different electrodes based on the international 10-20 system. The highest accuracy and separation was obtained at Frontal electrodes followed by front polar, parietal, occipital and central electrodes. The present study is focused on motor movement tasks with eye open and closed conditions, however for future research we will quantify the dynamics and neural activities of other motor movement/imaginary tasks such as hands, fists etc. with respect to age and gender as well.
References
- Bhattacharya J. Complexity analysis of spontaneous EEG. Acta Neurobiol Exp 2000; 60: 495-502.
- Geng S, Zhou W. Nonlinear feature comparison of EEG using correlation dimension and approximate entropy. In Biomed Eng Inform IEEE 2010; 3: 978-981.
- Choi SH, Lee M, Wang Y, Hong B. Estimation of optimal location of EEG reference electrode for motor imagery based BCI using fMRI. In Eng Med Biol Soc IEEE 2006; 1193-1196.
- Sburlea AI, Montesano L, de la Cuerda RC, Diego IM, Miangolarra-Page JC, Minguez J. Detecting intention to walk in stroke patients from pre-movement EEG correlates. J Neuroeng Rehabilit 2015; 12: 113.
- Goldman RI, Stern JM, Engel Jr J, Cohen MS. Simultaneous EEG and fMRI of the alpha rhythm. Neurorep 2002; 13: 2487.
- Ritter P, Moosmann M, Villringer A. Rolandic alpha and beta EEG rhythm’s strengths are inversely related to fMRI‐BOLD signal in primary somatosensory and motor cortex. Hum Brain Mapping 2009; 30: 1168-1187.
- Marx E, Stephan T, Nolte A, Deutschländer A, Seelos KC, Dieterich M, Brandt T. Eye closure in darkness animates sensory systems. Neuroimag 2003; 19: 924-934.
- Capurro A, Diambra L, Lorenzo D, Macadar O, Martin MT, Mostaccio C, Plastino A, Perez J, Rofman E, Torres ME, Velluti J. Human brain dynamics: the analysis of EEG signals with Tsallis information measure. Physica A 1999; 265: 235-254.
- Acharya UR, Molinari F, Sree SV, Chattopadhyay S, Ng KH, Suri JS. Automated diagnosis of epileptic EEG using entropies. Biomed Signal Proc Control 2012; 7: 401-408.
- Acharya UR, Sree SV, Ang PC, Yanti R, Suri JS. Application of non-linear and wavelet based features for the automated identification of epileptic EEG signals. Int J Neural Sys 2012; 22: 1250002.
- Acharya UR, Yanti R, Zheng JW, Krishnan MM, TAN JH, Martis RJ, Lim CM. Automated diagnosis of epilepsy using CWT, HOS and texture parameters. Int J Neural Syst 2013; 23: 1350009.
- Bandt C, Pompe B. Permutation entropy: a natural complexity measure for time series. Phys Rev Lett 2002; 88: 174102.
- Pincus SM. Approximate entropy as a measure of system complexity. Proc Nat Acad Sci 1991; 88: 2297-2301.
- Richman JS, Moorman JR. Physiological time-series analysis using approximate entropy and sample entropy. Am J Physiol Heart Circul Physiol 2000; 278: 2039-2049.
- Wei Q, Liu Q, Fan SZ, Lu CW, Lin TY, Abbod MF, Shieh JS. Analysis of EEG via multivariate empirical mode decomposition for depth of anesthesia based on sample entropy. Entropy 2013;15: 3458-3470.
- Zanin M, Zunino L, Rosso OA, Papo D. Permutation entropy and its main biomedical and econophysics applications: a review. Entropy 2012; 14: 1553-1577.
- Cao Y, Tung WW, Gao JB, Protopopescu VA, Hively LM. Detecting dynamical changes in time series using the permutation entropy. Phys Rev E 2004; 70: 046217.
- Nicolaou N, Georgiou J. Detection of epileptic electroencephalogram based on permutation entropy and support vector machines. Expert Syst Appl 2012; 39: 202-209.
- Costa M, Goldberger AL, Peng CK. Multiscale entropy analysis of complex physiologic time series. Phys Rev Lett 2002; 89: 068102.
- Aziz W, Arif M. Multiscale permutation entropy of physiological time series: In 9th International Multitopic Conference. IEEE 2005; 1-6.
- Schalk G, McFarland DJ, Hinterberger T, Birbaumer N, Wolpaw JR. BCI2000: a general-purpose brain-computer interface (BCI) system. IEEE Trans Biomed Eng 2004; 51: 1034-1043.
- Mammone N, Morabito FC. Analysis of absence seizure EEG via Permutation Entropy spatio-temporal clustering. InNeural Networks (IJCNN) IEEE 2011; 1417-1422.
- Plastino A, Rosso OA. Entropy and statistical complexity in brain activity. Europhys News 2005; 36: 224-228.
- Todman JB, Dugard P. Single-case and small-n experimental designs: A practical guide to randomization tests. Psychol Press 2001.
- Motulsky H. Intuitive biostatistics: a nonmathematical guide to statistical thinking. Oxford Univ Press, USA 2013.
- Jeong JU, Tao B, Sagasser I, Henniges H, Sharpless KB. Bromine-catalyzed aziridination of olefins. A rare example of atom-transfer redox catalysis by a main group element. J Am Chem Soc 1998; 120: 6844-6845.
- Besthorn C, Sattel H, Geiger-Kabisch C, Zerfass R, Förstl H. Parameters of EEG dimensional complexity in Alzheimer's disease. Electroencephalography Clin Neurophysiol 1995; 95: 84-89.
- Jelles B, Van Birgelen JH, Slaets JP, Hekster RE, Jonkman EJ, Stam CJ. Decrease of non-linear structure in the EEG of Alzheimer patients compared to healthy controls. Clin Neurophysiol 1999; 110: 1159-1167.
- Costa M, Goldberger AL, Peng CK. Multiscale entropy analysis of biological signals. Phys Rev E 2005; 71: 021906.
- Parlitz U, Berg S, Luther S, Schirdewan A, Kurths J, Wessel N. Classifying cardiac bio-signals using order pattern statistics and symbolic dynamics. Proc Sixth ESGCO 2010; 30: 1-4.
- Frank B, Pompe B, Schneider U, Hoyer D. Permutation entropy improves foetal behavioural state classification based on heart rate analysis from bio-magnetic recordings in near term foetuses. Med Biol Eng Computing 2006; 44: 179.
- Bian C, Qin C, Ma QD, Shen Q. Modified permutation-entropy analysis of heartbeat dynamics. Phys Rev E 2012; 85: 021906.
- Goldberger AL, Amaral LA, Hausdorff JM, Ivanov PC, Peng CK, Stanley HE. Fractal dynamics in physiology: alterations with disease and aging. Proc Nat Acad Sci 2002; 99: 2466-2472.
- Kenet T, Bibitchkov D, Tsodyks M, Grinvald A, Arieli A. Spontaneously emerging cortical representations of visual attributes. Nature 2003; 425: 954.
- Beggs JM, Plenz D. Neuronal avalanches in neocortical circuits. J Neurosci 2003; 23: 11167-11177.
- Dragoi G, Tonegawa S. Preplay of future place cell sequences by hippocampal cellular assemblies. Nature 2011; 469: 397.
- Schindler K, Gast H, Stieglitz L, Stibal A, Hauf M, Wiest R, Mariani L, Rummel C. Forbidden ordinal patterns of periictal intracranial EEG indicate deterministic dynamics in human epileptic seizures. Epilepsia 2011; 52: 1771-1780.
- Stam CJ. Nonlinear dynamical analysis of EEG and MEG: Review of an emerging field. Clin Neurophysiol 2005; 116: 2266-2301.
- Pereda E, Quiroga RQ, Bhattacharya J. Nonlinear multivariate analysis of neurophysiological signals. Progress Neurobiol 2005; 77: 1-37.
- Cao Y, Tung WW, Gao JB, Protopopescu VA, Hively LM. Detecting dynamical changes in time series using the permutation entropy. Phys Rev E 2004; 70: 046217.
- Keller K, Wittfeld K. Distances of time series components by means of symbolic dynamics. Int J Bifurcation Chaos 2004; 14: 693-703.
- Veisi I, Pariz N, Karimpour A. Fast and robust detection of epilepsy in noisy EEG signals using permutation entropy. In Bioinform Bioeng 2007; 200-203.
- Li X, Ouyang G, Richards DA. Predictability analysis of absence seizures with permutation entropy. Epilepsy Res 2007; 77: 70-74.
- Ouyang G, Li X, Dang C, Richards DA. Deterministic dynamics of neural activity during absence seizures in rats. Phys Rev E 2009; 79: 041146.
- Ouyang G, Dang C, Richards DA, Li X. Ordinal pattern based similarity analysis for EEG recordings. Clin Neurophysiol 2010; 121: 694-703.
- Bruzzo AA, Gesierich B, Santi M, Tassinari CA, Birbaumer N, Rubboli G. Permutation entropy to detect vigilance changes and preictal states from scalp EEG in epileptic patients: A preliminary study. Neurol Sci 2008; 29: 3-9.
- Jordan D, Stockmanns G, Kochs EF, Pilge S, Schneider G. Electroencephalographic order pattern analysis for the separation of consciousness and unconsciousness an analysis of approximate entropy, permutation entropy, recurrence rate, and phase coupling of order recurrence plots. J Am Soc Anesthesiol 2008; 109: 1014-1022.
- Li X, Cui S, Voss LJ. Using permutation entropy to measure the electroencephalographic effects of sevoflurane. Anesthesiology: J Am Soc Anesthesiol 2008; 109: 448-456.
- Olofsen E, Sleigh JW, Dahan A. Permutation entropy of the electroencephalogram: a measure of anaesthetic drug effect. Brit J Anaesth 2008; 101: 810-821.
- Silva A, Cardoso-Cruz H, Silva F, Galhardo V, Antunes L. Comparison of anesthetic depth indexes based on thalamocortical local field potentials in rats. Anesthesiology: J Am Soc Anesthesiol 2010; 112: 355-363.
- Silva A, Campos S, Monteiro J, Venâncio C, Costa B, de Pinho PG, Antunes L. Performance of anesthetic depth indexes in rabbits under propofol anesthesia prediction probabilities and concentration-effect relations. J Am Soc Anesthesiol 2011; 115: 303-314.
- Schinkel S, Marwan N, Kurths J. Order patterns recurrence plots in the analysis of ERP data. Cognitive Neurodynamics 2007; 1: 317-325.
- Schinkel S, Marwan N, Kurths J. Brain signal analysis based on recurrences. J Physiol 2009; 103: 315-323.
- Hussain L, Aziz W, Alowibdi JS, Habib N, Rafique M, Saeed S, Kazmi SZ. Symbolic time series analysis of electroencephalographic (EEG) epileptic seizure and brain dynamics with eye-open and eye-closed subjects during resting states. J Physiol Anthropol 2017; 36: 21.
- Rathore S, Iftikhar A, Ali A, Hussain M, Jalil A. Capture largest included circles: An approach for counting red blood cells. Emerg Trends Appl Info Commun Technol 2012; 373-384.
- Qumar A, Aziz W, Saeed S, Ahmed I, Hussain L. Comparative study of multiscale entropy analysis and symbolic time series analysis when applied to human gait dynamics. Open Source Systems and Technologies (ICOSST), 2013 International Conference 2016; 126-132.
- Hussain L, Aziz W, Nadeem SA, Shah SA, Majid A. Electroencephalography (EEG) analysis of alcoholic and control subjects using multiscale permutation entropy. J Multidiscip Eng Sci 2014; 1: 380-387.
- Hussain L, Aziz W, Saeed S, Shah SA, Nadeem MS, Awan IA, Abbas A, Majid A, Kazmi SZ. Quantifying the dynamics of electroencephalographic (EEG) signals to distinguish alcoholic and non-alcoholic subjects using an MSE based Kd tree algorithm. Biomed Tech (Berl) 2017.