- Biomedical Research (2015) Volume 26, Issue 2
Comparative analysis of optical coherence tomography retinal images using multidimensional and cluster methods.
Mohandass G1, Ananda Natarajan R2 & Hari Krishnan G11Research Scholar, Faculty of Electronics Engineering, Sathyabama University, Chennai, India.
2Department of Electronic and Instrumentation Engineering, Pondicherry Engineering College, Pondicherry, India.
- Corresponding Author:
- G. Hari Krishnan
Department of Biomedical Engineering
Sathyabama University
Chennai, India
Accepted Date: January 07 2015
Abstract
Optical coherence tomography (OCT) has many uses in medicine and engineering biology. It is a non-invasive technique for looking at the layered structures of tissues, such as skin, retina, teeth, and heart. Scanning of the retinal image reveals defects in the underlying layers. OCT performs in situ high resolution cross sectional imaging on a micron scale in real time. An application of OCT is in the imaging of diseases such as central serous retinopathy (CSR), which is the result of fluid accumulation under the macula. In the acquired OCT image, an inherent characteristic of coherent imaging is the presence of speckle noise. Reduction of speckle noise is one of the most important considerations for increasing the quality of coherent images. To enhance the quality, different filtering techniques are applied to analyze spectral noise in a CSR-OCT image. To analyze the effectiveness of the applied filtering techniques, various statistical parameters are applied and studied, such as the mean square error, peak signal to noise ratio, normalized crosscorrelation, and normalized absolute error. In this study, the resultant statistical information from the applied statistical parameters is subjected to multidimensional analysis to determine the best filtering technique to reduce speckle noise in CSR-OCT images.
Keywords
Image analysis; Noise in imaging systems; Image detection systems; Transforms; Computational imaging; Optical coherence tomography; Ophthalmology; Coherence and statistical optics
Introduction
Optical coherence tomography (OCT) has recently become a significant primary method for non-invasive mapping in the ocular pathologic diagnosis process of human retinal diseases. The structure of the retina is represented as a pseudo image in each section of mapping. In this study, the retinal disease central serous retinopathy (CSR) is used as an example for analysis (Figure 1). In this disease, fluid accumulates in the retina layer between the choroid and photoreceptor, and symptoms generally include blurred, distorted vision or micropsia [1]. The evolved OCT image is of a nondeterministic kind. In an OCT image, an irresolvable random tissue inhomogeneity of the retina layers might probabilistically lie across pixels (i.e., show speckle) because of the complexities of constructive and destructive interference in OCT B-scan images.

Figure 1: Optical Coherent Tomography Image of Central Serous Retinopathy Diseases.
Coherent pulses always travel in a straight line, to and fro (backscattered echo waves), and generate a new echo at twice the depth in biological tissue as of experimental procedure in Michelson interferometer for acquiring OCT images. Speckle noise is not inherent in an image but rather the effect of diffuse and multiple patterns of scattering caused by the inherent variation of sample properties [2].
The primary challenge in the image processing community is the study and performance of better image restoration in the presence of noise that accommodates the advancing technology of image sensors, chips, and modern capture devices. Camera manufactures, e.g., depend on effective denoising algorithms to reduce the noise artifacts in images. An effective state-of-the-art denoising algorithm must address the questions of whether the performance limit of the algorithm has been attained and that the results of the process are comparable and repeatable.
There are two main sources of statistical uncertainty (noise) in OCT data. (i) Inhomogeneous tissue layers cause random variations in refraction, resulting in unequal distribution of intensity in the image (ii) The structure of different retina cell layers result in random differences in reflectance. This spatial random variation results in nonexponential formation of OCT images. Before engaging in a statistical analysis of image denoising, the image formation model is given below:
yi = zi + μi (1)
where zi is the actual pixel intensity (the recovery of which is the goal) at location xi (indexed by i) and yi is the observed pixel intensity. The corrupting noise is given by μi in Eq. (1), which is independently distributed [3].
In this study, we analyze the following filters applied to OCT images: trimmed average filter, max filter, min filter, median filter, inverse filter, adaptive filter, Wiener filter, average filter, Lee filter, Kuan filter, wavelet denoising, statistical filter, two-dimensional (2D) finite impulse response (FIR) filter, and entropy filter. Statistical image processing is the most significant and comprehensive methods of image quality measurement. Statistical analysis is a very sensitive measure of various kinds of distortions, data hiding, and coding artifacts.
Our aim is to study the fundamental boundary frame on the basis of the performance of denoising algorithms through the comparative process of analysis and categorize similar kinds of state-of-the-art algorithms. However, the bounds of our study are developed in a much more general setting, and, to the best of our knowledge, no comparable study currently exists for the problem of denoising [4,5].
The measurements performed include the statistical parameters reflecting image quality: mean square error (MSE), peak signal to noise ratio (PSNR), and normalized cross-correlation (NCC) and normalized absolute error (NAE). Multidimensional scaling (MDS) is a primary utility for evaluating similarities and dissimilarities between various measurements (Euclidean distance model) of the results of filter algorithms applied to CSR-OCT images. The MDS model is nonlinear, and this exploratory data analysis technique relies on a spatial mapping of relationships between objects in multiple dimensions. In the Euclidean distance model, data representing similarity or dissimilarity are grouped using the highest common factor [6].
Classification or categorization by cluster analysis is performed by separating data into relatively homogeneous groups. Within the major subdivisions of clusters, evaluation is performed using the hierarchical cluster analysis and k-means clustering method; hierarchical clustering is a widely used approach. Conceptually, grouping is accomplished by building binary trees based on the similarity of the data. The hierarchical cluster analysis is conducted by agglomerative strategies (i.e., “bottom up” approach). K-means clustering is an effective tool for fixing the number of groups for data clustering, and it is a relatively simple and efficient clustering method that employs nonhierarchical procedures and unsupervised learning algorithms. Hence, in this study, we have chosen the kmeans clustering method [7].
Computational Methods and Procedures
We applied different filter techniques for denoising a CSR-OCT image for comparison and evaluation. The filter techniques minimize, reduce, or suppress the affect or disturbance due to the omnipresence of noise within images. The original image is first converted to a gray scale image and then subjected to a filter analysis [8].
Filter Techniques
In this study, we applied the following standard filter techniques for the purpose of comparison and evaluation: trimmed average filter, max filter, min filter, median filter, inverse filter, adaptive filter, Weiner filter, average filter, Lee filter, Kuan filter, wavelet filter, statistical filter, 2D FIR filter, and entropy filter [9-13]. These filters are chosen based on their results produced in other biomedical images. They represent the sample of filters considered for this study, although many more filters have been proven to perform better. However, this sample has been chosen to demonstrate the novel method of evaluating the characteristics of filters using clustering techniques.
Statistical Image Analysis
We use an assortment of statistical techniques to comprehensively categorize image quality measures that have been computed for grouping and classifying of similar filter sets [14,15].
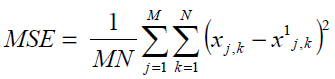
Mean Square Error
MSE is the best statistical mathematical parameter chosen to quantify errors due to image noise contamination. The analysis is conducted by subtracting test images from a reference image as follows:
 (2)
(2)
 (3)
(3)
 (4)
(4)
 (5)
(5)
 (6)
(6)
where, x(j,k) and x(j,k) are the reference and test images, respectively and M and N are the number of rows and columns, respectively, in the input images.
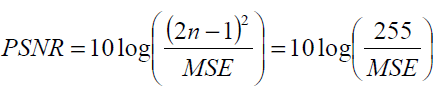
Peak Signal to Noise Ratio
PSNR is determined on a logarithmic decibel scale and is inversely proportional the MSE, as an alternative to the MSE. The PSNR gives the magnitude of the difference between two images, as expressed by Eq. (3). It is the ratio of the maximum possible intensity of an image to the intensity of the corrupting noise that affects the information of the image. Therefore, higher the PSNR value, closer a test image is to the original image.
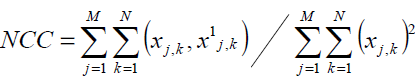
Normalization Cross-Correlation
Patterns between two images can also be template matched in terms of a correlation function. A measure of the NCC yields similarity between two images. A large NCC value indicates a poor quality image. This computation is given by Eq. 4.
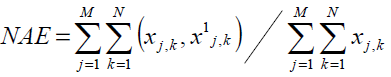
Normalized Absolute Error
Normalization is a process of magnitude measurement whereby the statistical error in repeated data is eliminated. A large NAE value indicates a poor quality image. The NAE computation is given by Eq. (5).
The filter output image is taken as an input of the “distorted image” and another input is taken as the “original image.” The two images are compared by cross validation using the parameters MSE, PSNE, NCC, and NAE for quality analysis of the filtered image relative to each method. Methods such as MDS can be employed for cross validating one filter technique with the others.
Multidimensional Scaling
MDS is a cluster structure analysis approach that can be employed even for nonlinear data that scales measurements of similarities/dissimilarities in terms of distance. Cluster analysis is further developed by the Euclidean distance model, hierarchical cluster analysis, and k-means clustering.
In this study, clustering and classification are both fundamental objectives for identifying the similarities/ dissimilarities of filters via the acquired statistical data. Clustering is used for classification, as well as for a supervised learning method [16,17].
Euclidean Distance Model
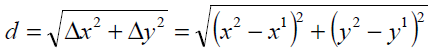
The distance between two points on the x and y plane can be found using the distance formula and Pythagorean theorem [12]. The distance between points (x1, y1) and (x2, y2) is given by Eq. 6.
Using MDS data, the Euclidean distance model provides a measure of the similarity and dissimilarly between filtering techniques
Hierarchical Cluster Analysis
This clustering procedure operates by exploring the specific nature of the filtered images and arranges groups based on the similarities of the methods [12]. Here, the agglomerative approach (i.e., association of n clusters to obtain 1 cluster) is applied for grouping data. Dendrograms represent the nested level of similar groupings of filter techniques. Here, Ward’s cluster method is implemented. Ward’s method generates clusters in accordance with the total sum of squared deviations from the mean of a cluster.
K-means Clustering
K-means clustering is a nonhierarchical, gradient descent procedure [18]. The hierarchical cluster analysis is predefined work for k-means clustering because the hierarchical cluster procedure determines the numbers of clusters to be considered in the k-means clustering approach. Kmeans clustering is the most widely used method of clustering. In addition to using the hierarchical cluster procedure, a very simple method of finding the number of clusters to be considered by the k-means cluster approach is through the “rule of thumb” described by Eq. (7).
 ( 7)
( 7)
The variable, n, above represents the number of filtering methods employed. As an example, for n = 8, K = 2. The K value is fixed and begins with the center as the initial cluster. Based on the threshold values set, the nearest cluster is formed by the distance from the center of the initial clusters and the mean values of methods in each cluster, i.e., cluster centers are calculated. The k-means algorithm is chosen based on clustering methods of nonlinear complexity, ease of interpretation, simplicity of implementation, speed of convergence, adaptability to sparse data, and sensitivity to noisy and outlying data.
Results and analysis
The results of application of various filters to the image in Figure 1 are shown in the Figure 2, consisting of gray scale image (A), trimmed filter (B), max filter (C), min filter (D), median filter (E), inverse filter (F), adaptive filter (G), Wiener filter (H), average filter (I), Lee filter (J), Kuan filter (K), wavelet Filter (L), 2D FIR filter (M), statistical filter (N), and entropy filter (O). In what follows, the computational results of the Euclidean distance, hierarchical clustering, and kmeans clustering are performed using the IBM statistical package for social sciences software.

Figure 2: Output images of filtering techniques applied to the CSR-OCT image in Fig. 1. A: grey scale image, B: trimmed average filters, C: max filter, D: min filter, E: median filter, F: inverse filter, G: adaptive filter, H: Wiener filter, I: average filter, J: Lee filter, K: Kuan filter, L: wavelet denoising filter, M: 2D-FIR filter, N: statistical filter and O: entropy filter.
The Euclidean distance method groups the similarity/ dissimilarity of the filters on the basis of the MDS data. Dimensions 1 and 2 represent the multidimensional values of the MDS, where equal diagonal values corresponding to the x and y-axis, respectively. As shown in Figures 3–6 the Euclidean distance plots are divided according to quadrants, where the upper right corner is the first quadrant, the upper left corner is the second quadrant, the bottom left corner is the third quadrant, and the bottom right corner is the fourth quadrant.

Figure 3: Mean square error Euclidean distance model.

Figure 4: Peak signal to noise ratio Euclidean distance model.

Figure 5: Normalized cross-correlation Euclidean distance model.

Figure 6: Normalized absolute error Euclidean distance model.
Similar filters grouped according to the MSE, wavelet, Weiner, average, median, max, and min filters and Lee as shown in figure 3. According to the PSNR, 2D FIR, wavelet, and adaptive filters similar groups are formed in the first quadrant as shown in figure 4. The statistical and Weiner filters form another similar group. Another group of similar filters is composed of Kuan, entropy, and inverse filters. The remaining filters are scattered.
As shown in Figure 5, the groupings according to the NCC quadrant by quadrant in the first quadrant: min, max, median, trimmed, and statistical filters; the second quadrant: entropy, Kuan, Lee, and 2D FIR filters; the third quadrant: inverse and adaptive filters; the fourth quadrant: wavelet, Wiener, and average filters. As shown in Figure 6, the groupings according to the NAE quadrant by quadrant in the first quadrant: Wiener, statistical, max, and trimmed filters; the second quadrant: median, Kuan, adaptive, and average filters; the third quadrant: wavelet, 2D FIR, and inverse filters; the fourth quadrant: Lee, min, and entropy filters.
As shown in Figure 3, groupings according to the MSE quadrant by quadrant in the first quadrant: adaptive, Kuan, and entropy filters; the second quadrant: median, max, and min filters; the third quadrant: wavelet, Wiener, Lee, average, statistical, and 2D FIR filters; the fourth quadrant: inverse and trimmed filters. As shown in Figure 4, groupings according to the PSNR quadrant by quadrant in the first quadrant: Wiener, statistical, 2D FIR, wavelet, and entropy filters; the second quadrant: trimmed, Kuan, inverse, and adaptive filters; the third quadrant: min, max, median, and average filters; the fourth quadrant: only Lee filter.
As shown in Figure 5, similar filters grouped according to the NCC are the median, trimmed, max, and min filters followed by the statistical filter in the first quadrant. Another group consists of the Kuan, Lee, and 2D FIR filters. The Weiner, wavelet, and average filters form another group. The remaining filters are dissimilar. As shown in Figure 6, similar filters grouped according to the NAE are the adaptive, Kuan, and median filters. Apart from these groups of filters, all others are scattered and dissimilar [19].
From the Euclidean model, the common filters based on all statistical parameters, MSE, PSNR, NCC, and NAE are as follows. In the first quadrant are the statistical, Wiener, and entropy filters. The statistical filter is found in this quadrant for most of the parameters. The second quadrant filters are Kuan, median, and adaptive. In this quadrant, the Kuan filter is the most common filter. The third quadrant filters are wavelet, inverse, 2D FIR, and average. In the fourth quadrant, the Lee filter is found. In the overall evaluation and analysis, the maximum clustering from the Euclidean distance model in the first quadrant is the statistical filter and that of the second quadrant is the Kuan filter. The third and fourth quadrants do not exhibit maximum repeatability like the first and second quadrants, so these quadrants were disregarded The sample of the 19en image (CSE1-19) taken from the same instrument (Ophthalmology, Inc.) is used for analysis. Although the cross sectional area of interest differs for each image, the data resemble the same. The examined image is computed on a constant dimension [20,21].
The graphical output of comparing the (CSE1-19) image using statistical parameters MSE, PSNR, NCC, and NAE resembles the same values, as shown in the Figures 7–10.

Figure 7: Comparing values of the central serous retinopathy image (CSE1-19) by the mean square error.

Figure 8: Comparing values of the central serous retinopathy image (CSE1-19) by the peak signal to noise ratio.

Figure 9: Comparing values of the central serous retinopathy image (CSE1-19) by the normalized cross-correlation.

Figure 10: Comparing values of the central serous retinopathy image (CSE1-19) by the normalized absolute error.
Based on subtrees, the results of the computed tree clustering methods are identified. The analysis of the hierarchical clustering statistical parameter is explained below. Using the MSE, as shown in Figure 11, similar cluster filter techniques based on the hierarchical clustering dendrogram are average, statistical, Weiner, Lee, 2D FIR, and wavelet filters. The second cluster consists of min and median filters. The third cluster is formed from in verse and Kuan filters. The fourth cluster is adaptive and entropy filters. The fifth cluster contains trimmed and max filters. Using the PSNR, most of the filter techniques are similar, as shown in Figure 12. The first cluster contains medium, Lee, Weiner, min, Kuan, average, statistical, max, wavelet, and 2D FIR filters. The second cluster consists of adaptive, entropy, and inverse filters. The third cluster is the trimmed filter. Using the NCC, all the filters are similar except for the adaptive filter, as shown in Figure 13.

Figure 11: Hierarchical clustering of data using the mean square error.

Figure 12: Hierarchical clustering of data using the peak signal to noise ratio.

Figure 13: Hierarchical clustering of data using the normalized cross-correlation.
Using the NAE, three clusters are formed, as shown in Figure 14. One set consists of trimmed, statistical, 2D FIR, Lee, and Weiner filters. The second set is composed of median, wavelet, Kuan, and average filters. The third cluster is formed of inverse, adaptive, max, and entropy filters. Dissimilarity is identified with respect to all other filter techniques by this statistical parameter.

Figure 14: Hierarchical clustering of data using the normalized absolute error.
In the general analysis of the hierarchical cluster approach, the most common among all cluster groups are the statistical and Wiener filters in statistical parameters.
K-means clustering is conducted according to the “rule of thumb” by which, n = 15, K = 3, and the clustering graphs for the various statistical parameters are shown in Figures 15–18. In the analysis the k-means output, the MSE, PSNR, NCC, and NAE are mostly linear and no drastic change in output is visualized.

Figure 15: K-mean values of the mean square error for K = 3.

Figure 16: K-mean values of the peak signal to noise ratio for K = 3.

Figure 17: K-mean values of the normalized cross-correlation for K = 3.

Figure 18: K-mean values of the normalized absolute error for K = 3.
K-means clustering was performed using K = 2 and 3 for comparison. Using the MSE, the clustered filters for K = 3 are adaptive, inverse, and entropy. Similarly, for K = 2, the clustered filters are Weiner, average, Kuan, wavelet, statistical, and 2D FIR. Using the PSNR, the cluster for K = 3 consists of max, min, median, Weiner, average, Lee, Kuan, wavelet, statistical, and 2D FIR filters. Similarly, the K = 2 cluster contains inverse and entropy filters. Using the NCC, for K = 3, the cluster contains the 2D FIR, statistical, wavelet, Kuan, and Lee filters. Similarly, the K = 2 cluster consists of trimmed, max, min, median, inverse, Weiner, average, and entropy filters. Using the NAE, for K = 3, the cluster contains only the inverse filter. Similarly, for K = 2, the cluster contains min, Weiner, average, and 2D FIR filters.
From analysis of all outputs of the Euclidean, hierarchical, and k-means clustering approaches, the most common filters based on cluster repeatability are expressed in two stages. In the first stage, the most preferable and considered to be most suitable according this study is the statistical filter. In the second stage are the Weiner and Kuan filters. The first stage filter is more dominant in OCT images.
So far, all evaluation has been conducted by the MDS. In Figure 19, the individual formulae for PSNR, MSE, NCC, and NAE are applied to the CSR-OCT filters and the values are attained to form the graph. This output reveals that the PSNR parameter is very important for two reasons. First, the increase in the value is indicative of the quality of the image, and the second regards the clustering of the filters in the grouping range. Thus, this make to analysis the PSNR value with respect to the Euclidean distance model, hierarchical clustering, and k-means clustering in the multidimensional values. This reveals that the statistical filter is uniquely common among all the clustering techniques considered in this analysis. This is the primary result that we determined by the clustering techniques considered. There are other methods to identify effective filtering techniques. However, through the MDS methods employed for combinational evaluation of statistical techniques such as PSNR, MSE, NCC, and NAE with the filters considered, we determined by the number of repeated clusters in the combined statistical techniques that the statistical filter is the most effective for CSR-OCT images convoluted with speckle noise. For other filters, the results may be different. Here, basic and fundamental filters have been chosen. These basic and fundamental filters were chosen because they derive from decades of research and lead the path toward more effective filters. This novel clustering method of evaluation provides nonredundant data by which systematic identification of similar sets of filters and commonly repeated filters results in better identification of the most effective filter for the application considered.

Figure 19: Statistical techniques applied in CSR filtered image.
Conclusion
In this study, various denoising techniques are analyzed by statistical image processing methods. The results of filtering techniques are analyzed for evaluation and categorization into similar groups using the standard statistical parameters MSE, PSNR, NCC, and NAE. Cluster analysis data derived from the Euclidean distance model, hierarchical clustering, and k-means clustering are determined via statistical parameters. Classification of similar filters indicates that the most similar filter techniques are the statistical, Weiner, and Lee filters followed by the average and wavelet filters. Apart from these, dissimilar categorization is found with respect to filtering techniques and statistical parameters. In general, the statistical filter is more effective in CSR-OCT images. Future work will be pursuing analysis by neural fuzzy techniques.
Competing interests
The authors declare that they have no competing interests.
Acknowledgement
We acknowledge Mr. C. Raja, for providing OCT images from Aravind Eye Hospital, Pondicherry. Special thanks to Mr. C. Sathish Gunasekaran and the Director of RIOGOH, Egmore, in support of OCT images. Special thanks to Mr. T. Vishnu and Dr. R. Ravanan, Presidency College, Chennai for their helpful contributions during the development of this study.
References
- MD Abrà moff, MK Garvin, M Sonka, Retinal imaging and image analysis. IEEE Reviews in Biomedical Engineering 3, 169?208 (2009).
- A Wong, A Mishra, K Bizheva, DA Clausi, General Bayesian estimation for speckle noise reduction in op tical coherence tomography retinal imagery. Opt. Express 18, 8338?8352 (2010).
- P Chatterjee, P Milanfar, Is denoising dead?? IEEE Transactions on Image Processing 19(4), 895?911 (2010).
- P Chatterjee, P Milanfar, Patch-based near-optimal image denoising. IEEE Transactions on Image Processing 21(4), 1635?1649 (2012).
- J Xu, H Ou, C Sun, PC Chui, X Victor, D Yang, EY Lam, KKY Wonga, Wavelet domain compounding for speckle reduction in optical coherence tomography. Journal of Biomedical Optics 18(9), 096002?7 (2013).
- NM Grzywacz, J de Juan, C Ferrone, D Giannini, D Huang, G Koch, V Russo, O Tan, C Bruni, Statistics of optical coherence tomography data from human Retina. IEEE Transactions on Medical Imaging 29(6), 1224?1237 (2010).
- PG Firat, E Ozsoy, S Demirel, T Cumurcu, A Gunduz, Evaluation of peripapillary retinal nerve fiber layer, macula and ganglion cell thickness in amblyopia using spectral optical coherence tomography. Int J Ophthalmol. 6(1), 90?94 (2013).
- K Dabov, A Foi, V Katkovnik, KO Egiazarian, Image denoising by sparse 3-D transform-domain collaborative filtering. IEEE Transactions Image Processing 16(8), 2080?2095 (2007).
- A Markus, AB Mayer, M Wagner, J Hornegger, CY Mardin, and RP Tornow, Wavelet denoising of ultiframe optical coherence tomography data. Biomed. Opt. Express 3(3), 572?589 (2012).
- TR Hillman, A Curatolo, BF Kennedy, DD Sampson, Detection of multiple scattering in optical coherence tomography by speckle correlation of angle dependent B-scans. Opt. Lett. 35(12), 1998?2000 (2010).
- M Hughes, M Spring, A Podoleanu, Speckle noise reduction in optical coherence tomography of paint layers. Appl. Optics 49(1), 99?107 (2010).
- H Wang, AM Rollins, Speckle reduction in optical coherence tomography using angular compounding by Bscan Doppler-shift encoding. J. Biomed. Opt. 14(3), 030512?3 (2009).
- BF Kennedy, A Curatolo, TR Hillman, CM Saunders, DD Sampson, Speckle reduction in OCT images using tissue viscoelasticity. Journal of Biomedical Optics. 16(2), 020506?3 (2011).
- U von Luxburg, Clustering stability: an overview. Foundations and Trends in Machine Learning 2(3), 235?274 (2010).
- LW Ma, JS Zhang, J Xu, J Zhang, P Zhao, Evaluation of computerized image analysis system for quantification of posterior capsular opacification. Int J Ophthalmol. 2(1) (2009).
- A Buja, DF Swayne, M Littman, N Dean, H Hofmann, Interactive data visualization with multidimensional scaling. Journal of Computational and Graphical Statistics 17(2), 444?472 (2008).
- P Chatterjee, P Milanfar, Clustering-based denoising with locally learned dictionaries. IEEE Trans. Image Processing 18(7), 1438?1451 (2009).
- Y Kikutani, A Okamoto, XH Han, X Ruan, Y Chen, Hierarchical classifier with multiple feature weighted fusion for scene recognition. 2nd International Conference on Software Engineering and Data Mining. 1, 648?651 (2010).
- M Maier, M Hein, U von Luxburg, Optimal construction of k-nearest neighbor graphs for identifying noisy clusters. Theoretical Computer Science 410(19), 1749?1764 (2009).
- L Zhang, D Zhang, X Mou, FSIM: a feature similarity index for image quality assessment. IEEE Transactions Image Processing 20(8), 2378?2386 (2011).
- RJ Hemalatha, G Mohandass, G Hari Krishnan, G Uma Shankar, Tissue characterization in prostatic lesion using statistical feature analysis. CIIT International Journal of Digital Image Processing 4(10), 524?528 (2012).